. 2019 Mar 1;29(3):1150-1161.
doi: 10.1093/cercor/bhy021.

Determinants of Optogenetic Cortical Spreading Depolarizations

Affiliations

Determinants of Optogenetic Cortical Spreading Depolarizations

David Y Chung et al. Cereb Cortex. .

Abstract

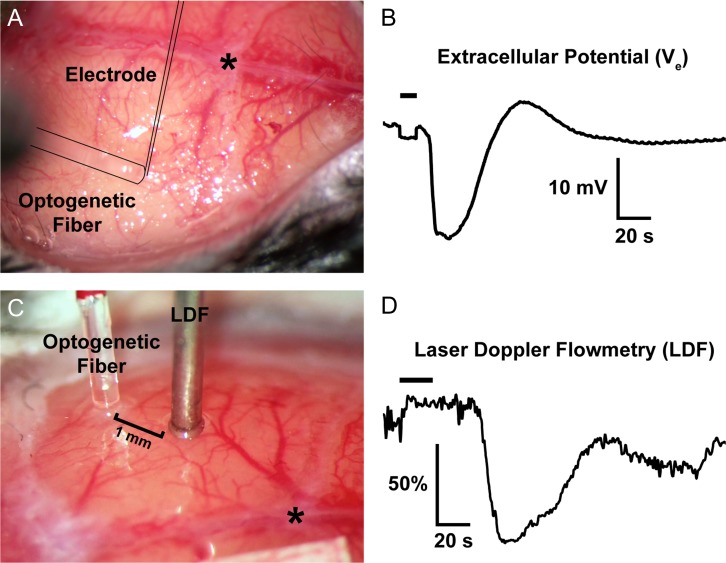
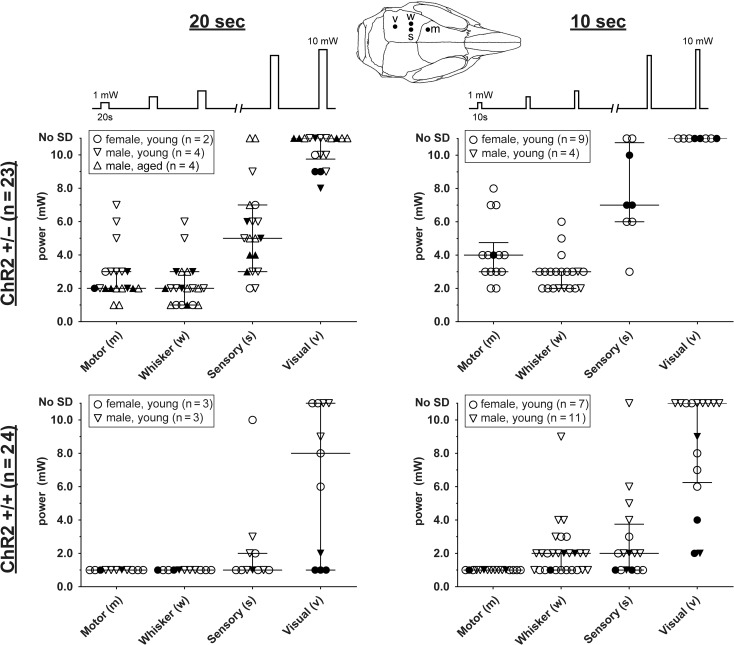
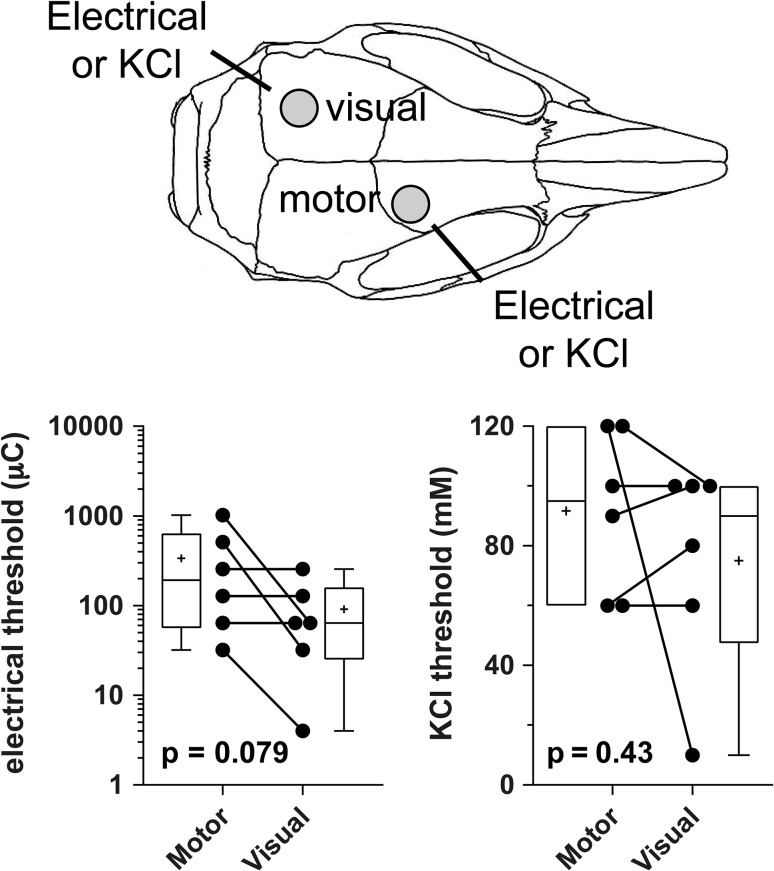
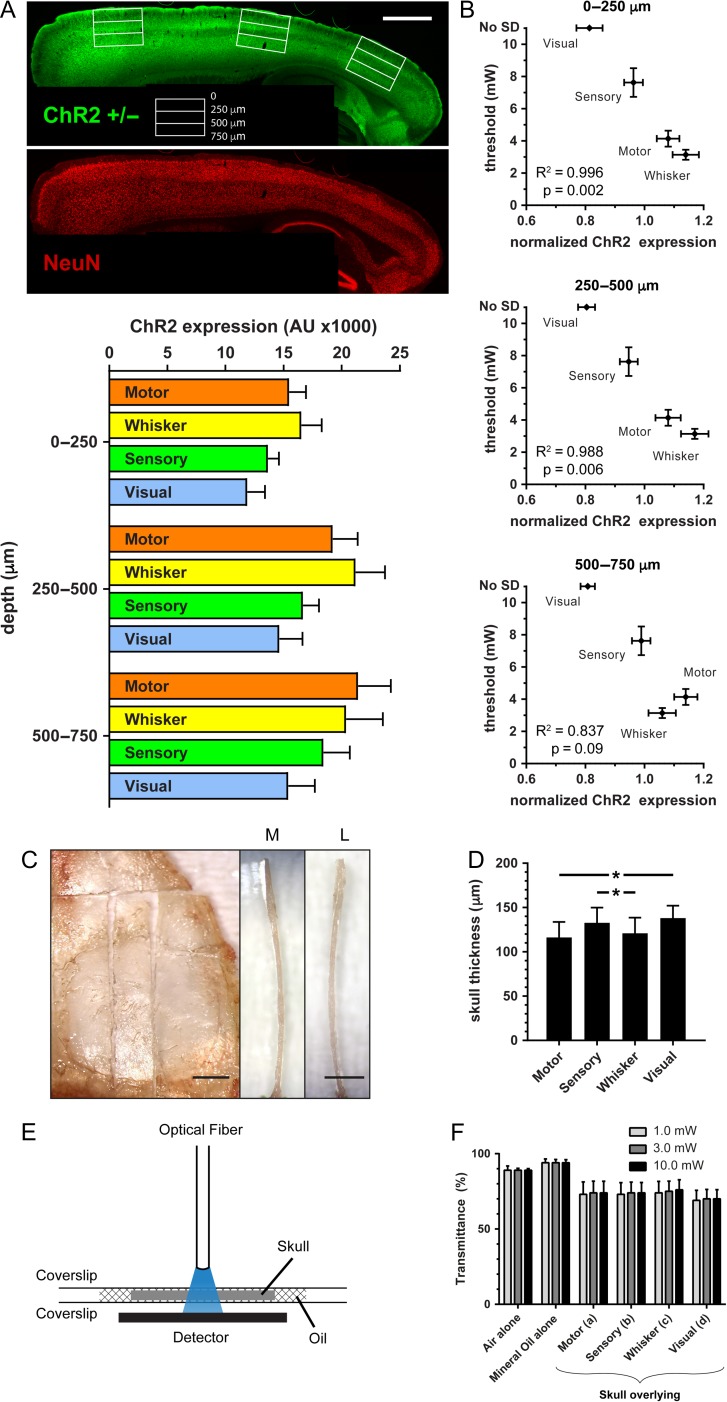
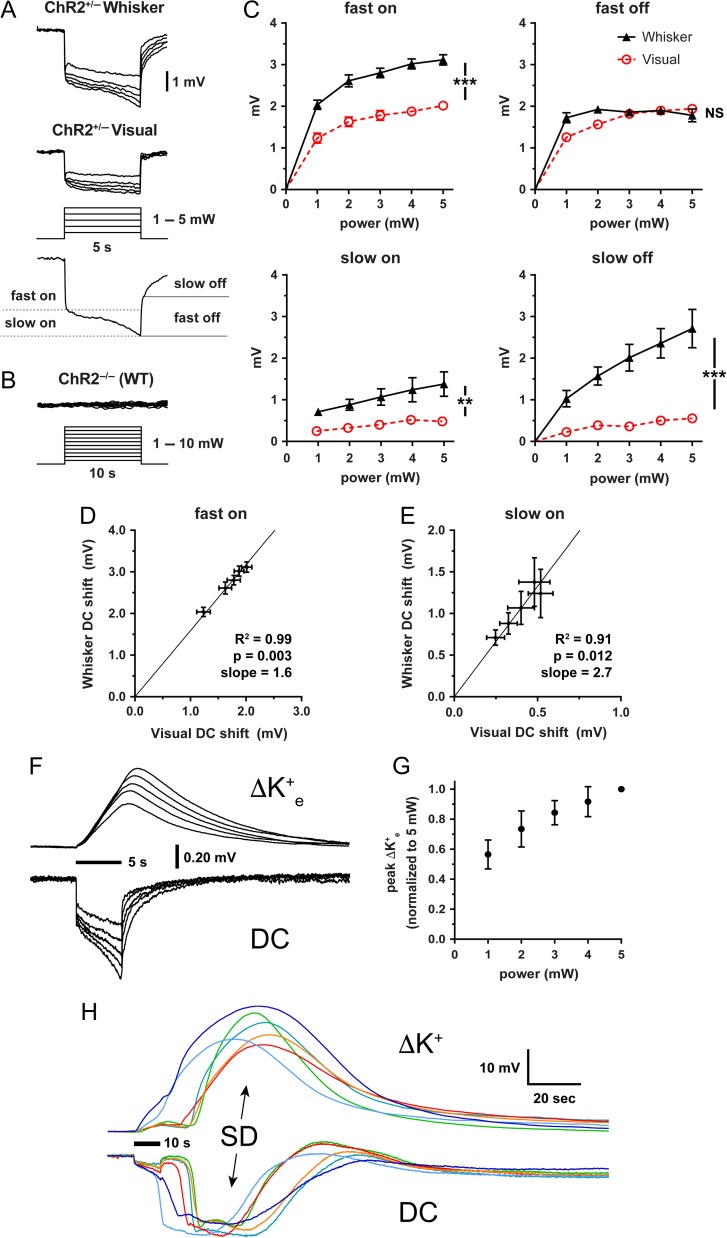
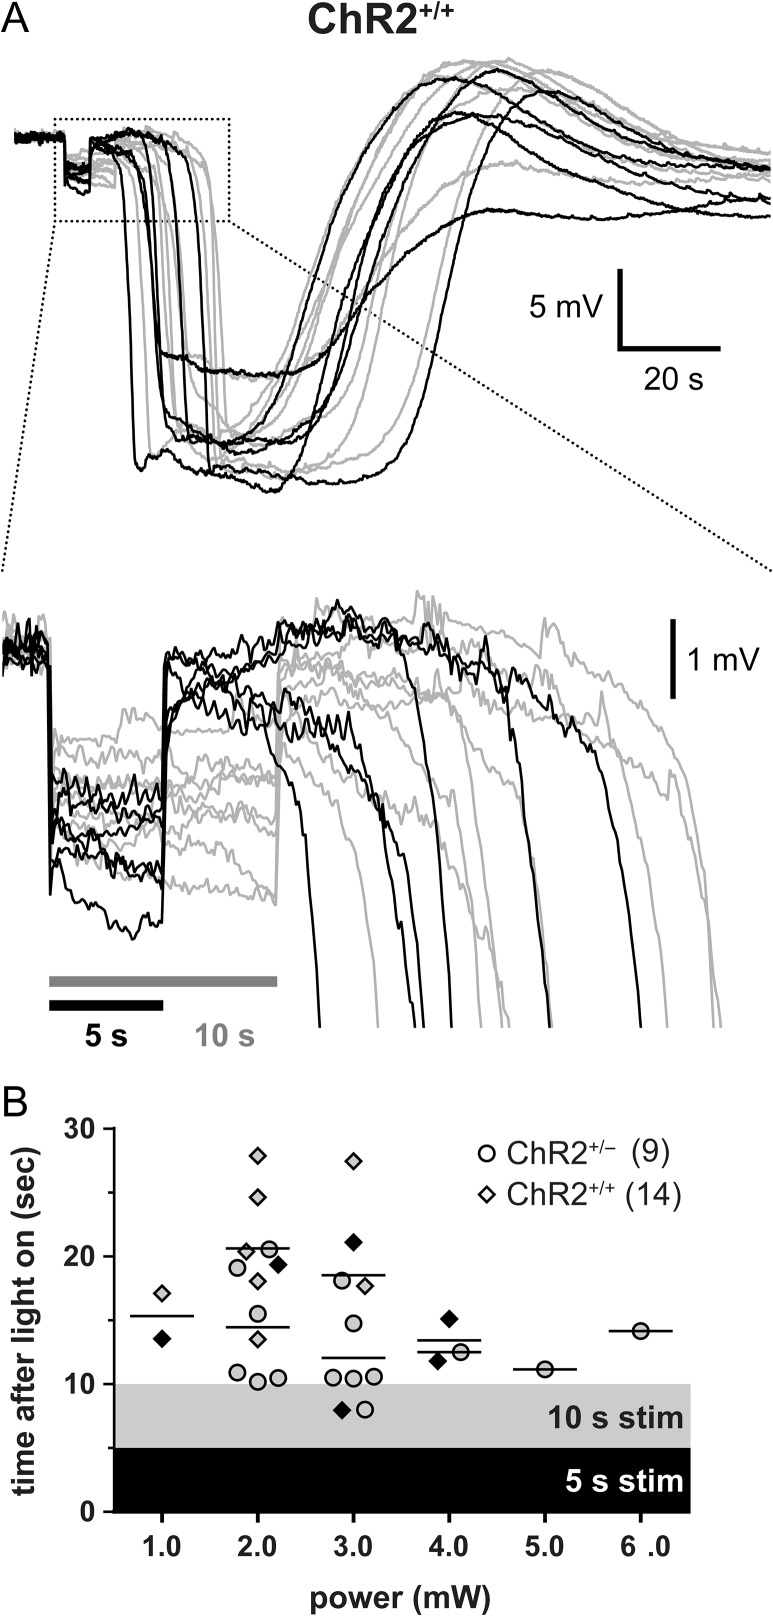
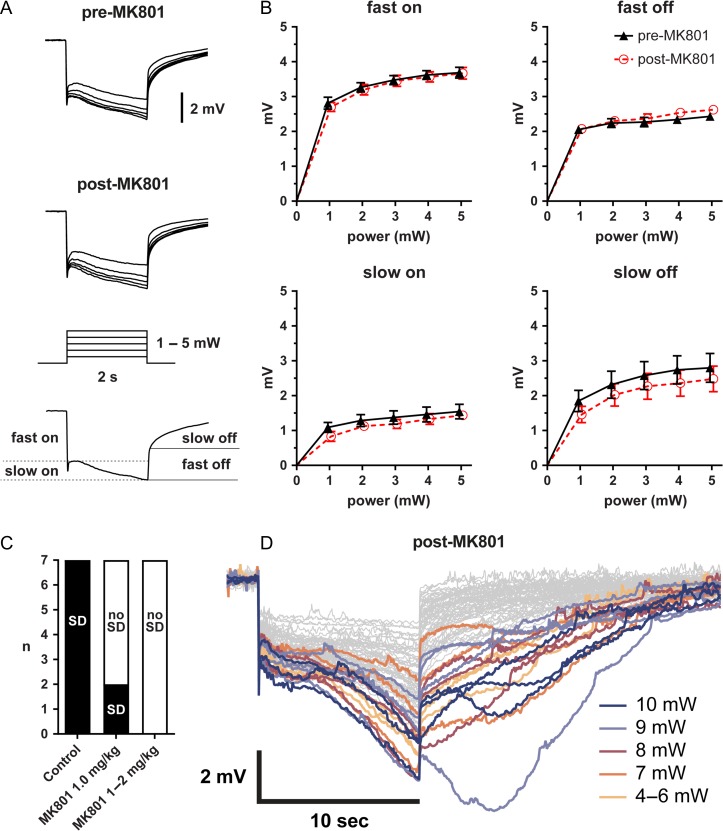
Cortical spreading depolarization (SD) is the electrophysiological event underlying migraine aura, and a critical contributor to secondary damage after brain injury. Experimental models of SD have been used for decades in migraine and brain injury research; however, they are highly invasive and often cause primary tissue injury, diminishing their translational value. Here we present a non-invasive method to trigger SDs using light-induced depolarization in transgenic mice expressing channelrhodopsin-2 in neurons (Thy1-ChR2-YFP). Focal illumination (470 nm, 1-10 mW) through intact skull using an optical fiber evokes power-dependent steady extracellular potential shifts and local elevations of extracellular [K+] that culminate in an SD when power exceeds a threshold. Using the model, we show that homozygous mice are significantly more susceptible to SD (i.e., lower light thresholds) than heterozygous ChR2 mice. Moreover, we show SD susceptibility differs significantly among cortical divisions (motor, whisker barrel, sensory, visual, in decreasing order of susceptibility), which correlates with relative channelrhodopsin-2 expression. Furthermore, the NMDA receptor antagonist MK-801 blocks the transition to SD without diminishing extracellular potential shifts. Altogether, our data show that the optogenetic SD model is highly suitable for examining physiological or pharmacological modulation of SD in acute and longitudinal studies.


Figures

Figure 1.
Figure 1.
Representative optogenetic SDs through the intact skull. (A,B) The optical fiber, out of focus in this image, is outlined, as is the glass micropipette inserted through a <100-μm burr hole next to the optical fiber to record the extracellular slow potential shifts (Ve) in the right whisker barrel cortex. (C,D) A laser Doppler probe (LDF) away from the optical fiber non-invasively detects the propagating blood flow changes associated with an SD that was optogenetically induced in left visual cortex. SD induction and subsequent propagating blood flow changes are also shown in the Supplemental Video at 20x speed. Horizontal bars on the tracings show illumination period. *, bregma.
Figure 2.
Figure 2.
Optogenetic SD thresholds. The threshold light intensities that triggered an SD are shown for ChR2+/− (upper) and ChR2+/+ (lower) mice using 10- (right) or 20-s (left) stimulation paradigms. Each SD threshold determination involved stepwise escalation of light intensity as shown on top. Inset shows stimulation regions. Sample sizes indicate the number of mice. Each animal had multiple SD threshold trials. Each data point represents the threshold in 1 trial. Failure of SD induction despite maximum stimulus is also indicated (No SD). Filled symbols indicate the results of the first SD threshold trial in a hemisphere, whereas open symbols indicate subsequent trials. Median and interquartile ranges are also shown. Young mice were 12–18 weeks and aged mice were ~1 year old.
Figure 3.
Figure 3.
Thresholds for electrical and KCl stimulation-induced SDs in motor and visual cortices. Cartoon shows the electrical stimulation and KCl application sites for threshold determination. Whisker-box plots show the interquartile and full ranges for electrical (log) and KCl concentration thresholds for SD induction (horizontal line, median; +, mean), analyzed using paired t-test (2 tailed; n = 6 mice). Individual data points are also shown.
Figure 4.
Figure 4.
Channelrhodopsin-2 expression as a critical determinant of optogenetic SD threshold. (A) A representative sagittal section from a ChR2+/− mouse 2 mm lateral to midline showing ChR2 and NeuN double immunostaining. Motor, sensory, and visual cortex (from left to right) are denoted by white rectangles and cortical depth is indicated at this section level. Scale bar = 1000 μm. ChR2 fluorescence (arbitrary units, AU) in motor, whisker barrel, sensory, and visual cortices are shown at the indicated depths (n = 7 mice). (B) Optogenetic SD thresholds (mW) are inversely correlated (Pearson’s r) with ChR2 expression (normalized to global average in AU) in the superficial but not deep layers. (C) Ex vivo view of the right-sided skull, sectioned so that the medial (M) and lateral (L) edges of a skull fragment overlying motor, sensory, whisker barrel, and visual cortex can be measured. Scale bar is 1 mm. (D) Skull thickness over motor, visual, sensory and whisker barrel cortices (*P < 0.05; 1-way repeated measures ANOVA correcting for multiple comparisons; n = 12 mice). (E) Schematic for light transmittance experiments. (F) Light transmittance did not significantly differ among different regions. Two-way ANOVA for repeated measures and correcting for multiple comparisons (n = 13 mice).
Figure 5.
Figure 5.
Extracellular potential and [K+]e shifts during optogenetic stimulation. (A) Averaged extracellular potential shifts during light stimulation in whisker barrel and visual cortex at stepwise increasing light intensities (1–5 mW; n = 9 and 10 ChR2+/−, respectively). The electrode tip was located directly under the light stimulation at the center of the light cone. Measurements of fast/slow on and fast/slow off potentials are indicated on a representative trace. (B) Representative extracellular potential recordings during light stimulation in whisker barrel cortex from a ChR2−/− (wild-type) mouse in response to 10-s stepwise increasing light intensities from 1–10 mW. (C) Extracellular potential shift power-response relationship (n = 9 whisker barrel cortex and 10 visual cortex in ChR2+/−). Whisker barrel cortex consistently has significantly greater potential shifts than visual cortex except for the fast off component (***P < 0.0001; **P < 0.01; NS = not significant; 2-way ANOVA). Bars indicate ± standard error of the mean (SEM). (D,E) Slopes of the linear prediction equation represent the ratio of averaged whisker barrel vs. visual cortex fast on (D) and slow on (E) potential shifts at 1.0, 2.0, 3.0, 4.0, and 5.0 mW. Pearson’s r also shown. Bars indicate ± SEM. (F) Optogenetic stimulation enables extracellular potassium measurements at the site of origin of SD. Averaged records showing changes in extracellular potassium-selective electrode (ΔK+) potential shifts and direct current (DC) potential shifts from a 5-s light stimulation (horizontal bar) over whisker barrel cortex (n = 6 ChR2+/− mice). (G) Normalized peak extracellular potassium concentration vs. light stimulation intensity. Bars indicate ± standard deviation. (H) Individual extracellular potassium and concomitant DC potential tracings in response to a 10-s light stimulation (horizontal bar) that precipitates an SD. Colors correspond to specific trials (n = 6 ChR2+/− mice).
Figure 6.
Figure 6.
SD occurs with a substantial latency after light stimulation. (A) DC-potential records of individual SDs from ChR2+/+ mice in response to either a 5- (black traces) or a 10-s (gray traces) light stimulus. Box indicates zoomed-in area. SD occurs at latencies up to 20 s after the end of light stimulation. (B) SD latencies vs. light intensity (mW) in ChR2+/− and ChR2+/+ mice. Shaded areas indicate the time frame the light stimulus was applied, in order to provide a perspective on how late SDs appeared (symbols) after the end of stimulation in each strain and stimulus duration. Horizontal lines indicate mean time to an SD in ChR2+/− and ChR2+/+ mice for each light intensity. Black and gray symbols represent SDs triggered by a 5- or 10-s stimulus, respectively. Sample sizes show number of mice.
Figure 7.
Figure 7.
NMDA receptor antagonist MK-801 prevents optogenetic SD. (A) Averaged local field potential shifts during light stimulation in whisker barrel cortex before and after MK-801. The electrode tip was located directly under the light stimulation at the center of the light cone. (B) Fast and slow on and off potential shifts induced by a 2-s light stimulus pre- and post-MK-801 are not significantly different (n = 9 each; 2-way ANOVA). (C) Number of SDs induced in whisker barrel cortex using the 10-s protocol outlined in Figure 2 before and after MK-801 administration (n = 9 ChR2+/+ mice pre-MK-801 and n = 7 post-MK-801). (D) Individual records in response to a 10-s light stimulus post-MK-801. Shown are 70 overlaid records from ChR2+/+ mice. Records with a delayed afterpotential are highlighted in color.
Figure 8.
Figure 8.
Chronic dosing of light-induced SD through an imaging window. (A) Mouse after implantation of an imaging window over intact skull. (B) View of the imaging window in an anesthetized mouse. An optical fiber is briefly positioned over the right frontal bone (motor cortex) for light stimulation. (CF) Optical intrinsic signal difference images based on the view in B using a microscope objective camera showing an optogenetic SD. * = bregma.

References

    1. Anikeeva P, Andalman AS, Witten I, Warden M, Goshen I, Grosenick L, Gunaydin LA, Frank LM, Deisseroth K. 2011. Optetrode: a multichannel readout for optogenetic control in freely moving mice. Nat Neurosci. 15:163–170. - PMC - PubMed
    1. Ayata C. 2009. Spreading depression: from serendipity to targeted therapy in migraine prophylaxis. Cephalalgia. 29:1095–1114. - PubMed
    1. Ayata C. 2010. Cortical spreading depression triggers migraine attack: pro. Headache. 50:725–730. - PubMed
    1. Ayata C. 2013. Pearls and pitfalls in experimental models of spreading depression. Cephalalgia. 33:604–613. - PubMed
    1. Ayata C, Jin H, Kudo C, Dalkara T, Moskowitz MA. 2006. Suppression of cortical spreading depression in migraine prophylaxis. Ann Neurol. 59:652–661. - PubMed

Publication types