. 2018 Mar 22;86(4):e00934-17.
doi: 10.1128/IAI.00934-17. Print 2018 Apr.

Dysbiosis of Inferior Turbinate Microbiota Is Associated with High Total IgE Levels in Patients with Allergic Rhinitis

Affiliations

Dysbiosis of Inferior Turbinate Microbiota Is Associated with High Total IgE Levels in Patients with Allergic Rhinitis

Dong-Wook Hyun et al. Infect Immun. .

Abstract

Abnormalities in the human microbiota are associated with the etiology of allergic diseases. Although disease site-specific microbiota may be associated with disease pathophysiology, the role of the nasal microbiota is unclear. We sought to characterize the microbiota of the site of allergic rhinitis, the inferior turbinate, in subjects with allergic rhinitis (n = 20) and healthy controls (n = 12) and to examine the relationship of mucosal microbiota with disease occurrence, sensitized allergen number, and allergen-specific and total IgE levels. Microbial dysbiosis correlated significantly with total IgE levels representing combined allergic responses but not with disease occurrence, the number of sensitized allergens, or house dust mite allergen-specific IgE levels. Compared to the populations in individuals with low total IgE levels (group IgElow), low microbial biodiversity with a high relative abundance of Firmicutes phylum (Staphylococcus aureus) and a low relative abundance of Actinobacteria phylum (Propionibacterium acnes) was observed in individuals with high total serum IgE levels (group IgEhigh). Phylogeny-based microbial functional potential predicted by the 16S rRNA gene indicated an increase in signal transduction-related genes and a decrease in energy metabolism-related genes in group IgEhigh as shown in the microbial features with atopic and/or inflammatory diseases. Thus, dysbiosis of the inferior turbinate mucosa microbiota, particularly an increase in S. aureus and a decrease in P. acnes, is linked to high total IgE levels in allergic rhinitis, suggesting that inferior turbinate microbiota may be affected by accumulated allergic responses against sensitized allergens and that site-specific microbial alterations play a potential role in disease pathophysiology.

Keywords: Propionibacterium acnes; Staphylococcus aureus; allergic rhinitis; commensal microbiota; immunoglobulin E; inferior turbinate; multiple-allergen simultaneous test; nasal mucosa; skin prick test.


Figures

FIG 1
FIG 1
Effect of immunoglobulin E (IgE) levels on the inferior turbinate mucosa microbiota and microbial diversity and community composition. (A) Schematic drawing showing harvesting of nasal mucosa from the inferior nasal turbinate. (B) Principal-coordinate analysis of weighted UniFrac distances of the inferior turbinate mucosa microbiota. Each point represents an individual microbiota. (C) Average weighted UniFrac distances representing intragroup and intergroup variability within the microbiota. (D) Comparison of alpha-diversity indices between IgE levels. Bars and dots represent the average diversity index score and diversity index score, respectively, for each sample. (E) Mean relative abundances of bacterial phyla (inner circles) and genera (outer circles) in groups IgElow and IgEhigh. Only taxonomic groups at >0.5% of the total microbiota are shown. For panels C and D, P values were calculated by two-tailed Mann-Whitney U test. *, P < 0.05; **, P < 0.01; ***, P < 0.001.
FIG 2
FIG 2
OTUs that discriminate between two IgE levels, and the predominant OTUs, in the inferior turbinate mucosa microbiota. (A) Each dot represents mean relative abundance of OTUs in group IgElow (x axis) and group IgEhigh (y axis). OTUs significantly enriched in group IgElow are shown in blue, while those significantly enriched in group IgEhigh are shown in red. Nondiscriminant OTUs are shown in black. P values of <0.05 indicated significantly discriminant OTUs in both of the two-tailed Mann-Whitney U test and the best-fitted statistical test (either the negative binomial model, Poisson model, or zero-inflated negative binomial model). Only OTUs at >0.5% of the total abundance are shown. (B) Comparisons of abundances of S. aureus. Two graphs show the mean relative abundance (left) and mean absolute abundance (right) of S. aureus, respectively. (C and D) Comparison of prevalences (C) and the mean relative abundances (D) of major bacterial OTUs between groups IgElow and IgEhigh. For panels B and D, P values were determined using the two-tailed Mann-Whitney U test. *, P < 0.05; ***, P < 0.001.
FIG 3
FIG 3
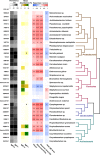
Correlation between the relative abundance of major OTUs and total IgE levels and microbial diversity indices (Spearman's correlation analysis). The heat maps shown in yellow to green and white to black depict the mean relative abundances and prevalences, respectively, of the major OTUs. In the heat map showing relative abundance, the OTUs that discriminate between the two IgE groups are marked by a pound sign. The heat map in blue to red shows the correlation scores (rho) between the relative abundances of major OTUs and total IgE levels and between the relative abundance of major OTUs and microbial diversity. In the heat map showing the correlation scores, significant P values are indicated by asterisks. A phylogenetic tree based on 16S rRNA gene sequences for each OTU shows the taxonomic position of the major OTUs. #, P < 0.05; *, P < 0.05; **, P < 0.01; ***, P < 0.001.
FIG 4
FIG 4
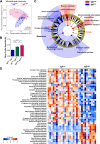
Effect of IgE levels on the gene community of the inferior turbinate mucosa microbiota and the microbial gene characteristics that discriminate between IgEhigh and IgElow groups. (A) Principal-coordinate analysis of Bray-Curtis dissimilarities in the inferior turbinate microbial gene community. Each point represents an individual predicted microbial functional gene community. (B) Average Bray-Curtis dissimilarities representing intragroup and intergroup variability within the microbial gene community structure. (C) Cladograms generated by LEfSe analysis. Shaded areas represent gene families that are significantly enriched in group IgElow or group IgEhigh at the first and second levels of KO hierarchy. (D) Heat map depicting normalized abundance of microbial gene families that discriminate between subjects with different IgE levels. For panels B and D, P values were determined by the two-tailed Mann-Whitney U test. *, P < 0.05; ***, P < 0.001. Panel C was generated from the LEfSe analysis.

References

    1. Galli SJ, Tsai M, Piliponsky AM. 2008. The development of allergic inflammation. Nature 454:445–454. doi: 10.1038/nature07204. - DOI - PMC - PubMed
    1. Sin B, Togias A. 2011. Pathophysiology of allergic and nonallergic rhinitis. Proc Am Thorac Soc 8:106–114. doi: 10.1513/pats.201008-057RN. - DOI - PubMed
    1. Cruz AA, Bousquet J, Khaltaev N. 2007. Global surveillance, prevention and control of chronic respiratory diseases: a comprehensive approach. World Health Organization, Geneva, Switzerland.
    1. Strachan DP. 1989. Hay fever, hygiene, and household size. BMJ 299:1259–1260. doi: 10.1136/bmj.299.6710.1259. - DOI - PMC - PubMed
    1. Wills-Karp M, Santeliz J, Karp CL. 2001. The germless theory of allergic disease: revisiting the hygiene hypothesis. Nat Rev Immunol 1:69–75. doi: 10.1038/35095579. - DOI - PubMed

Publication types

LinkOut - more resources