. 2018 Feb 9;9(1):614.
doi: 10.1038/s41467-018-03021-5.

Combinatorial hydrogels with biochemical gradients for screening 3D cellular microenvironments

Affiliations

Combinatorial hydrogels with biochemical gradients for screening 3D cellular microenvironments

Sebastián L Vega et al. Nat Commun. .

Abstract

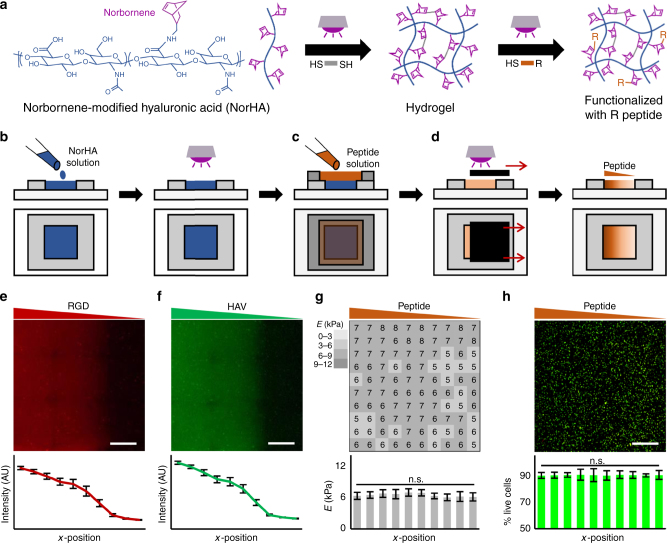
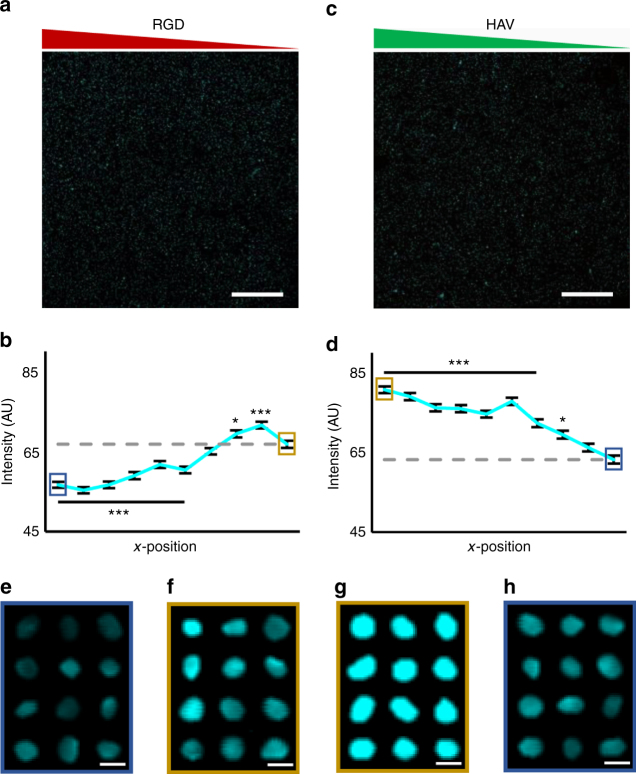
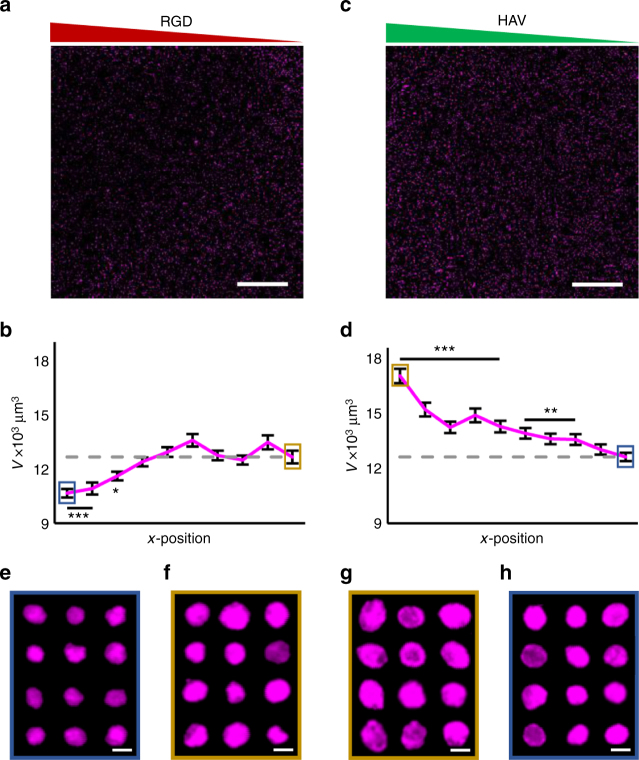
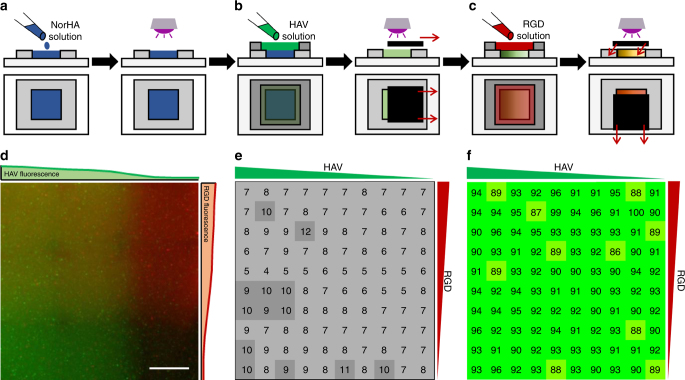
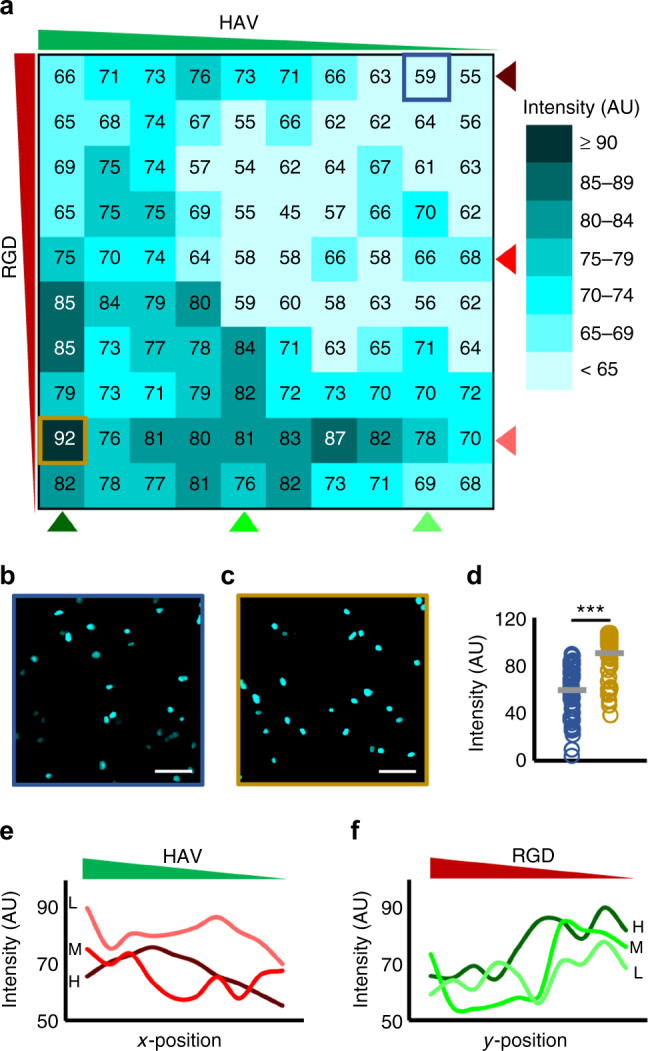
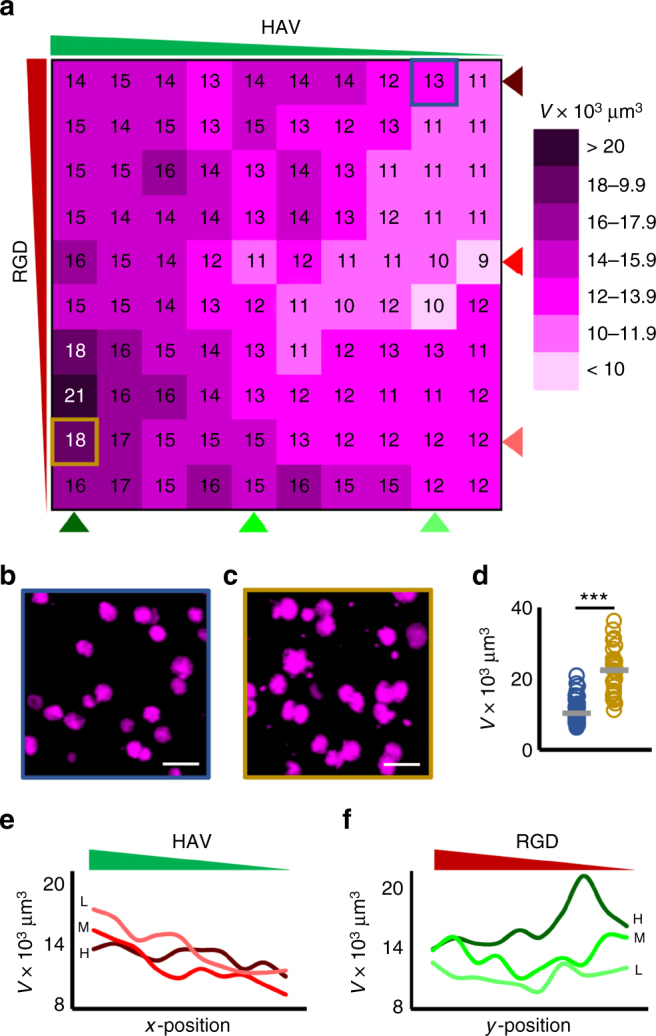
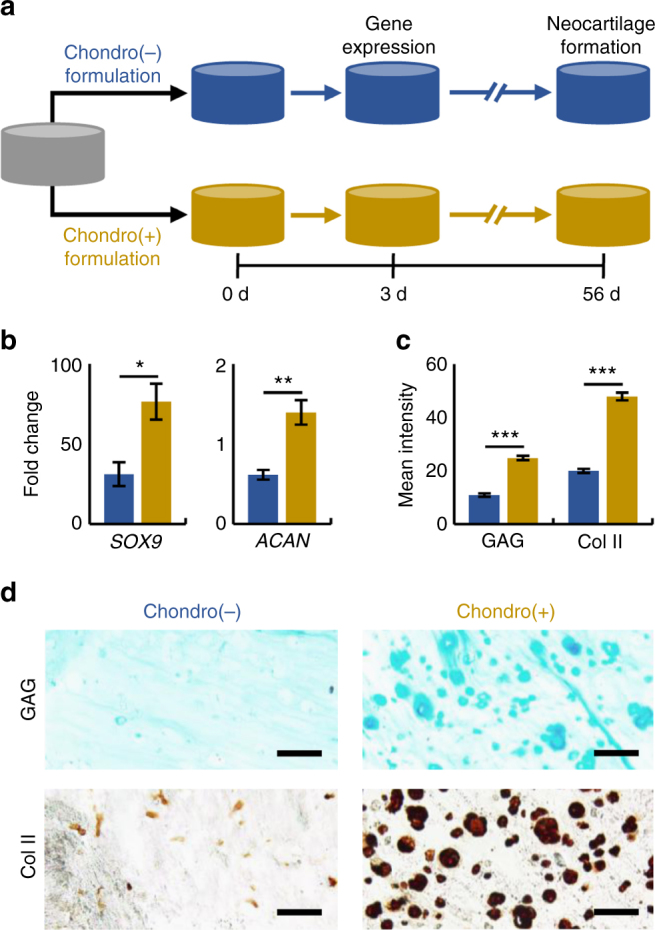
3D microenvironmental parameters control cell behavior, but can be challenging to investigate over a wide range of conditions. Here, a combinatorial hydrogel platform is developed that uses light-mediated thiol-norbornene chemistry to encapsulate cells within hydrogels with biochemical gradients made by spatially varied light exposure. Specifically, mesenchymal stem cells are photoencapsulated in norbornene-modified hyaluronic acid hydrogels functionalized with gradients (0-5 mM) of peptides that mimic cell-cell or cell-matrix interactions, either as single or orthogonal gradients. Chondrogenesis varied spatially in these hydrogels based on the local biochemical formulation, as indicated by Sox9 and aggrecan expression levels. From 100 combinations investigated, discrete hydrogels are formulated and early gene expression and long-term cartilage-specific matrix production are assayed and found to be consistent with screening predictions. This platform is a scalable, high-throughput technique that enables the screening of the effects of multiple biochemical signals on 3D cell behavior.


Conflict of interest statement

The authors declare no competing financial interests.

Figures

Fig. 1
Fig. 1
Scheme for fabricating NorHA hydrogels with single peptide gradients and characterization. a Multi-step thiol-norbornene UV light-mediated reaction between norbornene-modified hyaluronic acid (NorHA) and di-thiols (DTT) to form a hydrogel and then to subsequently modify with mono-thiolated peptides. Schematic of fabrication process where, b NorHA hydrogels were first formed on 5 × 5 × 0.5 mm3 molds with UV light exposure, c incubated with 5 mM mono-thiolated peptide solution, and d peptide gradients introduced with an opaque sliding mask to control the extent of light-mediated reaction between peptides and norbornenes in the hydrogel. Images and quantification of signal intensity of e rhodamine-labeled RGD (GCGYGRGDSPG) or f fluorescein-labeled HAV (HAVDIGGGC) peptide gradients. g Atomic force microscopy (AFM) of the peptide-modified hydrogel presented as a heat map and quantification across the x-position (n = 10 measurements per zone). h Images and quantification of mesenchymal stem cell (MSC) viability within NorHA hydrogels with peptide gradient (RGD shown) (n > 1000 cells per zone). Error bars represent standard error around the mean (s.e.m.); scale bars: 1 mm; n.s., no significance between groups
Fig. 2
Fig. 2
Effects of HAV and RGD gradients on transcription factor Sox9 expression. Maximum projection images and quantification across 10 regions of nuclear Sox9 fluorescence (aqua) for gradients of a, b RGD and c, d HAV peptides after 1 day. Representative maximum projection images of nuclei stained for Sox9 in e high or f low RGD regions and g high or h low HAV regions. Generally, higher nuclear Sox9 was observed with decreasing RGD and for increasing HAV. Error bars represent standard error around the mean (s.e.m.); n > 300 cells per zone, ***p < 0.001, *p < 0.05 compared to lowest peptide region (gray dashed line). Scale bars: a, c 1 mm, eh 10 µm
Fig. 3
Fig. 3
Effects of HAV and RGD gradients on aggrecan synthesis. Maximum projection images and quantification across 10 regions of aggrecan fluorescence (magenta) for gradients of a, b RGD and c, d HAV peptides after 7 days. Representative maximum projection images of aggrecan in e high or f low RGD regions and g high or h low HAV regions. Generally, larger aggrecan volumes were observed with decreasing RGD and for increasing HAV peptide levels. Error bars represent standard error around the mean (s.e.m.); n > 300 cells per zone, ***p < 0.001, **p < 0.01, *p < 0.05 compared to lowest peptide region (gray dashed line). Scale bars: a, c 1 mm, eh 25 µm
Fig. 4
Fig. 4
Scheme for fabricating orthogonal biochemical gradients and characterization. a Norbornene-modified hyaluronic acid (NorHA) hydrogels were prepared on 5 × 5 × 0.5 mm3 molds via a thiol-norbornene UV light-mediated reaction between NorHA and di-thiol (DTT) crosslinker. b Hydrogels were then incubated in 5 mM mono-thiolated HAV peptide solution for 30 min and a gradient was generated with an opaque horizontal sliding mask to control the extent of light-mediated reaction between HAV peptides and norbornenes in the hydrogel. After washing, the hydrogel was then (c) incubated in 5 mM mono-thiolated RGD peptide solution for 30 min and an opaque sliding mask in the vertical direction was used to introduce a secondary orthogonal gradient. d Images of rhodamine-labeled RGD and fluorescein-labeled HAV orthogonal gradients, including quantified intensity profiles on each side. e Atomic force microscopy (AFM) indention moduli and f encapsulated mesenchymal stem cell (MSC) viability (after 7 days of culture) heat maps of hydrogels with orthogonal peptide gradients. Scale bar: 1 mm
Fig. 5
Fig. 5
Effects of orthogonal HAV and RGD gradients on transcription factor Sox9 expression. a Heat map of average intensities of Sox9 fluorescence across 100 bins (10 by 10 array) for cultures of mesenchymal stem cells (MSCs) after 1 day. b Representative maximum projection images of bins corresponding to (b) high RGD, low HAV (outlined blue) and (c) low RGD, high HAV (outlined gold) qualitatively show low and high nuclear Sox 9, respectively. d Single-cell analysis of nuclear Sox9 fluorescence for these same groups from b and c. e RGD curves at a fixed concentration (light, medium, and dark red correspond to low “L”, medium “M”, and high “H” RGD concentrations, respectively) show a decreasing trend along HAV concentration gradient. In contrast, (f) HAV curves at a fixed concentration (light, medium, and dark green correspond to low “L”, medium, “M”, and high “H” HAV concentrations, respectively) show an increasing trend along RGD concentration gradient, with highest values occurring along high HAV concentration curve at a low RGD concentration. n > 50 cells in samples shown in b and c, ***p < 0.001. Scale bars: 50 µm
Fig. 6
Fig. 6
Effects of orthogonal HAV and RGD gradients on aggrecan synthesis. a Heat map of synthesized aggrecan volumes across 100 bins (10 by 10 array) for analysis for cultures of mesenchymal stem cells (MSCs) after 7 days. Representative maximum projection images of bins corresponding to b high RGD, low HAV (outlined blue) and c low RGD, high HAV (outlined gold) qualitatively show lower and higher aggrecan volume, respectively. d Single-cell analysis of aggrecan volume for these same groups from b and c. e RGD curves at a constant concentration (light, medium, and dark red correspond to low “L”, medium “M”, and high “H” RGD concentrations, respectively) show a decreasing trend along HAV concentration gradient. In contrast, (f) HAV at a constant concentration (light, medium, and dark green correspond to low “L”, medium, “M”, and high “H” HAV concentrations, respectively) show an increasing trend along RGD concentration gradient, with highest aggrecan volume occurring along high HAV concentration curve at a low RGD concentration. n > 50 cells in samples shown in b and c, ***p < 0.001. Scale bars: 50 µm
Fig. 7
Fig. 7
Discrete hydrogels with high HAV and low RGD enhance neocartilage formation by MSCs in vitro. a Overview of discrete hydrogel study where mesenchymal stem cells (MSCs) were photoencapsulated in norbornene-modified hyaluronic acid (NorHA) hydrogels and then biofunctionalized with a 5 mM peptide solution consisting of either “Chondro(+)” (4.5 mM HAV and 0.5 mM RGD) or “Chondro(−)” (4.5 mM RGD and 0.5 mM HAV) peptide formulations, and assayed for early (3-day) and long-term (56-day) gene expression and neocartilage formation, respectively. b Gene expression of SOX9 and ACAN (aggrecan) after 3 days for MSCs in Chondro(+) and Chondro(−) hydrogels (n = 4 hydrogels per group). c Quantification and d images of histology and immunohistochemistry for glycosaminoglycan (GAG) and type II collagen (Col II) after 56 days (n > 50 sections per group). Error bars represent standard error around the mean (s.e.m.); ***p < 0.001, **p < 0.01, *p < 0.05 compared to the Chondro(−) condition. Scale bars: 100 µm

References

    1. Scadden DT. The stem-cell niche as an entity of action. Nature. 2006;441:1075–1079. doi: 10.1038/nature04957. - DOI - PubMed
    1. Caron MMJ, et al. Redifferentiation of dedifferentiated human articular chondrocytes: comparison of 2D and 3D cultures. Osteoarthr. Cartil. 2012;20:1170–1178. doi: 10.1016/j.joca.2012.06.016. - DOI - PubMed
    1. Tian XF, et al. Comparison of osteogenesis of human embryonic stem cells within 2D and 3D culture systems. Scand. J. Clin. Lab. Invest. 2008;68:58–67. doi: 10.1080/00365510701466416. - DOI - PubMed
    1. Baharvand H, Hashemi SM, Kazemi Ashtiani S, Farrokhi A. Differentiation of human embryonic stem cells into hepatocytes in 2D and 3D culture systems in vitro. Int. J. Dev. Biol. 2006;50:645–652. doi: 10.1387/ijdb.052072hb. - DOI - PubMed
    1. Chatterjee K, Young F, Simon MGC. Fabricating gradient hydrogel scaffolds for 3D cellculture. Comb. Chem. High. Throughput Screen. 2011;14:227–236. doi: 10.2174/138620711795222455. - DOI - PMC - PubMed

Publication types

MeSH terms