. 2018 Feb 9;8(1):2771.
doi: 10.1038/s41598-018-20995-w.

Next generation high throughput DNA damage detection platform for genotoxic compound screening

Affiliations

Next generation high throughput DNA damage detection platform for genotoxic compound screening

Peter Sykora et al. Sci Rep. .

Abstract

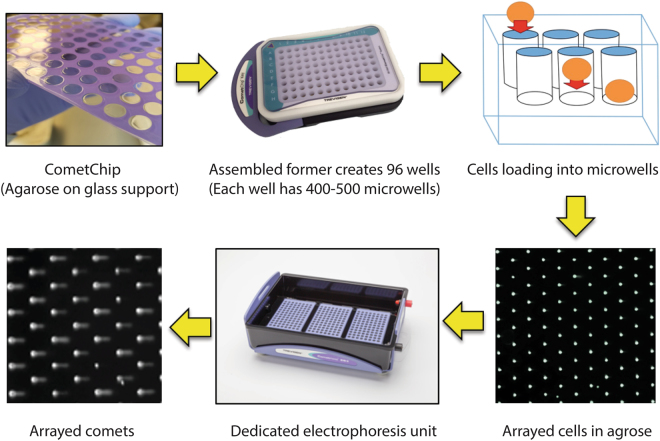
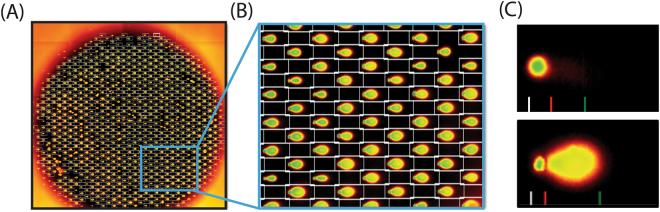
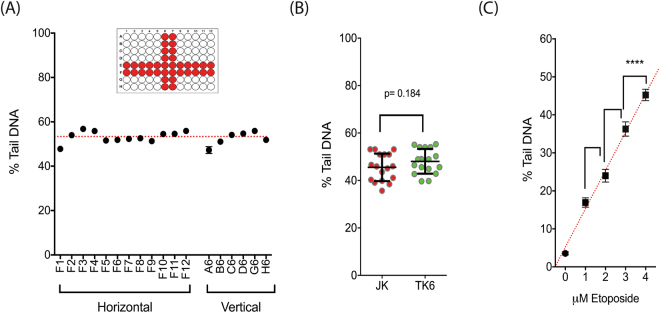
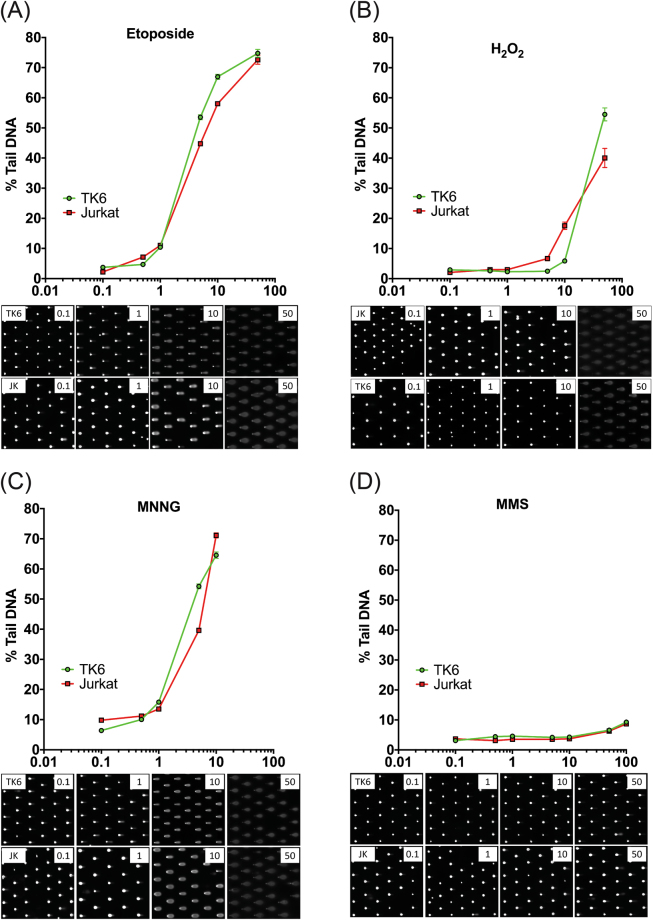
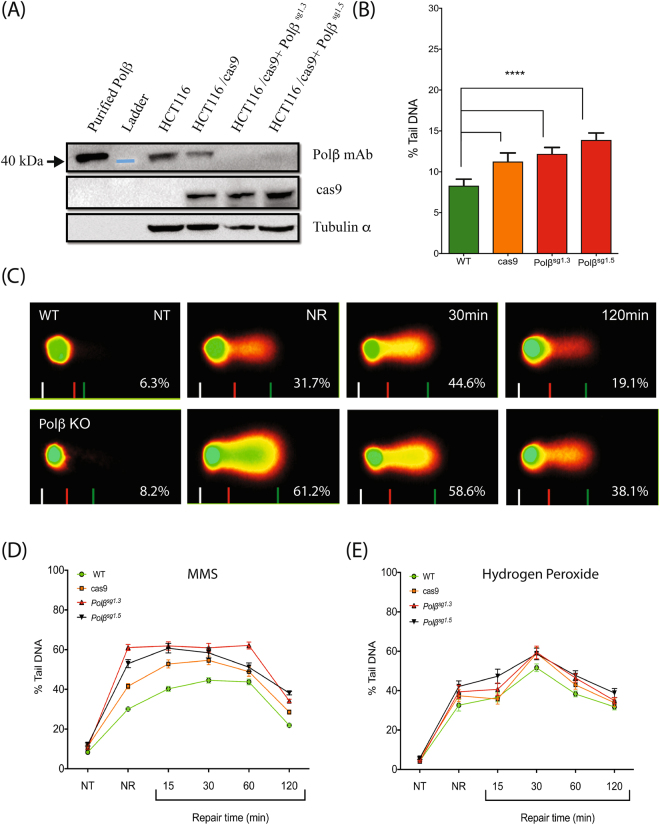
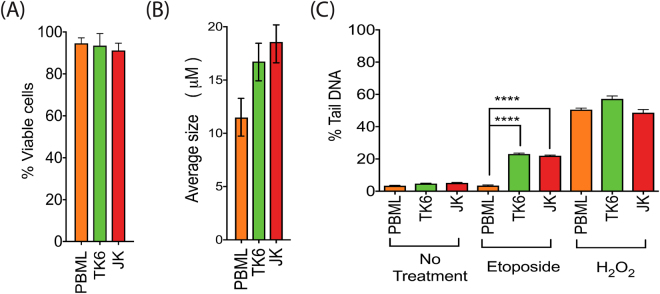
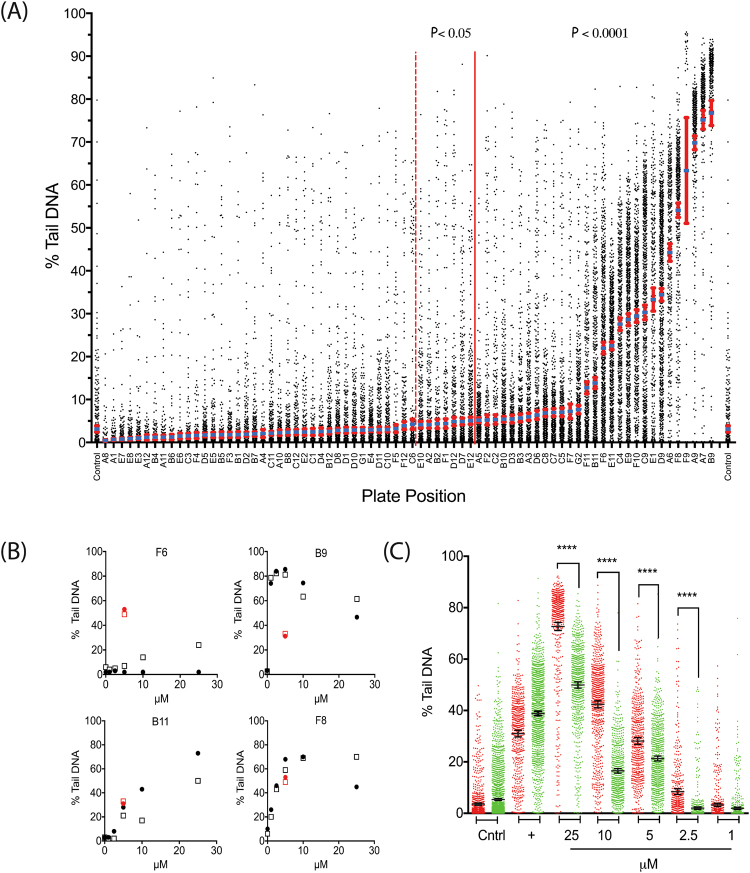
Methods for quantifying DNA damage, as well as repair of that damage, in a high-throughput format are lacking. Single cell gel electrophoresis (SCGE; comet assay) is a widely-used method due to its technical simplicity and sensitivity, but the standard comet assay has limitations in reproducibility and throughput. We have advanced the SCGE assay by creating a 96-well hardware platform coupled with dedicated data processing software (CometChip Platform). Based on the original cometchip approach, the CometChip Platform increases capacity ~200 times over the traditional slide-based SCGE protocol, with excellent reproducibility. We tested this platform in several applications, demonstrating a broad range of potential uses including the routine identification of DNA damaging agents, using a 74-compound library provided by the National Toxicology Program. Additionally, we demonstrated how this tool can be used to evaluate human populations by analysis of peripheral blood mononuclear cells to characterize susceptibility to genotoxic exposures, with implications for epidemiological studies. In summary, we demonstrated a high level of reproducibility and quantitative capacity for the CometChip Platform, making it suitable for high-throughput screening to identify and characterize genotoxic agents in large compound libraries, as well as for human epidemiological studies of genetic diversity relating to DNA damage and repair.


Conflict of interest statement

The authors declare no competing interests.

Figures

Figure 1
Figure 1
Design of Next-Generation CometChip hardware and work-flow. Close up of the CometChip showing the agarose surface chemically bound on a glass support. The CometChip is inserted into a Former base. When assembled, the Former allows each of the 96 wells in the CometChip to be treated individually. Each well has, in turn, more than 500 microwells that enable cells to be gravity loaded into the CometChip, the result is that all cells are on a single focal plane. The dedicated electrophoresis system limits the field variability by reducing the distance between the two electrodes. After electrophoresis, the CometChip is stained and images are acquired using an automated image cytometer (Celigo). These images are subsequently analyzed using dedicated CAS optimized for the CometChip high throughput methodology.
Figure 2
Figure 2
Acquisition and analysis of image data. (A) Image acquisition and comet analysis using dedicated CAS. Representative image of a single CometChip well after DNA damage treatment. Image is comprised of 16 individual post-acquisition stitched images. The insert shows the region expanded in (B). (B) Higher magnification of the insert from (A), shows individual wells. The CAS automated analysis software detects and boxes each comet and colors the comet based on the intensity of the signal. (C) Two examples of comets post-CAS analysis – (upper) negative control comet with endogenous level of DNA damage. The DNA does not migrate significantly due to supercoiling. (lower) Example of a comet from a highly-damaged cell that has been exposed to etoposide. In each example, the white line at the bottom of the image marks the beginning of the comet head, the red line marks the outermost edge of the comet head and the green line marks the end of the comet tail.
Figure 3
Figure 3
CometChip validation. (A) Intra-assay variability. The wells on the outer edge of the plate had the most variability compared to controls. Overall, we observed average variability of less than 4.2% of mean difference and maximum variability less than 10% of mean difference. The average group value is depicted as a red dotted line. Error bars = mean with 95% CI (n = 644–749). (B) Inter-assay variability. Cells were treated with etoposide (5 μM) and DNA damage was measured after 1 h. Each point represents a separate experiment (n = 17 per cell line). CV was measured at 13% for the JK cells and 11% for the TK6 cells (n = 420–580 per point). Error bars = mean ± SD. Statistical analysis was conducted via a two-sided Student’s t-test. (C) Linear DNA damage response to the DSB causing agent, etoposide. Assay was able to resolve differences in DNA damage caused by 1 μM increments of the compound (****p < 0.0001, n = 1000–2000 comets; r = 0.98). Statistical analysis was conducted via a two-sided Student’s t-test.
Figure 4
Figure 4
Analysis of known DNA damaging agents. (A) Etoposide is shown to induce replication-dependent DSBs and cause significant DNA damage at concentrations greater than 1 μM (n = 1069–1374). Shown is the plot of % tail DNA for TK6 and Jurkat cells following exposure (60 min) to the agent at the doses indicated. (B) H2O2 did not cause DNA damage below 1 μM, with elevated levels of DNA damage observed at 50 μM (n = 450–1200). Shown is the plot of % tail DNA for TK6 and Jurkat cells following exposure (60 min) to the agent at the doses indicated. (C) MNNG, a potent SN1 DNA alkylating agent, was the most genotoxic of the compounds tested and caused the maximum amount of DNA damage that could be measured at 10 μM (n = 1075–1374). Shown is the plot of % tail DNA for TK6 and Jurkat cells following exposure (60 min) to the agent at the doses indicated. (D) MMS, an SN2 DNA alkylating agent, induced only modest DNA damage on the cells tested, with significant DNA damage observed only at concentrations above 50 μM (n = 812–1294). All assays were conducted in duplicate. Error bars represent mean ± 95% CI. Shown is the plot of % tail DNA for TK6 and Jurkat cells following exposure (60 min) to the agent at the doses indicated. For each panel, the images below the plot are representative CometChip images at the doses indicated.
Figure 5
Figure 5
Endogenous DNA damage measurements and repair of DNA damage. (A) Validation of CRISPR-mediated KO of Polβ (gRNA 1.3/1.5) in HCT116 cells by immunoblot. Whole cell extracts were probed for Polβ at D12 post transduction to confirm KO and also for the expression of Cas9. Tubulin-α was used as a loading control. Blue band represents the 40 kDa marker visible on the membrane and the position of the 40 kDa molecular weight marker is indicated on the left. (B) Comparison of endogenous DNA damage levels. Cas9 containing cells had significantly higher levels of damage compared to the parental (WT) line (****p < 0.0001). All assays were conducted at least in duplicate. Statistical analysis was conducted via one-way ANOVA. (C) Representative images of CAS output from WT and Polβ-KOg1.3 after treatment with the DNA alkylator MMS (1 mM, 60 min): NR = no repair, NT = no treatment, 30 min and 120 min are durations of repair. Percentages are % tail DNA. (D) Repair kinetics of Polβ deficient cells after treatment with MMS (1 mM) or (E) H2O2 (50 μM). Error bars are mean ± 95% CI. Experiments conducted in duplicate.
Figure 6
Figure 6
Endogenous and induced DNA damage measured in patient derived lymphocytes. (A) Average cell size. Patient derived cells (peripheral blood mononuclear lymphocytes, PBMLs) were smaller that the two cultured cell lines (TK6/JK). Data shows the mean of more than 100 cells. (B) Cell viability remained high after the lymphocytes were separated from the whole blood. Measured by trypan blue exclusion. (C) Levels of endogenous DNA damage was comparable between the three groups (n = 2400–2500). When exposed to etoposide (5 μM, 30 min exposure), only the replicating cells acquired DNA damage (n = 1900–2841). Conversely, all cell types acquired comparable amounts of DNA damage after exposure to H2O2 (50 μM, 30 min exposure). Statistical analysis was conducted via a two-sided Student’s t-test.
Figure 7
Figure 7
NTP compound plate screen. (A) Prescreen data from all compounds (A1–G2), showing all points and spread of data. Error bars represent mean +/− 95% CI. Also refer to Tables 1 and 2. Statistical analysis was conducted via a one-sided students t-test. (B) Representative graphs from four compounds. Compound B9 (Thiram) was one of the most genotoxic compounds tested. Cells exposed to compound F8 (another dithiocarbamate compound) also had high levels of DNA damage at low concentrations. Compounds F6 and B11 showed differential response based on p53 status of the cells. Symbols: squares = TK6 and circles = Jurkat (JK). Red symbols are etoposide internal controls for each of the cell lines. (C) Dose-response analysis of compound B11 shows that the JK cells (red) are slightly less sensitive to etoposide (+) control than the TK6 cells (green). Despite this, the JK cells show higher levels of DNA damage than the TK6 cells following treatment with compound B11 (****p < 0.0001). Statistical analysis was conducted via a two-sided Student’s t-test.

References

    1. Hoeijmakers JH. DNA damage, aging, and cancer. N Engl J Med. 2009;361:1475–1485. doi: 10.1056/NEJMra0804615. - DOI - PubMed
    1. Chow HM, Herrup K. Genomic integrity and the ageing brain. Nat Rev Neurosci. 2015;16:672–684. doi: 10.1038/nrn4020. - DOI - PubMed
    1. Baumstark-Khan C, Hentschel U, Nikandrova Y, Krug J, Horneck G. Fluorometric analysis of DNA unwinding (FADU) as a method for detecting repair-induced DNA strand breaks in UV-irradiated mammalian cells. Photochem Photobiol. 2000;72:477–484. doi: 10.1562/0031-8655(2000)072<0477:FAODUF>2.0.CO;2. - DOI - PubMed
    1. Quinet A, Carvajal-Maldonado D, Lemacon D, Vindigni A. DNA Fiber Analysis: Mind the Gap! Methods Enzymol. 2017;591:55–82. doi: 10.1016/bs.mie.2017.03.019. - DOI - PubMed
    1. Gassman NR, Wilson SH. Micro-irradiation tools to visualize base excision repair and single-strand break repair. DNA Repair (Amst) 2015;31:52–63. doi: 10.1016/j.dnarep.2015.05.001. - DOI - PMC - PubMed

Publication types