. 2018 Feb 9;8(1):2700.
doi: 10.1038/s41598-018-21008-6.

Caffeine Caused a Widespread Increase of Resting Brain Entropy

Affiliations

Caffeine Caused a Widespread Increase of Resting Brain Entropy

Da Chang et al. Sci Rep. .

Abstract

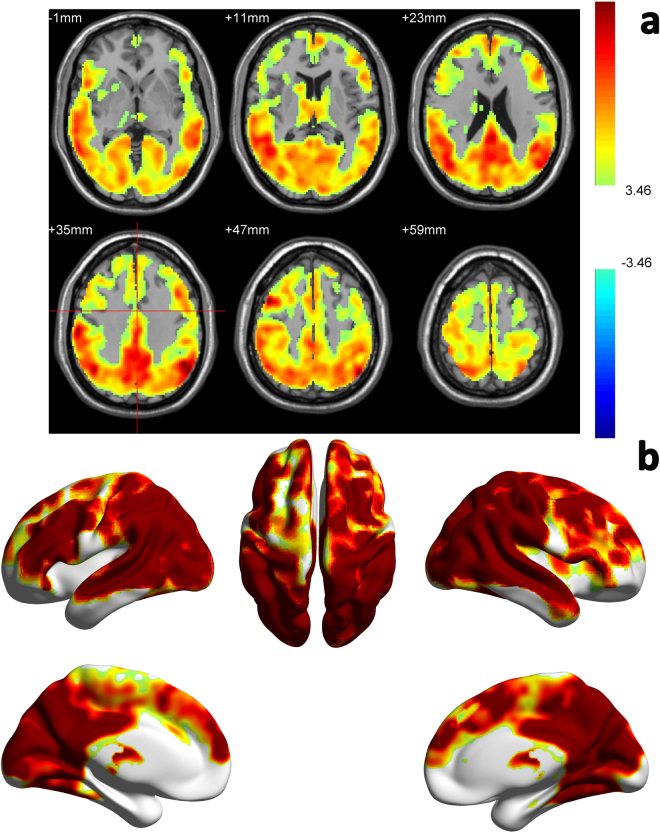
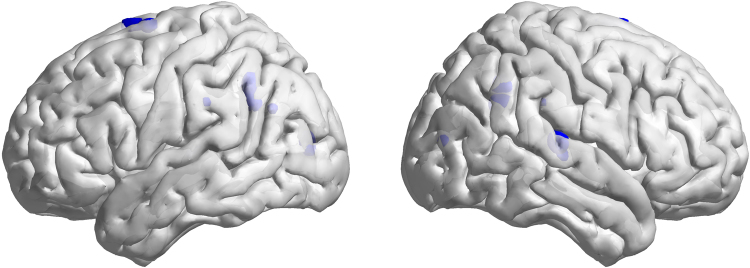
Entropy is an important trait of brain function and high entropy indicates high information processing capacity. We recently demonstrated that brain entropy (BEN) is stable across time and differs between controls and patients with various brain disorders. The purpose of this study was to examine whether BEN is sensitive to pharmaceutical modulations with caffeine. Both cerebral blood flow (CBF) and resting fMRI were collected from sixty caffeine-naïve healthy subjects before and after taking a 200 mg caffeine pill. Our data showed that caffeine reduced CBF in the whole brain but increased BEN across the cerebral cortex with the highest increase in lateral prefrontal cortex, the default mode network (DMN), visual cortex, and motor network, consistent with the beneficial effects of caffeine (such as vigilance and attention) on these areas. BEN increase was correlated to CBF reduction only in several regions (-0.5 < r < -0.4), indicating a neuronal nature for most of the observed BEN alterations. In summary, we showed the first evidence of BEN alterations due to caffeine ingestion, suggesting BEN as a biomarker sensitive to pharmaceutical brain function modulations.


Conflict of interest statement

The authors declare no competing interests.

Figures

Figure 1
Figure 1
Caffeine induced whole brain CBF decrease. Paired-t test showed that compared with control condition (no caffeine), caffeine induced whole brain CBF decrease. (a) is the thresholded t map presented in 2D, blue means lower after caffeine ingestion, p < 0.001. (b) is the same result presentation in 3D.
Figure 2
Figure 2
Caffeine induced BEN increase in a large portion of the cerebral cortex. Paired-t test showed that compared with control condition (no caffeine), Caffeine induced BEN increase in a large portion of the cerebral cortex with the highest increase in lateral prefrontal cortex, the DMN, visual cortex, and motor network. (a) is the thresholded t map presented in 2D, blue means lower after caffeine ingestion, red means higher after caffeine ingestion, p < 0.001, AlphaSim corrected (cluster size threshold is 270). (b) is the same result presentation in 3D.
Figure 3
Figure 3
The correlation of CBF difference maps (caffeine ingested condition minus control condition) and BEN difference maps. Only tiny clusters showed moderate negative correlation. These clusters (blue spots) distributed sporadically in right superior temporal cortex, precuneus, left calcarine sulcus and supplementary motor area (r < −0.4, p < 0.02).
Figure 4
Figure 4
Experiment design. Resting fMRI were collected from sixty caffeine-naïve healthy subjects (30/30 males and females). Each participants participated for two days with two imaging scan session apart exactly 24 hours. For control balance, subjects are randomly assigned to two groups (each group include 15 males and 15 females), group A take caffeine pill (200 mg) with water in the first day and only the same amount of water in the second, group B take only water in the first day in turn. Paired t-test of BEN and CBF were performed and correlation of BEN and CBF is also calculated.

Similar articles

Cited by

References

    1. Friston KJ, et al. Entropy and cortical activity: information theory and PET findings. Cerebral cortex. 1992;2:259–267. doi: 10.1093/cercor/2.3.259. - DOI - PubMed
    1. Friston KJ, Tononi G, Sporns O, Edelman GM. Characterising the complexity of neuronal interactions. Hum Brain Mapp. 1995;3:302–314. doi: 10.1002/hbm.460030405. - DOI
    1. Kiebel SJ, Daunizeau J, Friston KJ. A Hierarchy of Time-Scales and the Brain. Plos Comput Biol. 2008;4:e1000209. doi: 10.1371/journal.pcbi.1000209. - DOI - PMC - PubMed
    1. Tononi G, Sporns O, Edelman GM. A Measure for Brain Complexity - Relating Functional Segregation and Integration in the Nervous-System. P Natl Acad Sci USA. 1994;91:5033–5037. doi: 10.1073/pnas.91.11.5033. - DOI - PMC - PubMed
    1. Rubinov M, Sporns O, Thivierge JP, Breakspear M. Neurobiologically Realistic Determinants of Self-Organized Criticality in Networks of Spiking Neurons. Plos Comput Biol. 2011;7:e1002038. doi: 10.1371/journal.pcbi.1002038. - DOI - PMC - PubMed

Publication types

MeSH terms