. 2018 Feb 9;8(1):2717.
doi: 10.1038/s41598-018-21252-w.

Involvement of orexin neurons in fasting- and central adenosine-induced hypothermia

Affiliations

Involvement of orexin neurons in fasting- and central adenosine-induced hypothermia

Takahiro Futatsuki et al. Sci Rep. .

Abstract

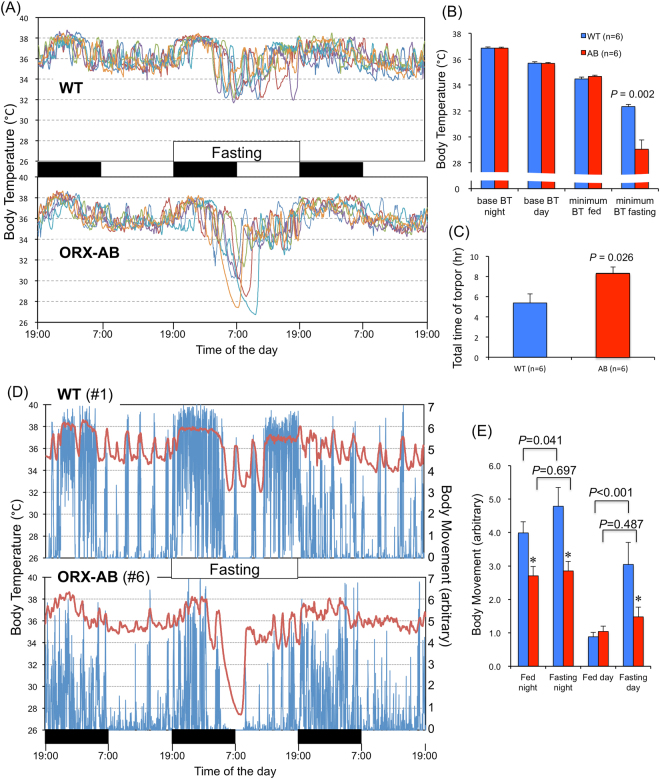
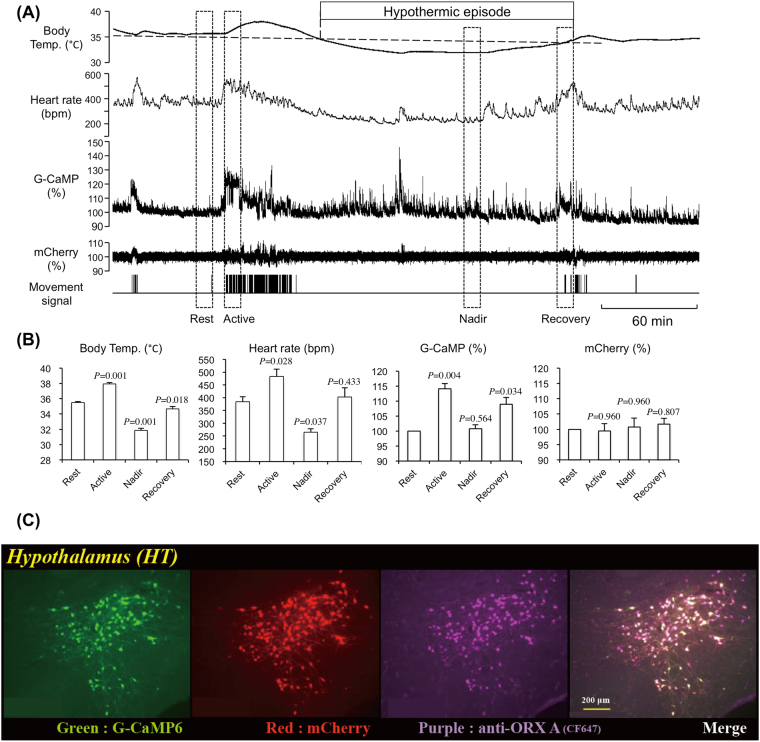
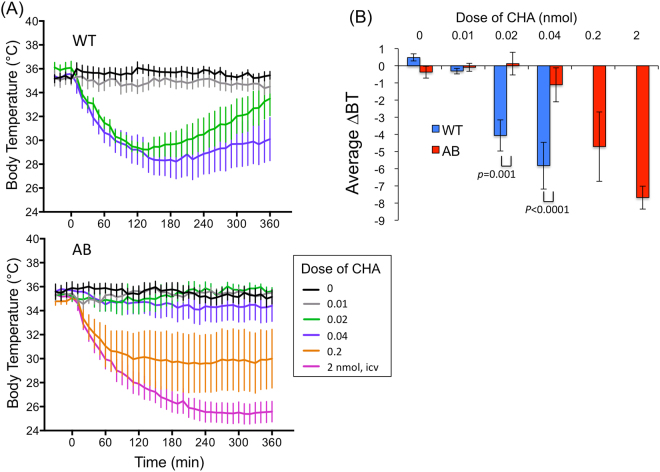
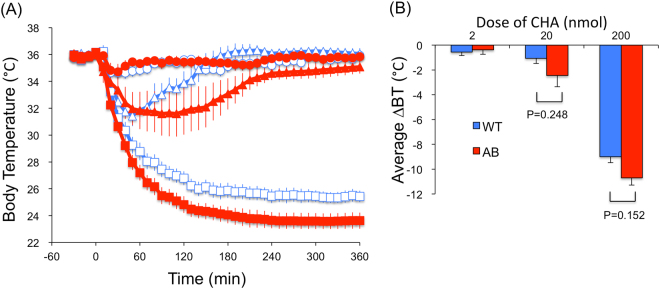
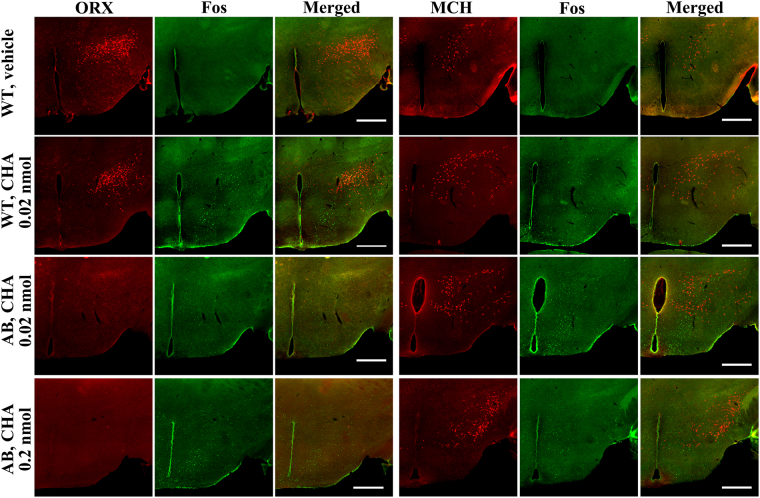
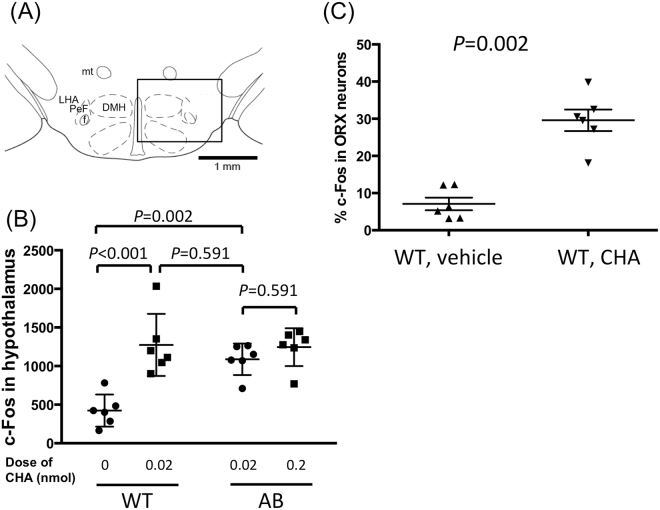
We examined whether orexin neurons might play a protective role against fasting- and adenosine-induced hypothermia. We first measured body temperature (BT) in orexin neuron-ablated (ORX-AB) mice and wild-type (WT) controls during 24 hours of fasting. As expected, the magnitude of BT drop and the length of time suffering from hypothermia were greater in ORX-AB mice than in WT mice. Orexin neurons were active just before onset of hypothermia and during the recovery period as revealed by calcium imaging in vivo using G-CaMP. We next examined adenosine-induced hypothermia via an intracerebroventricular administration of an adenosine A1 receptor agonist, N6-cyclohexyladenosine (CHA), which induced hypothermia in both ORX-AB and WT mice. The dose of CHA required to initiate a hypothermic response in ORX-AB mice was more than 10 times larger than the dose for WT mice. Once hypothermia was established, the recovery was seemingly slower in ORX-AB mice. Activation of orexin neurons during the recovery phase was confirmed by immunohistochemistry for c-Fos. We propose that orexin neurons play dual roles (enhancer in the induction phase and compensator during the recovery phase) in adenosine-induced hypothermia and a protective/compensatory role in fasting-induced hypothermia.


Conflict of interest statement

The authors declare no competing interests.

Figures

Figure 1
Figure 1
Fasting-induced hypothermia. (A) Individual traces of body temperature for three successive days are presented in different colors for wild-type (WT) mice and orexin neuron-ablated (ORX-AB) mice. Black and white bars in the middle indicate night and day, respectively. Food, but not water, was deprived for 24 hr for the second day. (B) Average body temperature (BT) for the night and day of the 1st day, minimum BT during the 1st day, and minimum BT during the fasting period. (C) Total time spent in hypothermia (torpor). (D) Representative tracings of body temperature (red, left ordinate) and body movement (blue, right ordinate) from a WT and an ORX-AB mouse. (E) Average body movement during the night and day in the 1st fed day and 2nd fasting day. In (B), (C) and (E), data are presented as mean ± SEM of the WT mice (n = 6) and ORX-AB mice (n = 6). P value was calculated using the Mann-Whitney U-test or two-way (genotypes x times) ANOVA with post-hoc Holm-Sidak multiple comparison test.
Figure 2
Figure 2
Activity recording of orexin neurons using fiber photometry during fasting-induced hypothermia. (A) Representative traces of body temperature, heart rate, G-CaMP fluorescence, mCherry fluorescence, and body movement in a mouse expressing G-CaMP and mCherry exclusively in orexin neurons. The first hypothermic episode during the fasting period is shown. (B) Averaged body temperature, heart rate, G-CaMP fluorescence, and mCherry fluorescence during four typical periods indicated by the dashed rectangles (10 min length) shown in A. See text for the definitions of Rest, Active, Nadir, and Recovery. Fluorescence intensity during the rest period was defined as 100%. (C) Histological evidence showing that G-CaMP and mCherry were exclusively expressed in almost all orexin neurons. In (B), data are presented as mean ± SEM of 5 animals. Data were collected only for the 1st hypothermic episode even if the animal experienced multiple hypothermic episodes. P values were calculated using the Holm-Sidak multiple comparison test.
Figure 3
Figure 3
Effect of central administration of an adenosine A1 receptor agonist, N6-cyclohexyladenosine (CHA), on body temperature. (A) Time-related changes in body temperature in wild-type mice (WT) and orexin neuron-ablated mice (AB). CHA was intracerebroventricularly injected at time 0. (B) Changes in body temperature (BT) averaged for 6 hours following the injection. 2-way ANOVA indicated there were statistical difference between genotypes (F1,40 = 15.68, p = 0.0003) and doses (F3,40 = 10.00, p < 0.0001). P values were calculated using the Holm-Sidak multiple comparison test. Each point represents mean ± SEM from 6 animals.
Figure 4
Figure 4
Effect of peripheral administration of an adenosine A1 receptor agonist, N6-cyclohexyladenosine (CHA), on body temperature. (A) Time-related changes in body temperature. Open symbols represent the data from wild-type mice (WT) and closed symbols from orexin neuron-ablated mice (AB). Circle, triangle, and square symbols indicate 2, 20, 200 nmol of CHA, respectively. CHA was intraperitoneally injected at time 0. (B) Changes in body temperature (BT) averaged for 6 hours after the injection. 2-way ANOVA indicated there was statistical difference among doses (F2,30 = 160.0, p < 0.0001) but not between genotypes (F1,30 = 4.11, p = 0.052). P values were calculated using the Holm-Sidak multiple comparison test. Each point represents mean ± SEM from 6 animals.
Figure 5
Figure 5
Effect of central administration of CHA on the hypothalamic neurons. Representative photographs show cellular activation marker c-Fos (green), orexin (ORX) or melanin concentrating hormone (MCH) immunoreactivity (red), and merged in the hypothalamus of vehicle-injected WT mice (top row), 0.02 nmol of CHA-injected WT mice (second row), 0.02 nmol of CHA-injected ORX-AB mice (third row), and 0.2 nmol of CHA-injected ORX-AB mice (bottom row). Horizontal bar indicates 500 µm. Note absence of orexin-immunoreactivity in ORX-AB mice (left end column, bottom 2 rows).
Figure 6
Figure 6
Activation of orexin neurons by CHA. (A) Square field denotes counting area for immunoreactivity. (B) The number of c-Fos positive cells among 4 groups of the mice: WT mice treated with vehicle, WT mice treated with 0.02 nmol of CHA, ORX-AB mice treated with low dose (0.02 nmol) of CHA, and ORX-AB mice treated with high dose (0.2 nmol) of CHA. 2-way ANOVA indicated there was statistical difference between doses (F1,20 = 7.89, p < 0.0108) and between genotypes (F1,20 = 19.86, p = 0.0002). P values were calculated using the Holm-Sidak multiple comparison test. (C) Percentage of the number of double positive cells among orexin immuno-positive cells. P value was calculated using the Mann-Whitney U-test. In (B) and (C), horizontal lines indicate mean and SEM of 6 animals. Keys for the brain structures: DMH, dorsomedial hypothalamus; f, fornix; LHA, lateral hypothalamic area; mt, mammillothalamic tract; PeF, perifornical area.

References

    1. Carey HV, Andrews MT, Martin SL. Mammalian hibernation: Cellular and molecular responses to depressed metabolism and low temperature. Physiol Rev. 2003;83:1153–1181. doi: 10.1152/physrev.00008.2003. - DOI - PubMed
    1. Hudson JW, Scott IM. Daily torpor in the laboratory mouse, mus musculus var. albino. Physiol Biochem Zoology. 1979;52:205–218.
    1. Swoap SJ, Gutilla MJ. Cardiovascular changes during daily torpor in the laboratory mouse. Am J Physiol Regul Integr Comp Physiol. 2009;297:R769–774. doi: 10.1152/ajpregu.00131.2009. - DOI - PMC - PubMed
    1. Sunagawa GA, Takahashi M. Hypometabolism during daily torpor in mice is dominated by reduction in the sensitivity of the thermoregulatory system. Sci Rep. 2016;6:37011. doi: 10.1038/srep37011. - DOI - PMC - PubMed
    1. Aslami H, Juffermans N. Induction of a hypometabolic state during critical illness - a new concept in the ICU? Neth J Med. 2010;68:190–198. - PubMed

Publication types