. 2018 Feb 9;8(1):2781.
doi: 10.1038/s41598-018-21122-5.

Incorporation of a skeletal muscle-specific enhancer in the regulatory region of Igf1 upregulates IGF1 expression and induces skeletal muscle hypertrophy

Affiliations

Incorporation of a skeletal muscle-specific enhancer in the regulatory region of Igf1 upregulates IGF1 expression and induces skeletal muscle hypertrophy

Yunlong Zou et al. Sci Rep. .

Abstract

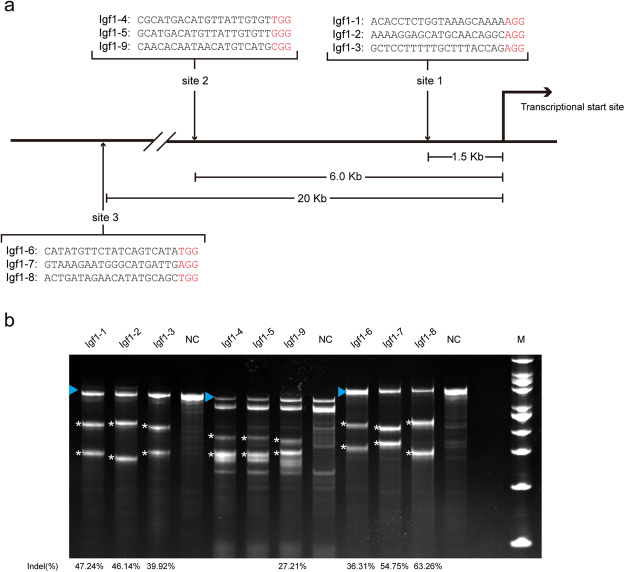
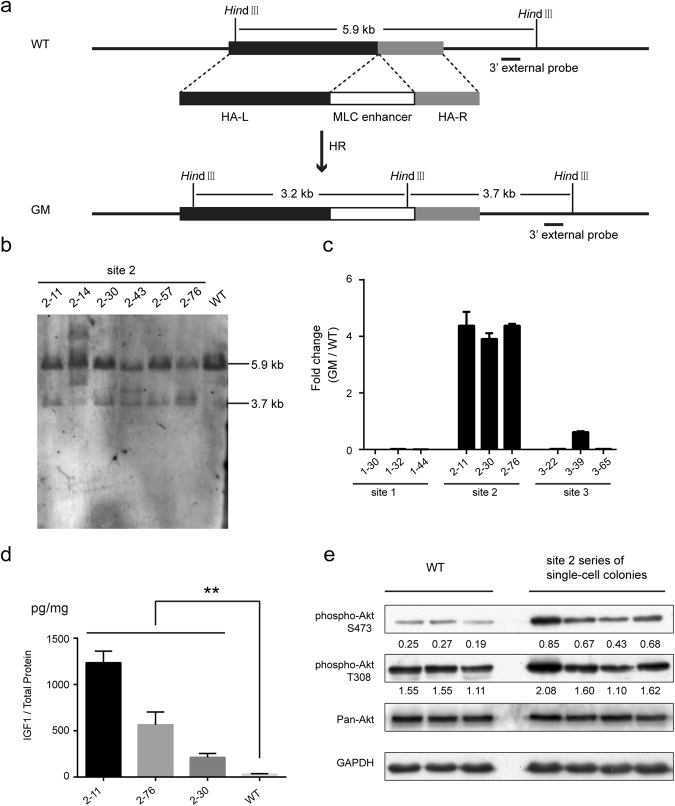
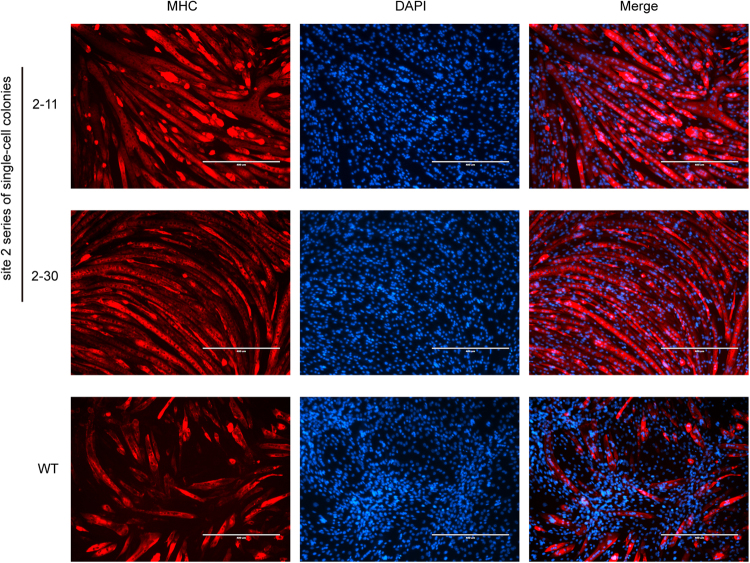
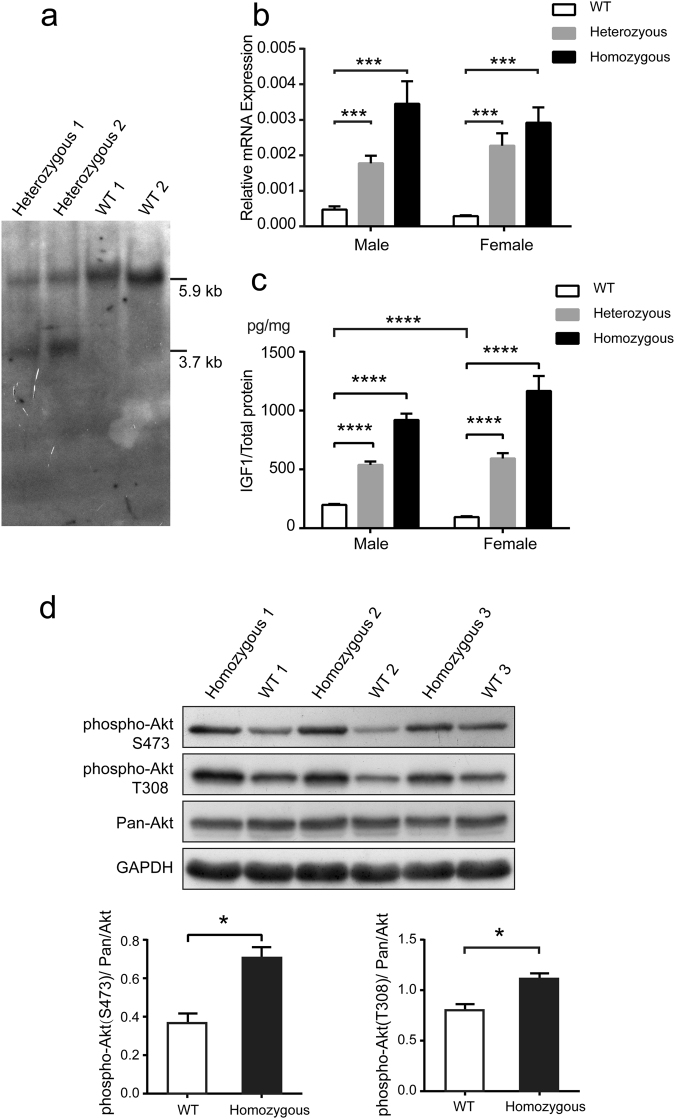
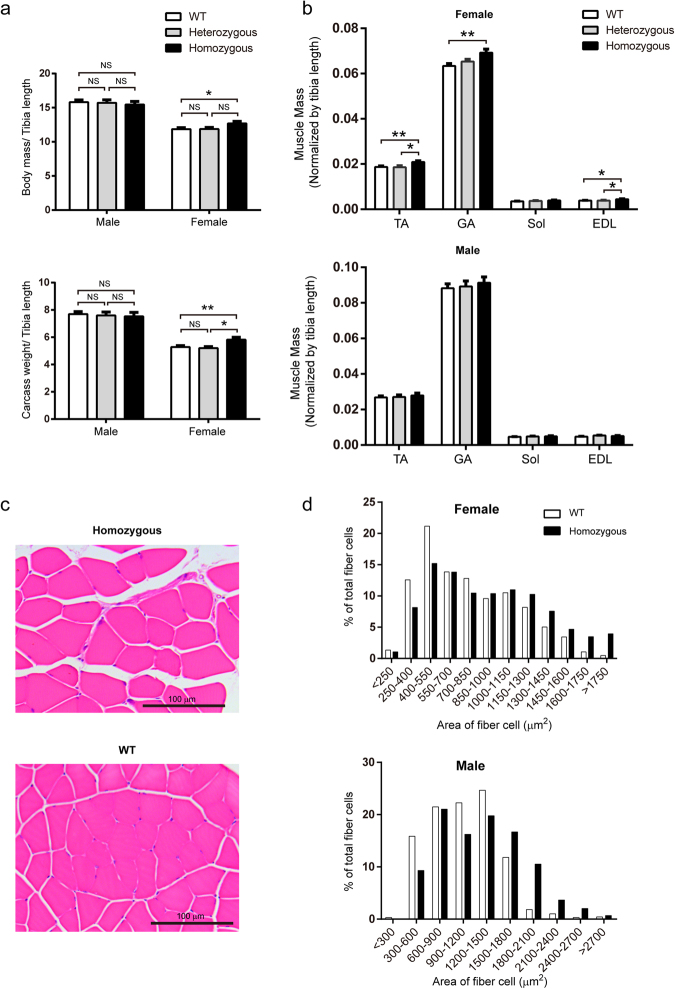
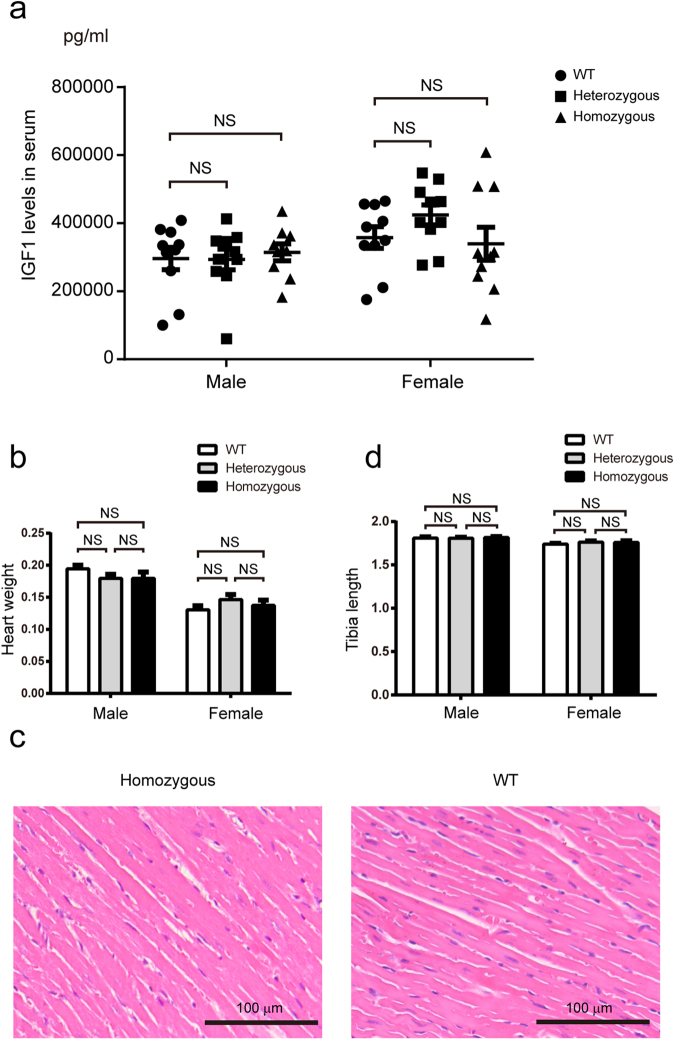
In this study, we upregulated insulin-like growth factor-1 (IGF1) expression specifically in skeletal muscle by engineering an enhancer into its non-coding regions and verified the expected phenotype in a mouse model. To select an appropriate site for introducing a skeletal muscle-specific myosin light chain (MLC) enhancer, three candidate sites that exhibited the least evolutionary conservation were chosen and validated in C2C12 single-cell colonies harbouring the MLC enhancer at each site. IGF1 was dramatically upregulated in only the site 2 single-cell colony series, and it exhibited functional activity leading to the formation of extra myotubes. Therefore, we chose site 2 to generate a genetically modified (GM) mouse model with the MLC enhancer incorporated by CRISPR/Cas9 technology. The GM mice exhibited dramatically elevated IGF1 levels, which stimulated downstream pathways in skeletal muscle. Female GM mice exhibited more conspicuous muscle hypertrophy than male GM mice. The GM mice possessed similar circulating IGF1 levels and tibia length as their WT littermates; they also did not exhibit heart abnormalities. Our findings demonstrate that genetically modifying a non-coding region is a feasible method to upregulate gene expression and obtain animals with desirable traits.


Conflict of interest statement

The authors declare no competing interests.

Figures

Figure 1
Figure 1
Confirmation of the activity of candidate enhancers by luciferase assays. (a) A schematic of luciferase reporter vectors. The enhancer sequences are linked to the Igf1 mini-gene in both orientations. The yellow, grey, and red blocks represent the luciferase coding cassette, the IRES element, and the Igf1 mini-gene cassette, respectively. The blue arrows represent the enhancer sequences and indicate the orientation with respect to the Igf1 mini-gene. (b) The luciferase expression levels of the indicated constructs in Hepa1–6 cells (top), C2C12 myoblasts (middle), and C2C12 myotubes (bottom). The results are representative of three independent experiments. Bars represent the mean values, and the error bars represent the standard error of the mean (SEM). *P < 0.05 between indicated reporter vectors and the IGF1-basic construct; **P < 0.01 between indicated reporter vectors and the IGF1-basic construct. Statistical significances were analysed by Student’s t-test.
Figure 2
Figure 2
Evaluation of sgRNAs targeting the three candidate insertion sites. (a) Schematic of the sgRNAs targeting the three candidate insertion sites. The protospacer-adjacent motifs (PAM) are labelled in red. The distance between each candidate insertion site and the transcriptional start site is shown. (b) T7EN1 assay detection of the efficiency of Cas9-mediated cleavage at the indicated targets. The blue triangles indicate the locations of the PCR products before T7EN1 digestion. The asterisks indicate cleaved PCR amplicon fragments of the expected sizes after T7EN1 digestion. The extra blots in lanes of the sgRNAs targeting the site 2 have no relation to the gene editing events and may arise from the SNPs existing in the C2C12 genome. The sgRNAs Igf1–1, Igf1–9 and Igf1–7 were used to generate double-stranded breaks to stimulate homologous recombination in each of the three respective candidate sites. NC: WT C2C12.
Figure 3
Figure 3
Evaluation of the ability of the candidate sites to support IGF1 expression in C2C12 single-cell colonies. (a) Schematic of the strategy used to knock in the MLC enhancer by homologous recombination (HR). The site 2 is chosen as an example; the strategy was the same for the site 1 and site 3. The black and grey blocks represent the 5′ long homology arm (HA-L) and 3′ short homology arms (HA-R), respectively. The white blocks represent the incorporated MLC enhancer. The restriction enzyme used for Southern blot analysis is shown. The 3′ external probe is shown as a short black line. (b) Southern blot analysis of the incorporated MLC enhancer in the site 2. Genomic DNA of the site 2 series of single-cell colonies and the WT control was digested with HindIII and then hybridized with the 3′ external probe. The expected fragment sizes are: WT, 5.9 kb; GM, 3.7 kb. (c) Real-time quantitative PCR analysis of the relative expression levels of Igf1 mRNA in myotubes of the site 1, site 2, site 3 series of single-cell colonies. The results were displayed as fold changes relative to the expression levels in WT C2C12 myotubes using the 2−△△CT method. Values are mean ± SEM of three independent experiments. (d) ELISA analysis of the IGF1 protein levels in myotubes of the site 2 series of single-cell colonies and the WT control. The total IGF1 levels are normalized to the total protein levels. Values are mean ± SEM of three independent experiments. (e) Western blot analysis of the Akt phosphorylation levels in myotubes of the site 2 series of single-cell-colonies and the WT control. Antibodies against phosphorylated Akt (Ser473), Akt (Thr308), and total Akt were used. GAPDH was used as a loading control. The ratio of the phosphorylated Akt (Ser473)/Pan-Akt and the phosphorylated Akt (Thr308)/Pan-Akt were determined by calculating the blot intensities and are shown below each respective blot. All gels/blots were run under the same experimental conditions. Shown are cropped gels/blots (Full-length gels/blots with indicated cropping lines are shown in Supplementary Figure S10).
Figure 4
Figure 4
Detection of the muscle hypertrophy phenotype in the site 2 series of single-cell colonies. Immunofluorescence staining of MHC in myotubes of the site 2 series of single-cell colonies and the C2C12 WT control.
Figure 5
Figure 5
Analysis of IGF1 expression levels in the genetically modified mouse model. (a) The strategy for Southern blot analysis of incorporation of the MLC enhancer in GM mice is the same as that shown in Fig. 2c. Genomic DNA of heterozygous GM mice and WT control was digested with HindIII and then hybridized with the 3′ external probe. The expected fragment sizes are: WT, 5.9 kb; GM, 3.7 kb. (b) Real-time PCR analysis of Igf1 mRNA levels in the gastrocnemius muscle of two-month-old GM mice and WT littermates. (n = 11–13 per group). (c) ELISA analysis of total IGF1 protein levels in the gastrocnemius muscle of two-month-old GM mice and WT littermates. The total IGF1 protein levels were normalized to the total protein levels. (n = 10–13 per group). (d) Western blot analysis of the Akt phosphorylation levels in the gastrocnemius muscle of one-month-old female GM mice and WT littermates. Antibodies against phosphorylated Akt (Ser473), Akt (Thr308), and total Akt were used. GAPDH was used as a loading control. The ratio of phosphorylated Akt (Ser473)/Pan-Akt and phosphorylated Akt (Thr308)/Pan-Akt were determined by calculating the intensities of the blots and are shown below. All gels/blots were run under the same experimental conditions. Shown are cropped gels/blots (Full-length gels/blots with indicated cropping lines are shown in Supplementary Figure S10). Bars depict mean values, and error bars represent SEM. *P < 0.05, **P < 0.01, ***P < 0.0001, ****P < 0.000001. Statistical significances were analysed by Student’s t-test.
Figure 6
Figure 6
Detection of skeletal muscle hypertrophy in a genetically modified mouse model. (a) Average body mass (top) and carcass weight (bottom) of the three-month-old GM mice and sex-matched WT littermates (n = 8–15 per group). The body mass and carcass weight were normalized to the length of the tibia, respectively. (b) Determination of the muscle weight of the three-month-old GM mice and WT littermates (top, female mice; bottom, male mice). The data indicate the average weight of the muscles from the left and right sides. The muscle weight is normalized to the length of the tibia. (n = 10 for female homozygous GM mice, n = 8 for female heterozygous GM mice, and n = 15 for female WT mice; n = 10 for male homozygous GM mice, n = 8 for male heterozygous GM mice, and n = 12 for male WT mice). (c) Representative images of H&E-stained cross-sections of the TA muscle from three-month-old female GM mice and WT littermates. (d) CSA frequency distribution of myofibres in the TA muscle from three-month-old GM mice and sex-matched WT littermates (sections from at least five mice per group). Bars depict mean values, and error bars represent SEM. *P < 0.05, **P < 0.01. Statistical significances were analysed by Student’s t-test.
Figure 7
Figure 7
Evaluation of the systemic effect of elevated IGF1 in skeletal muscle. (a) ELISA analysis of the total IGF1 levels in serum from two-month-old GM mice and WT littermates (n = 9–10 per group). (b) Determination of the weight of the heart from three-month-old GM mice and WT littermates (n = 7–13 per group). (c) No pathological changes were detected by H&E analysis of the longitudinal section of hearts from three-month old GM mice and WT littermates. (d) Comparison of the tibia lengths of three-month-old GM mice and WT littermates. (n = 8–15 per group). Bars depict mean values, and error bars represent SEM. NS, not significant. Statistical significances were analysed by Student’s t-test.

Similar articles

Cited by

References

    1. Palmiter RD, et al. Dramatic growth of mice that develop from eggs microinjected with metallothionein-growth hormone fusion genes. Nature. 1982;300:611–615. doi: 10.1038/300611a0. - DOI - PMC - PubMed
    1. Hammer RE, et al. Production of transgenic rabbits, sheep and pigs by microinjection. Nature. 1985;315:680–683. doi: 10.1038/315680a0. - DOI - PubMed
    1. Jaenisch R, Mintz B. Simian virus 40 DNA sequences in DNA of healthy adult mice derived from preimplantation blastocysts injected with viral DNA. Proc. Natl. Acad. Sci. USA. 1974;71:1250–1254. doi: 10.1073/pnas.71.4.1250. - DOI - PMC - PubMed
    1. Jaenisch R. Germ line integration and Mendelian transmission of the exogenous Moloney leukemia virus. Proc. Natl. Acad. Sci. USA. 1976;73:1260–1264. doi: 10.1073/pnas.73.4.1260. - DOI - PMC - PubMed
    1. Gordon JW, Scangos GA, Plotkin DJ, Barbosa JA, Ruddle FH. Genetic transformation of mouse embryos by microinjection of purified DNA. Proc. Natl. Acad. Sci. USA. 1980;77:7380–7384. doi: 10.1073/pnas.77.12.7380. - DOI - PMC - PubMed

Publication types

Substances