. 2018 Apr;17(2):e12707.
doi: 10.1111/acel.12707. Epub 2018 Feb 10.

Overexpression of PGC-1α in aging muscle enhances a subset of young-like molecular patterns

Affiliations

Overexpression of PGC-1α in aging muscle enhances a subset of young-like molecular patterns

Sofia Garcia et al. Aging Cell. 2018 Apr.

Abstract

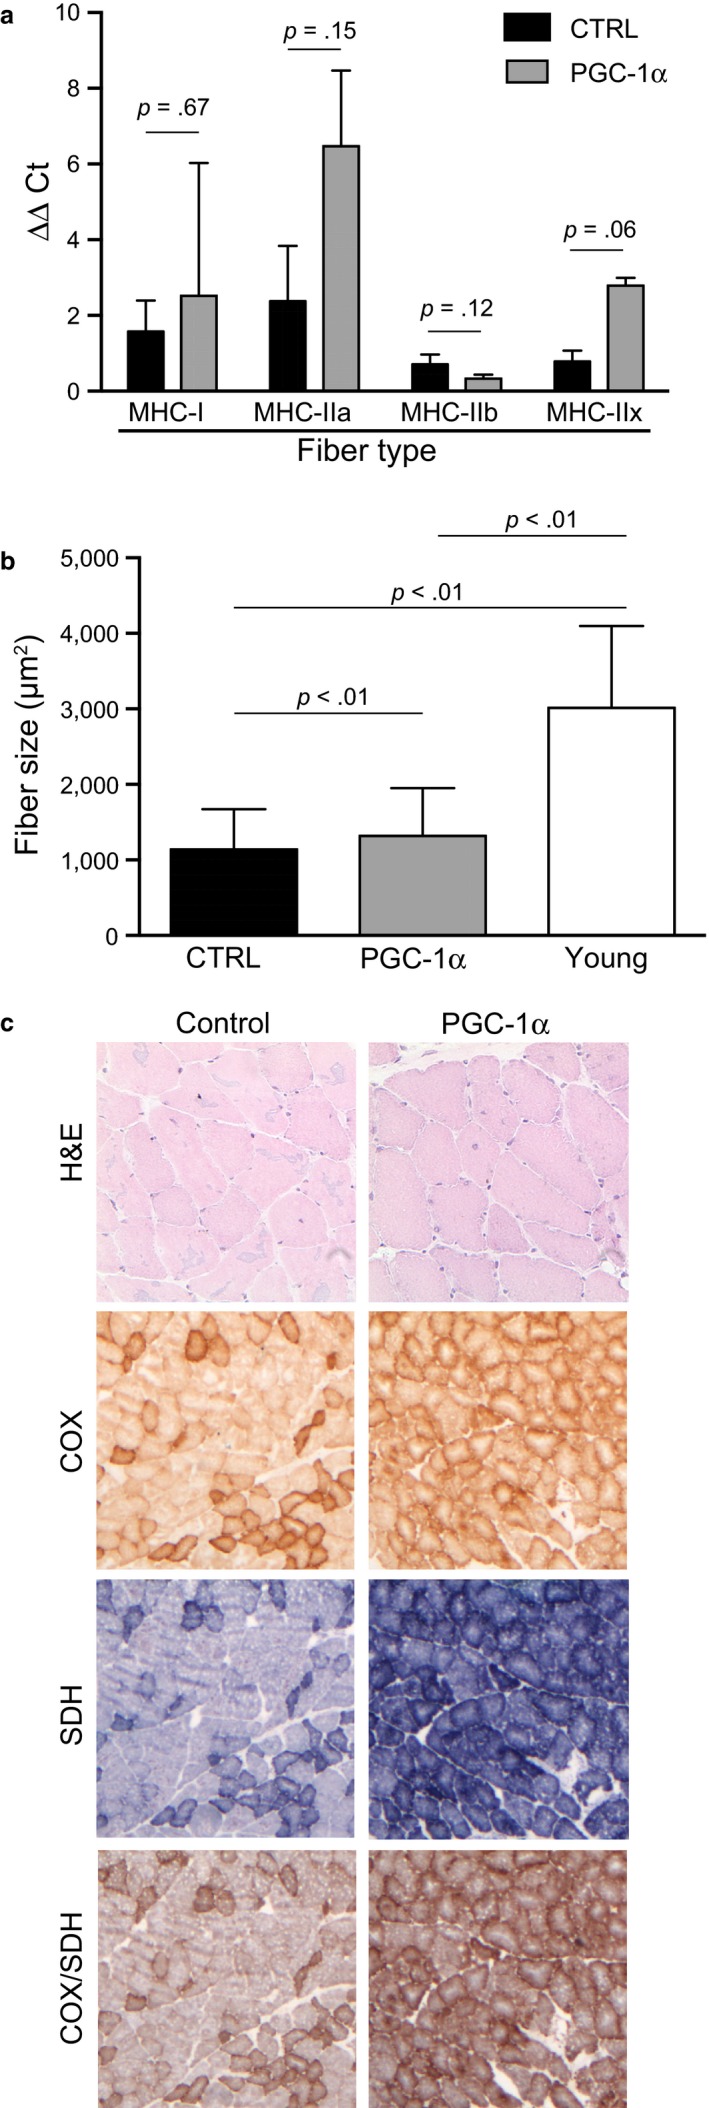
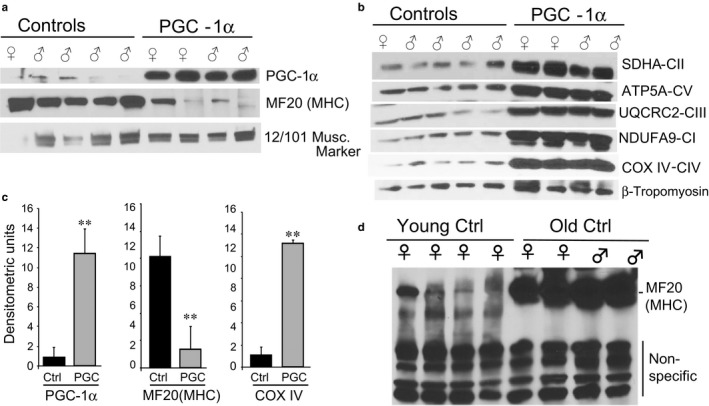
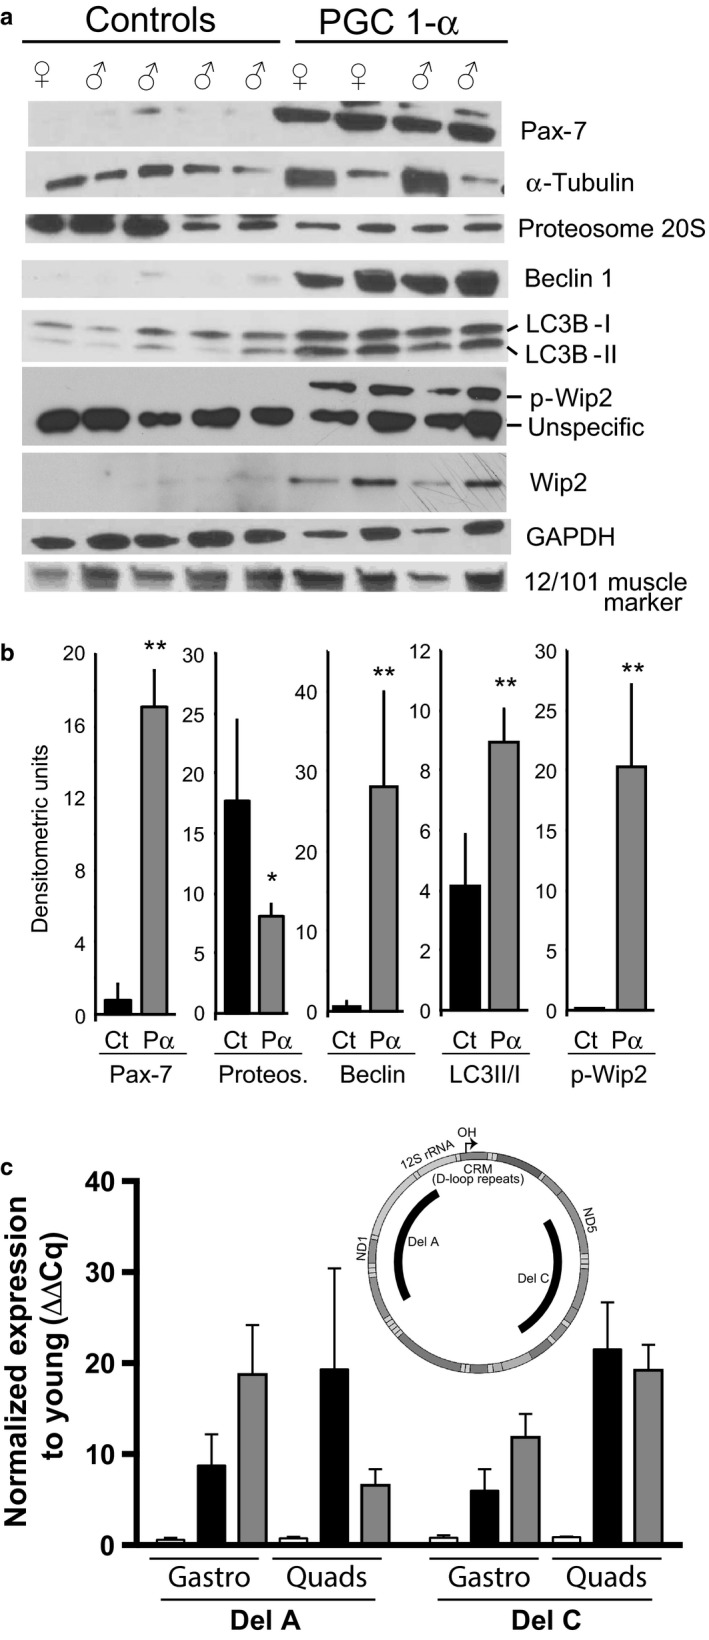
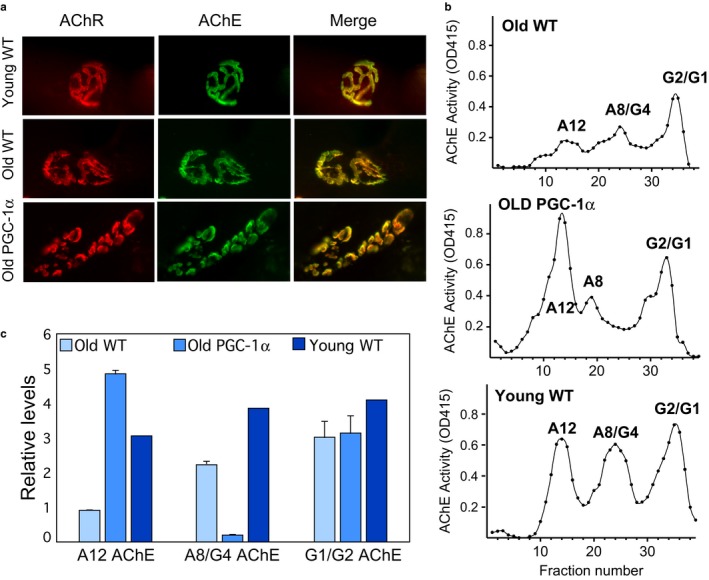
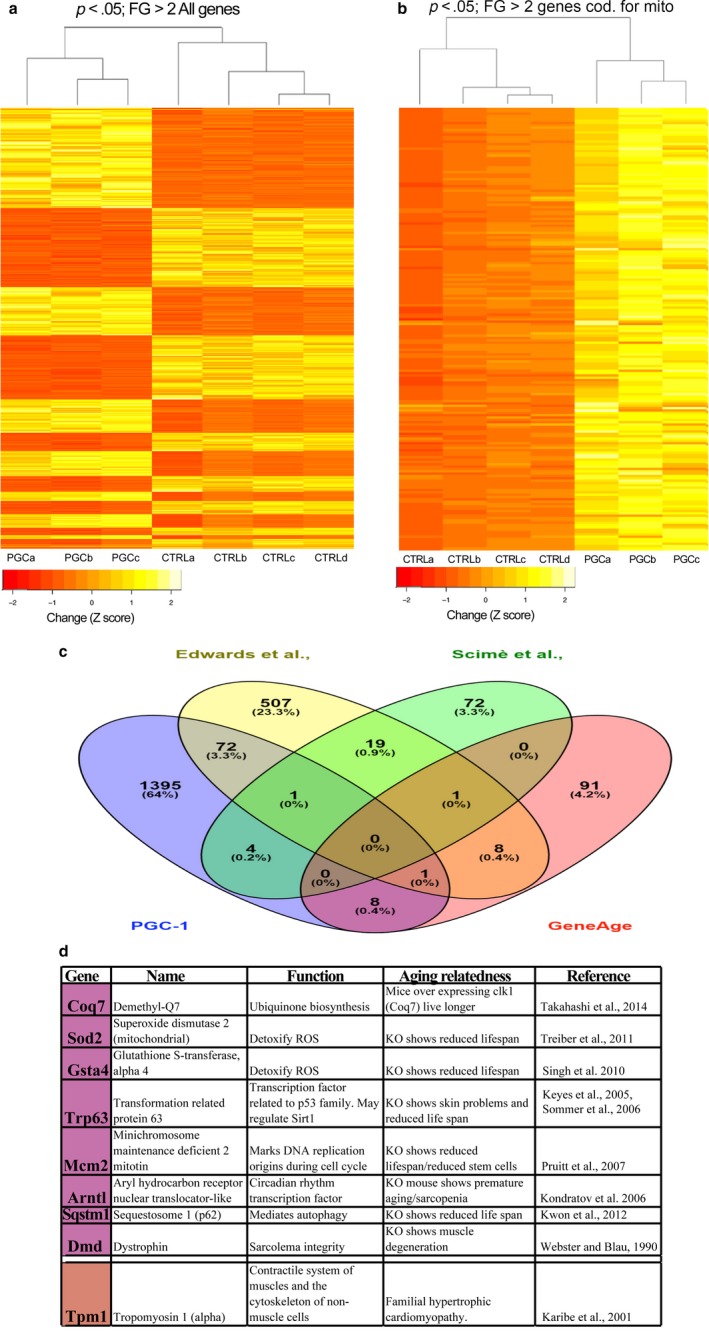
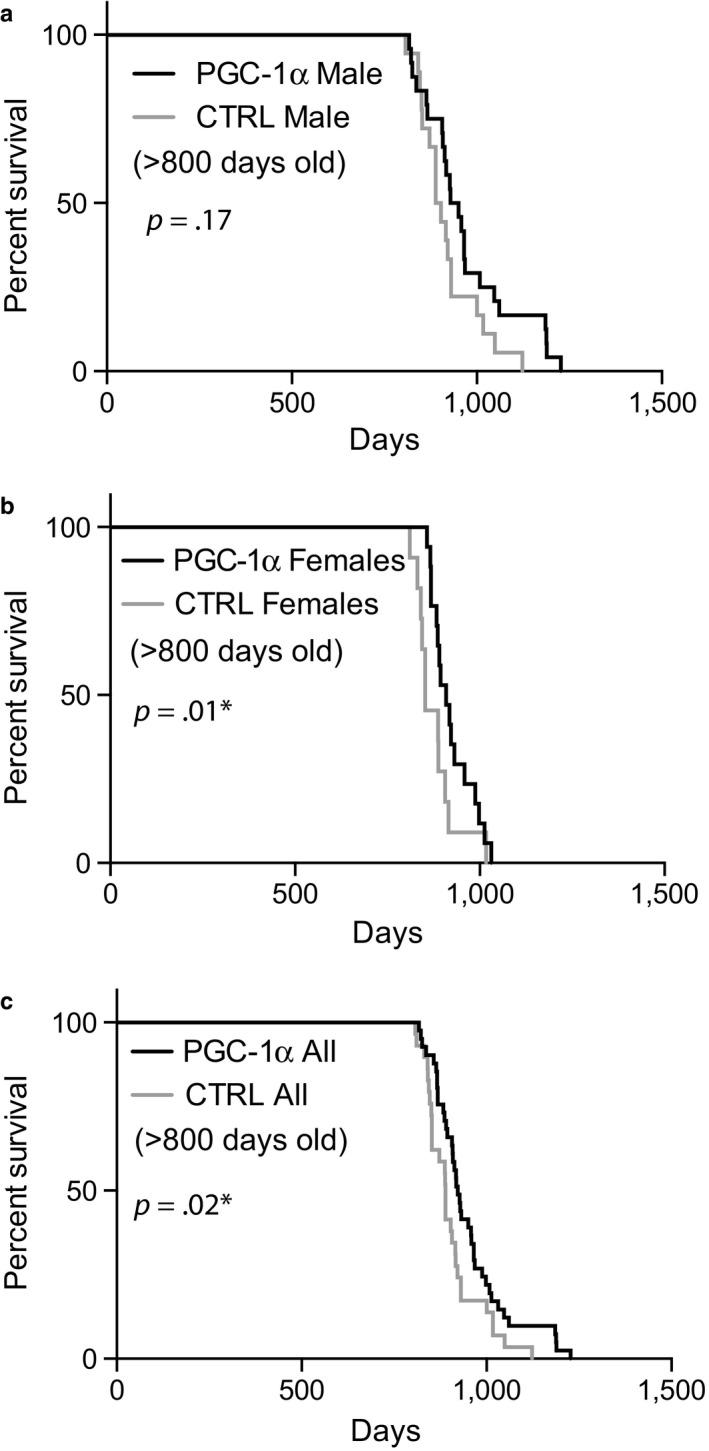
PGC-1α is a transcriptional co-activator known as the master regulator of mitochondrial biogenesis. Its control of metabolism has been suggested to exert critical influence in the aging process. We have aged mice overexpressing PGC-1α in skeletal muscle to determine whether the transcriptional changes reflected a pattern of expression observed in younger muscle. Analyses of muscle proteins showed that Pax7 and several autophagy markers were increased. In general, the steady-state levels of several muscle proteins resembled that of muscle from young mice. Age-related mtDNA deletion levels were not increased by the PGC-1α-associated increase in mitochondrial biogenesis. Accordingly, age-related changes in the neuromuscular junction were minimized by PGC-1α overexpression. RNA-Seq showed that several genes overexpressed in the aged PGC-1α transgenic are expressed at higher levels in young when compared to aged skeletal muscle. As expected, there was increased expression of genes associated with energy metabolism but also of pathways associated with muscle integrity and regeneration. We also found that PGC-1α overexpression had a mild but significant effect on longevity. Taken together, overexpression of PGC-1α in aged muscle led to molecular changes that resemble the patterns observed in skeletal muscle from younger mice.

Keywords: aging; lifespan; longevity; mitochondria; mouse models; skeletal muscle.


Figures

Figure 1
Figure 1
Fiber‐type composition of aged mice overexpressing PGC‐1α in muscle. Panel a shows the analysis of MHC isotypes. There was an increase in slow fiber type (more oxidative) in the transgenic mice. N = 4 per group. Fiber diameter size was determined by automated scanning of >1,300 fibers after immunostaining for laminin. Young muscle (4 months old) was included in these analyses (Panel b). Histological staining for H&E and enzyme activity of mitochondrial cytochrome oxidase (COX) and succinate dehydrogenase (SDH) in muscle are shown in panel c
Figure 2
Figure 2
Western blot analyses of skeletal muscle proteins. Panel a shows the levels of PGC‐1α and two muscle markers from the DSB repository (myosine heavy‐chain MF20 and 12/101 marker). Panel b shows the levels of OXPHOS proteins, namely: SDHA, ATP5A, UQCRC2, NDUFA9, and COX IV. Panel c shows the quantification of selected blots in panels a and b. **p < .05
Figure 3
Figure 3
Analyses of muscle proteins associated with muscle wasting. Panel a shows Western blots of muscle proteins showing marked alterations in steady‐state levels. These include Pax7 (satellite cell marker), proteasome 20S (proteome degradation), beclin (autophagy), LC3II/I ratio (autophagy), wip2, and p‐wip2 (autophagy). Loading controls are also indicated (α‐tubulin, p‐wip2‐unspecific band, and GAPDH). Panel b shows the quantification of protein of interest. **p < .05. Panel c shows the quantification of previously reported age‐related mtDNA deletions (known as Deletion A and Deletion C). These were increased in aged muscle (measured by qPCR), but no different between the groups
Figure 4
Figure 4
NMJ alteration during aging and in PGC‐1α overexpressor. Panel a shows NMJs stained with Alexa‐555 α‐bungarotoxin to label AChR and Alexa‐488 Fasciculin2 to label AChE to visualize the NMJ. Panel b shows sucrose gradient profiles of AChE activity, which separates the different oligomeric forms of AChE expressed in young and older animals. G1, G2, and G4 are the globular monomeric, dimeric, and tetrameric AChE forms, respectively. A8 and A12 indicate the positions of the asymmetric collagen‐tailed synaptic forms. Panel c shows the quantification of the different AChE forms. Graph represent the mean and error bars are SEM. N = 3 for the old samples (wt and PGC‐1α) and N = 2 for the young sample
Figure 5
Figure 5
Transcriptome analyses of aged PGC‐1α vs. aged controls. Panels a–b show the clustering of the transcriptome pattern in aged muscle from controls and PGC‐1α overexpressors. Only genes with fold change larger than 2 and p < .05 were included in the analyses. Panel a shows all genes falling within these parameters, whereas panel b shows only genes coding for mitochondrial proteins. Yellow color indicates increased levels, whereas orange indicates decreased expression. The list of genes can be found in Table S2. Panel c shows a Venn diagram showing the overlap of genes altered in our study and genes altered in other age‐related mouse muscle studies, whereas panel d summarizes the function of the genes that specifically overlap with our PGC‐1α overexpressor and the GenAge dataset with potential relevance to longevity and/or aging
Figure 6
Figure 6
Kaplan–Meier survival curves of old mice overexpressing PGC‐1α in skeletal muscle. Two groups of mice that are either control C57/Bl6J or C57/Bl6J overexpressing PGC‐1α in skeletal muscle were analyzed for survival, n > 60 per group. We analyzed separately males (panel a), females (panel b), and combined sex (panel c). Although there was no difference between groups when all animals were analyzed (not shown), analyses restricted to mice that reached old age (more than 800 days) detected a modest extension (approximately 5%) in median lifespan (females and combined) and approximately 10% in maximal lifespan (males and combined)

References

    1. Acosta, M. J. , Vazquez Fonseca, L. , Desbats, M. A. , Cerqua, C. , Zordan, R. , Trevisson, E. , & Salviati, L. (2016). Coenzyme Q biosynthesis in health and disease. Biochimica et Biophysica Acta, 1857, 1079–1085. https://doi.org/10.1016/j.bbabio.2016.03.036 - DOI - PubMed
    1. Bilodeau, P. A. , Coyne, E. S. , & Wing, S. S. (2016). The ubiquitin proteasome system in atrophying skeletal muscle – roles & regulation. The American Journal of Physiology‐Cell Physiology, 311, C392–C403. https://doi.org/10.1152/ajpcell.00125.2016 - DOI - PubMed
    1. Blau, H. M. , Cosgrove, B. D. , & Ho, A. T. (2015). The central role of muscle stem cells in regenerative failure with aging. Nature Medicine, 21, 854–862. https://doi.org/10.1038/nm.3918 - DOI - PMC - PubMed
    1. Cefalu, S. , Lena, A. M. , Vojtesek, B. , Musaro, A. , Rossi, A. , Melino, G. , & Candi, E. (2015). TAp63gamma is required for the late stages of myogenesis. Cell Cycle, 14, 894–901. https://doi.org/10.4161/15384101.2014.988021 - DOI - PMC - PubMed
    1. Chan, M. C. , Rowe, G. C. , Raghuram, S. , Patten, I. S. , Farrell, C. , & Arany, Z. (2014). Post‐natal induction of PGC‐1alpha protects against severe muscle dystrophy independently of utrophin. Skeletal Muscle, 4, 2 https://doi.org/10.1186/2044-5040-4-2 - DOI - PMC - PubMed

Publication types

Substances

LinkOut - more resources