. 2018 May;44(5):1012-1021.
doi: 10.1016/j.ultrasmedbio.2017.11.006. Epub 2018 Feb 7.

Pulmonary Capillary Hemorrhage Induced by Different Imaging Modes of Diagnostic Ultrasound

Affiliations

Pulmonary Capillary Hemorrhage Induced by Different Imaging Modes of Diagnostic Ultrasound

Douglas L Miller et al. Ultrasound Med Biol. 2018 May.

Abstract

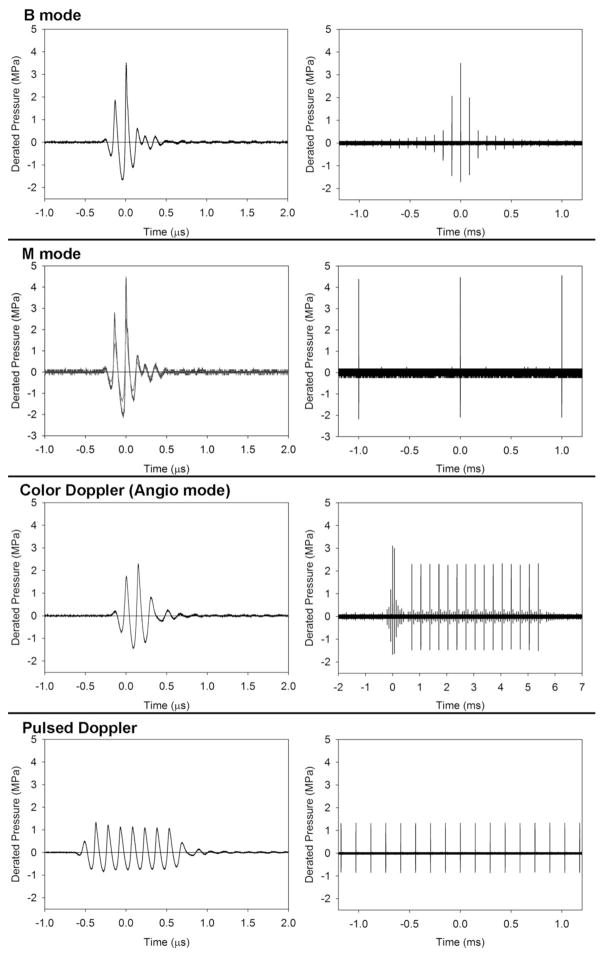
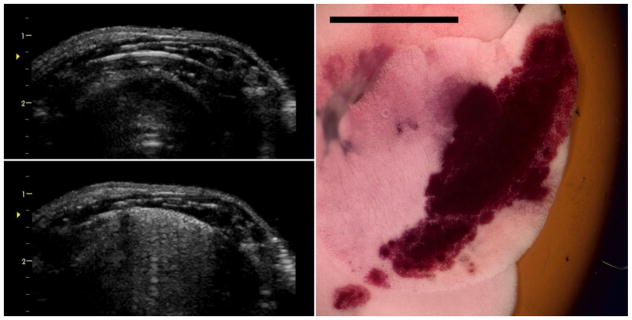
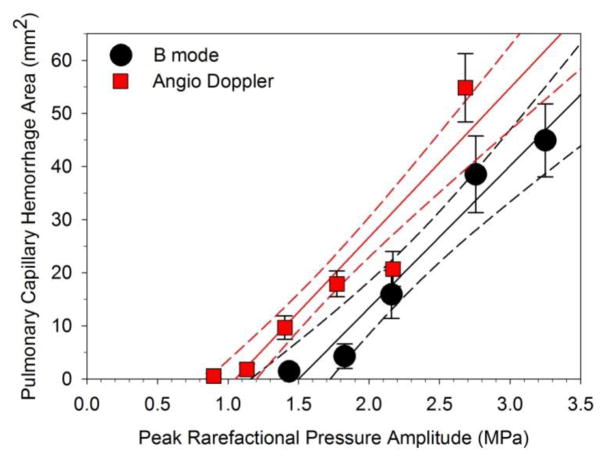
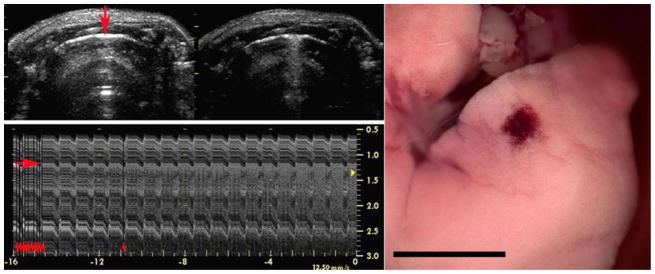
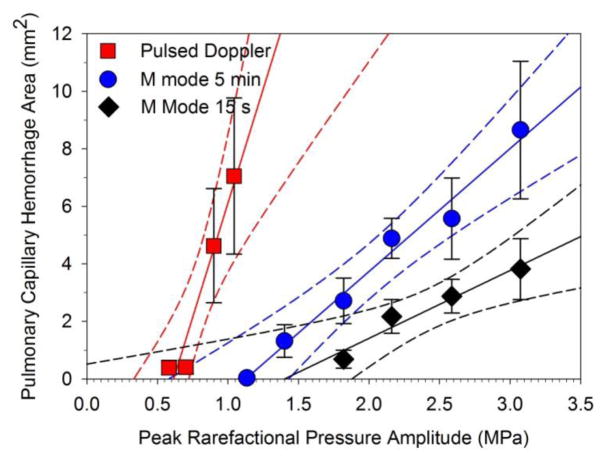
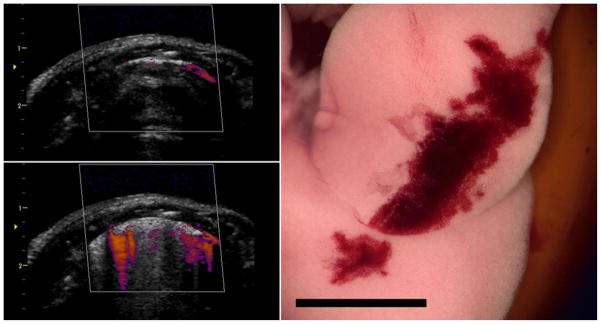
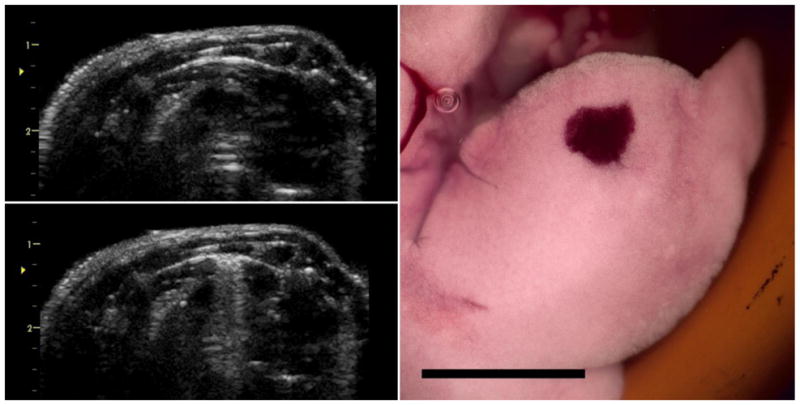
The induction of pulmonary capillary hemorrhage (PCH) is a well-established non-thermal biological effect of pulsed ultrasound in animal models. Typically, research has been done using laboratory pulsed ultrasound systems with a fixed beam and, recently, by B-mode diagnostic ultrasound. In this study, a GE Vivid 7 Dimension ultrasound machine with 10 L linear array probe was used at 6.6 MHz to explore the relative PCH efficacy of B-mode imaging, M-mode (fixed beam), color angio mode Doppler imaging and pulsed Doppler mode (fixed beam). Anesthetized rats were scanned in a warmed water bath, and thresholds were determined by scanning at different power steps, 2 dB apart, in different groups of six rats. Exposures were performed for 5 min, except for a 15-s M-mode group. Peak rarefactional pressure amplitude thresholds were 1.5 MPa for B-mode and 1.1 MPa for angio Doppler mode. For the non-scanned modes, thresholds were 1.1 MPa for M-mode and 0.6 MPa for pulsed Doppler mode with its relatively high duty cycle (7.7 × 10⁻³ vs. 0.27 × 10⁻³ for M-mode). Reducing the duration of M-mode to 15 s (from 300 s) did not significantly reduce PCH (area, volume or depth) for some power settings, but the threshold was increased to 1.4 MPa. Pulmonary sonographers should be aware of this unique adverse bio-effect of diagnostic ultrasound and should consider reduced on-screen mechanical index settings for potentially vulnerable patients.

Keywords: Bio-effects of ultrasound; Comet tail artifact; Diagnostic ultrasound safety; Pulmonary ultrasound; Ultrasound dosimetry.


Figures

Figure 1
Figure 1
A display of the pulse waveforms for each of the diagnostic ultrasound modes used. The power levels were the lowest settings with statistically significant pulmonary capillary hemorrhage. For B and Angio Doppler imaging modes, the pulses are short (left column) and several pulses appear in the sequence as the scanning beam passes by the hydrophone (right column). For B mode, this produces a rapid rise and fall of amplitudes. For the Angio Doppler mode, there is a brief B-mode sequence, for the greyscale background image, and sequences of 15 pulses which accurately determine the motion (normally blood flow). This sequence also passes by the hydrophone with rising and falling amplitudes; here only the maximum sequence is shown at the center of the Doppler box. For the fixed beam pulsed modes, the sequence (right column) is simply a pulse train at the pulse repetition period. The M mode pulse (left column) is the same for both the 15 s and 5 min exposures. The pulsed-Doppler pulse is relatively long to yield accurate velocity measurements within the sample volume.
Figure 2
Figure 2
Images for the B mode exposure at 0 dB (maximum power). The initial image (upper left) shows the bright-line lung reflection at 1.3 cm depth (approximately at the focus arrowhead). After 5 min the image (lower left) shows the resulting comet tail artifacts extending across the surface (sometimes called the “white lung” sign) due to the pulmonary capillary hemorrhage. The right image shows the right medial lung lobe with a hemorrhage area corresponding to the ultrasound scan plane. Scale bar 1 cm.
Figure 3
Figure 3
A plot of the pulmonary capillary hemorrhage area measurements for B mode (black circles) and Angio Doppler mode (red squares) for the PRPAs used. A linear regression is shown for each plot (lines) with 95% confidence intervals (dashed lines). Each point is the mean for six rats with standard error bars. Both trends are increasing area above a threshold.
Figure 4
Figure 4
Images for the M mode 15 s exposure at 0 dB (maximum power). The initial image (upper left on the left) shows the bright-line lung reflection at 1.3 cm with the M mode aim indicated by the red arrow. After 5 min the image (upper left on the right) shows the resulting comet tail artifacts extending across a small region of the surface where the fixed beam was aimed. The lower left image shows the M mode trace proceeding from left to right for 16 s: the red arrow indicates the lung surface, while the repeated red hash marks indicate the increase in power steps from −20 dB to 0 dB (stepped back down immediately after the trace was recorded). Note that the trace shows a progressive breakup as the comet tail artifact forms along the beam line. The lung image of the medial lobe has a hemorrhage spot corresponding to the beam aim point. Scale bar 1 cm.
Figure 5
Figure 5
A plot of the pulmonary capillary hemorrhage area measurements for M mode for 5 min (blue circles) and 15 s (black diamonds) and pulsed Doppler mode (red squares) for the PRPAs. Linear regressions are shown for each plot (lines), with 95% confidence intervals (dashed lines). Each point is the mean for six rats with standard error bars. Both M mode trends are increasing area above a threshold. The pulse Doppler mode is much more effective at the relatively low PRPA values.
Figure 6
Figure 6
Images for the Angio Doppler mode exposure at 0 dB (maximum power) as for the B mode (Fig. 2). In this case the images (upper and lower left) show the Angio color display as well as the background grey scale (B mode) image. The hemorrhage area on the lung is similar to the B mode effect. Scale bar 1 cm.
Figure 7
Figure 7
Images for the pulsed Doppler mode exposure at 0 dB (maximum power), presented as for the Angio Doppler mode. The initial B mode image (upper left) shows the bright-line lung reflection, followed by the narrow comet tail artifact display (lower left) after 5 min. The right medial lung lobe (right) has the characteristic hemorrhage spot corresponding to the pulsed Doppler aim point. Scale bar 1 cm.

References

    1. Ahmad S, Eisen LA. Lung ultrasound: the basics. In: Lumb P, Karakitsos D, editors. Critical care ultrasound. Ch 19. Philadelphia: Elsevier; 2015. pp. 106–110.
    1. American Institute of Ultrasound in Medicine [no authors listed] Section 4--bioeffects in tissues with gas bodies. J Ultrasound Med. 2000;19:97–108. 154–68. - PMC - PubMed
    1. American Institute of Ultrasound in Medicine. Statement on Mammalian Biological Effects in Tissues with Naturally Occurring Gas Bodies. 2015 http://www.aium.org/resources/statements.aspx.
    1. Bailey MR, Dalecki D, Child SZ, Raeman CH, Penney DP, Blackstock DT, Carstensen EL. Bioeffects of positive and negative acoustic pressures in vivo. J Acoust Soc Am. 1996;100:3941–3946. - PubMed
    1. Bossone E, Ferrara F, Grünig E. Echocardiography in pulmonary hypertension. Curr Opin Cardiol. 2015;30:574–86. - PubMed

Publication types