. 2018 Feb 22;172(5):1022-1037.e14.
doi: 10.1016/j.cell.2018.01.004. Epub 2018 Feb 8.

NK Cells Stimulate Recruitment of cDC1 into the Tumor Microenvironment Promoting Cancer Immune Control

Affiliations

NK Cells Stimulate Recruitment of cDC1 into the Tumor Microenvironment Promoting Cancer Immune Control

Jan P Böttcher et al. Cell. .

Abstract

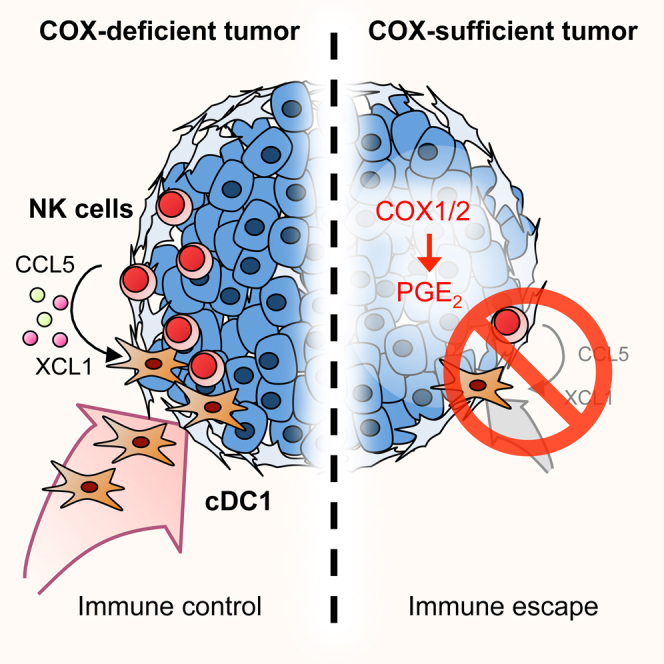
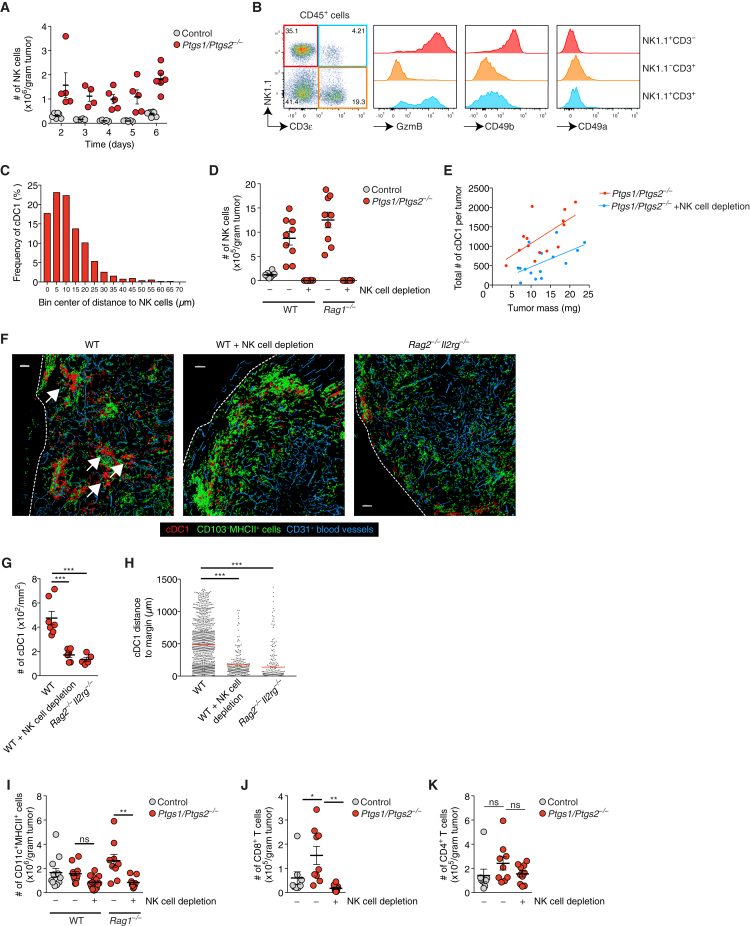
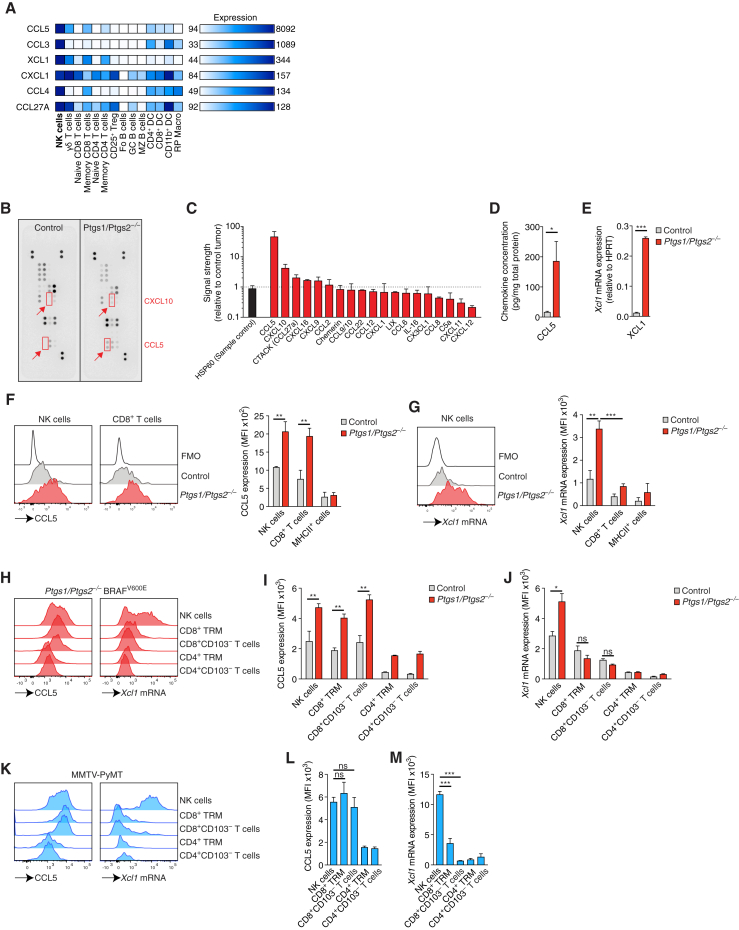
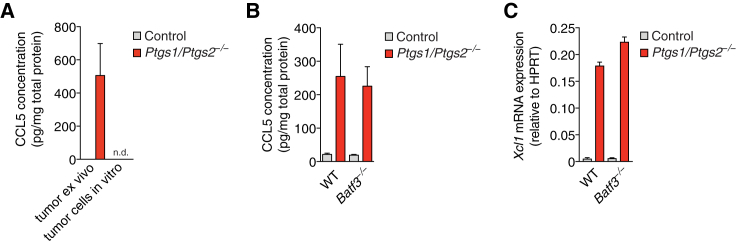
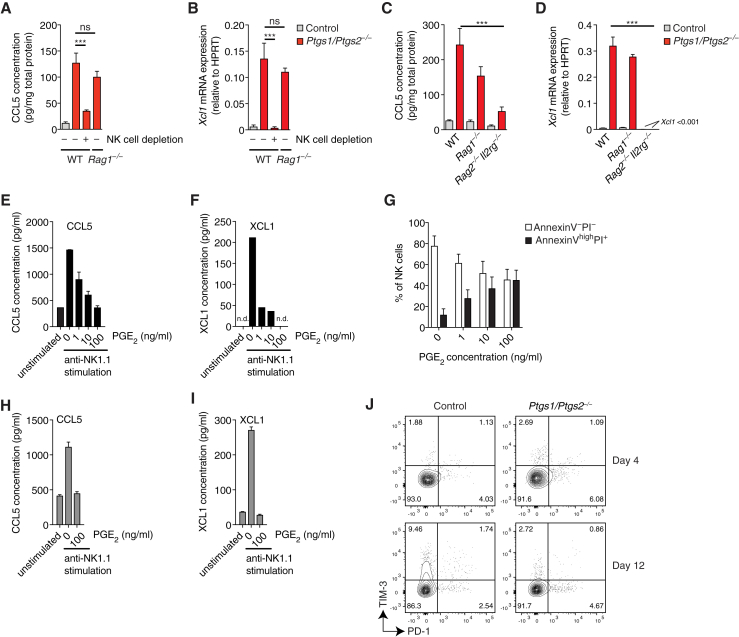
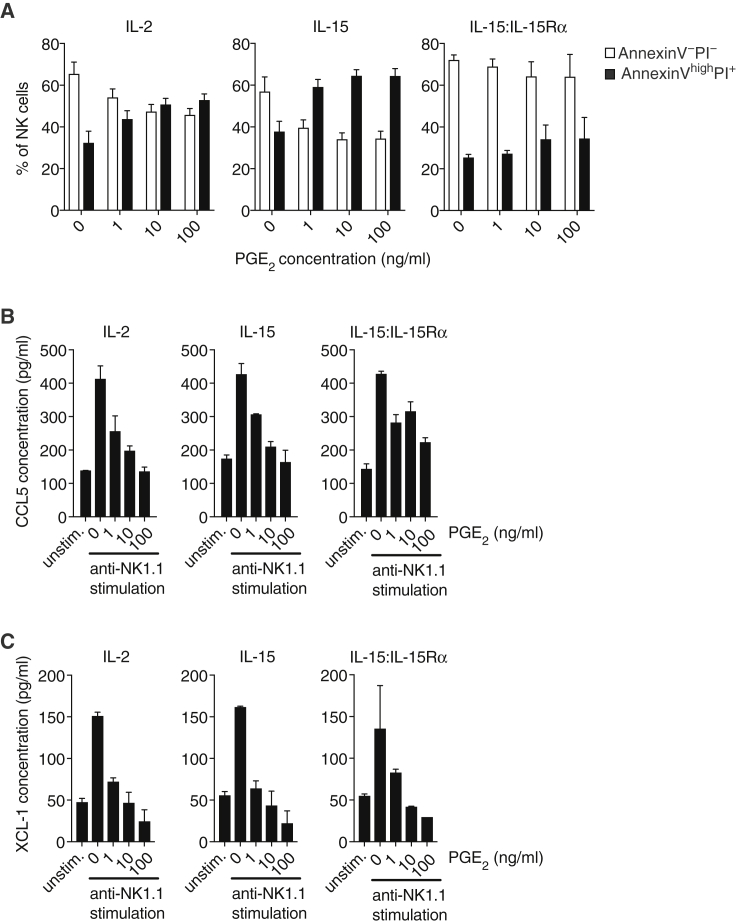
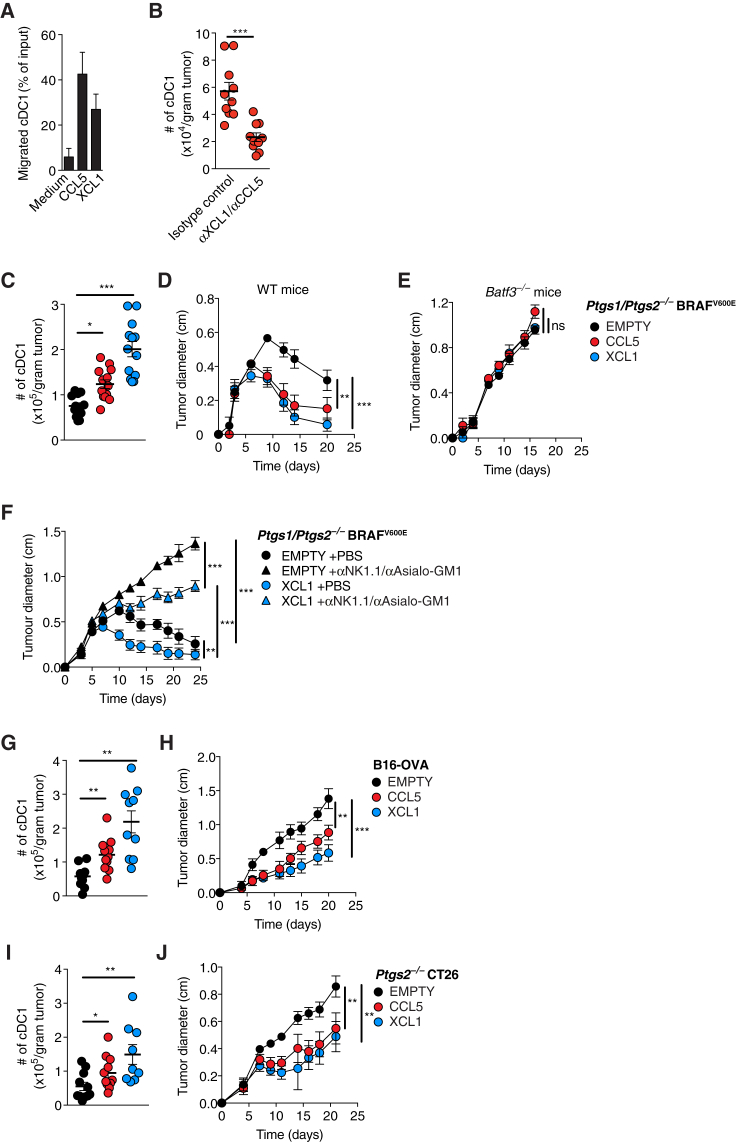
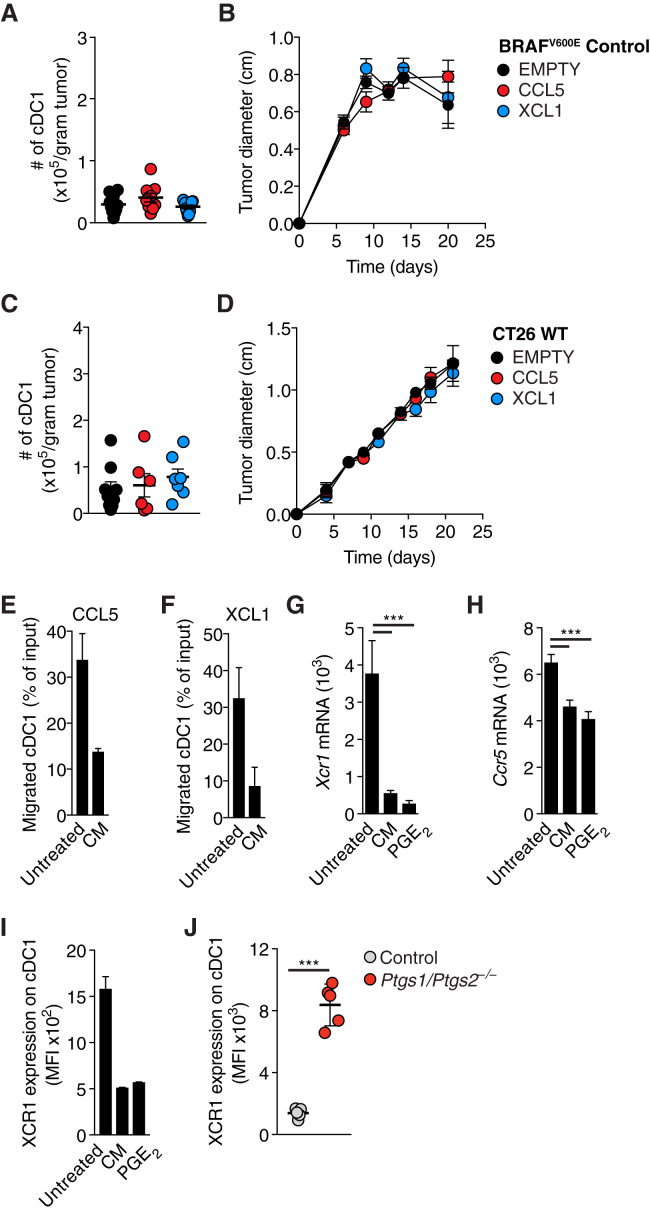
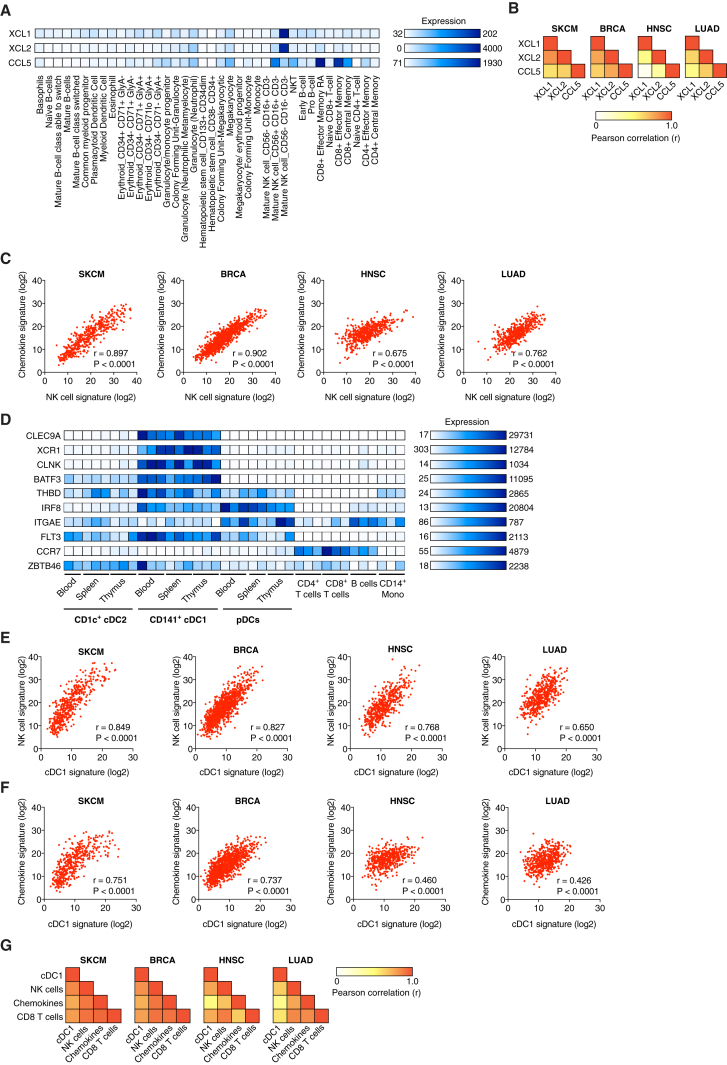
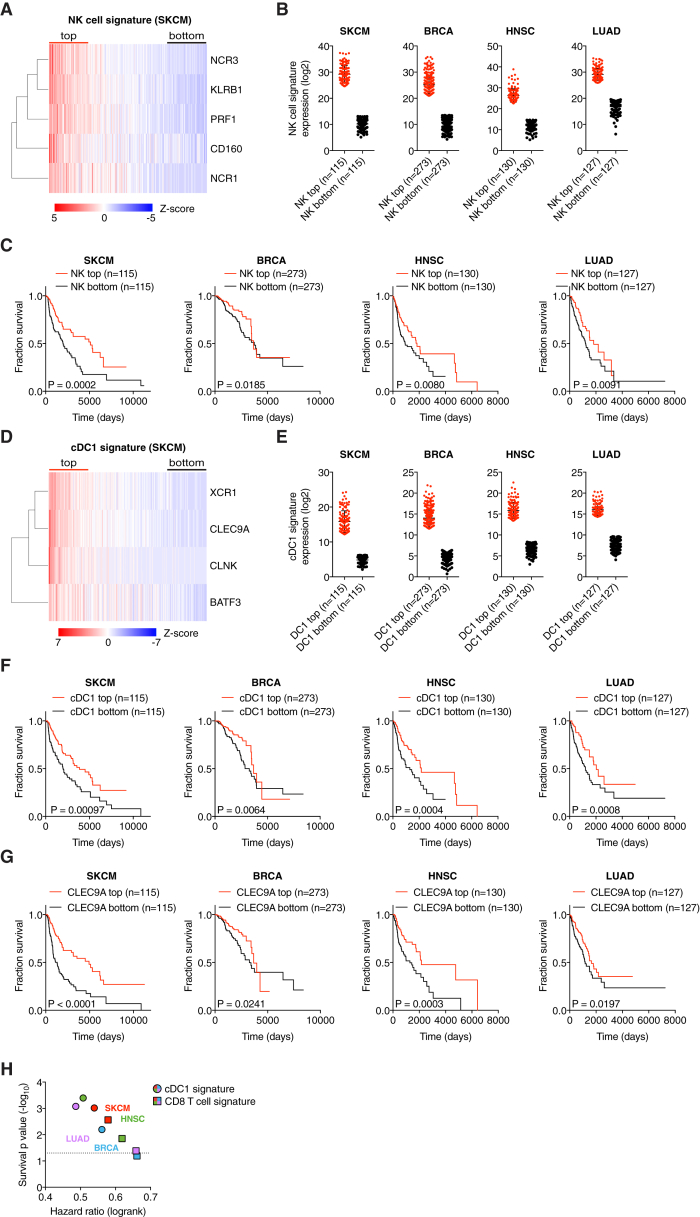
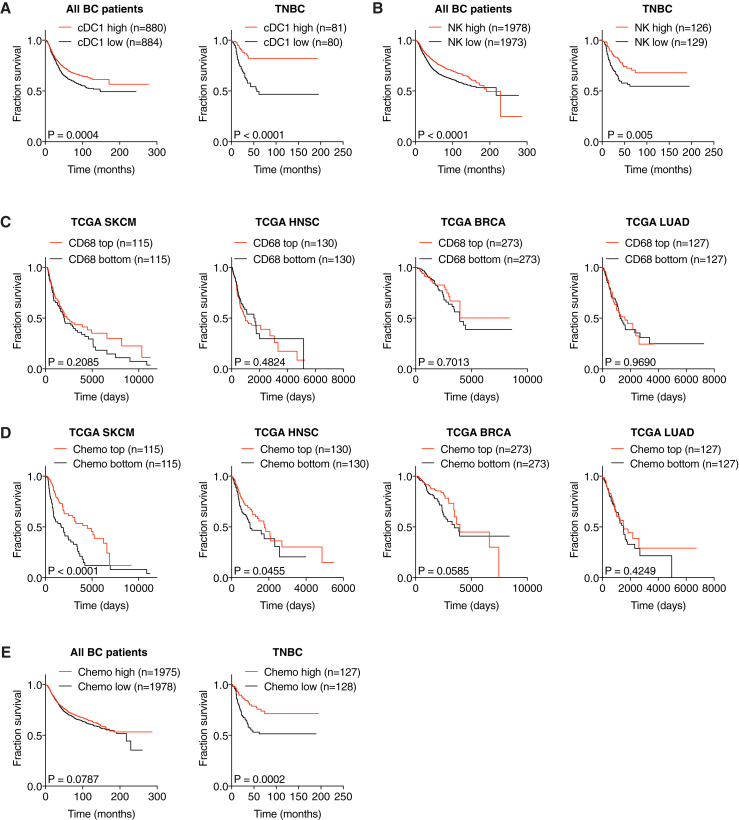
Conventional type 1 dendritic cells (cDC1) are critical for antitumor immunity, and their abundance within tumors is associated with immune-mediated rejection and the success of immunotherapy. Here, we show that cDC1 accumulation in mouse tumors often depends on natural killer (NK) cells that produce the cDC1 chemoattractants CCL5 and XCL1. Similarly, in human cancers, intratumoral CCL5, XCL1, and XCL2 transcripts closely correlate with gene signatures of both NK cells and cDC1 and are associated with increased overall patient survival. Notably, tumor production of prostaglandin E2 (PGE2) leads to evasion of the NK cell-cDC1 axis in part by impairing NK cell viability and chemokine production, as well as by causing downregulation of chemokine receptor expression in cDC1. Our findings reveal a cellular and molecular checkpoint for intratumoral cDC1 recruitment that is targeted by tumor-derived PGE2 for immune evasion and that could be exploited for cancer therapy.

Keywords: cancer immunotherapy; dendritic cells; immune evasion; tumor immune control; tumor microenvironment.


Figures

None
Graphical abstract
Figure 1
Figure 1
cDC1 Accumulate in the TME of PGE2-Deficient Tumors (A and B) Wild-type (WT) mice were injected s.c. with 2 × 106Ptgs1/Ptgs2−/− BRAFV600E cells and tumor-infiltrating immune cells were analyzed 4 days later by flow cytometry. Plots representative of 2-3 experiments are shown. (A) Gating strategy to identify intratumoral cDC1. Numbers represent % cells within depicted gate. (B) Analysis of intratumoral cDC1 and CD103CD11c+MHCII+ cells for cDC1 markers. (C) Quantification of tumor mass and intratumoral immune cells 4 days after inoculation of WT mice with 2 × 106 control or Ptgs1/Ptgs2−/− BRAFV600E melanoma cells. Data are pooled from 4 independent experiments with 4–6 mice per group and depicted as mean ± SEM; each circle represents an individual tumor. (D) Representative sections of control and Ptgs1/Ptgs2−/− BRAFV600E tumors. Arrows indicate multicellular clusters of cDC1. Scale bar, 50 μm. (E) Surface reconstruction of images from (D) showing the localization of cDC1 versus CD103MHCII+ cells. (F) Distance analyses based on (E). Data represent quantification across 8 images from 6 tumors. (G) WT or Batf3−/− mice were inoculated with 2 × 105 control or Ptgs1/Ptgs2−/− BRAFV600E cells and tumor growth was analyzed over time. Data are represented as mean ± SEM and are from one of two independent experiments with 3–5 mice per group. (H and I) WT and Batf3−/− mice were injected s.c. with 2 × 106 control or Ptgs1/Ptgs2−/− BRAFV600E cells. 12 days later, T cells were quantified (H) and stained for intracellular GzmB (I). In (C) and (F)–(I): n.s., non-significant, p < 0.05, ∗∗p < 0.0, ∗∗∗p < 0.001. See also Figure S1.
Figure S1
Figure S1
Accumulation and Positioning of cDC1 in COX-Deficient Tumors, Related to Figure 1 WT mice were injected s.c. with 2x10⁶ 4T1 breast cancer cells, CT26 colorectal cancer cells or BRAFV600E melanoma cells. Tumors were excised 4 days later. (A and B) Immunofluorescence images of parental 4T1 or Ptgs1/Ptgs2−/− 4T1 tumors (A) or WT CT26 or Ptgs2−/− CT26 tumors (B). Upper panels show original images, lower panels show visualization of CD103+ cDC1 localization by surface reconstruction. Scale bar 100μm. Images are representative of individual tumors from 5-6 mice in two independent experiments. The dashed lines indicate the tumor margin, arrows indicate multicellular clusters of cDC1. (C and D) Quantification of intratumoral cDC1 in immunofluorescent images of 4T1 tumors (C) or CT26 tumors (D). Each circle represents data from one individual tumor. Data are mean ± SEM and were pooled from two independent experiments. (E) Distance analysis based on (A). (F) Distance analysis based on (B). Line indicates mean value, ∗∗p < 0.01, ∗∗∗p < 0.001.
Figure 2
Figure 2
Intratumoral cDC1 Accumulation Depends on NK Cells (A) Quantification of tumor-infiltrating lymphocytes in control or Ptgs1/Ptgs2−/− BRAFV600E tumors (day 4). (B) Image of a Ptgs1/Ptgs2−/− BRAFV600E tumor. Insets show colocalization of CD103+ cDC1 and NK1.1+ cells in multicellular clusters. Scale bar, 50 μm. The dashed line indicates the tumor margin. Data are representative of 6 tumors from two experiments. (C) Distance analysis based on (B). Data represent quantification across 6 images from 6 tumors. (D) Image of a tumor from a MMTV-PyMT mouse. Insets show colocalization of CD103+ cDC1 and NK1.1+ cells. Scale bar, 100 μm. Data are representative of 4 independent experiments. (E) Distance analysis based on (D). Data represent quantification across 8 images from 4 tumors. (F and G) Quantification of cDC1 in control or Ptgs1/Ptgs2−/− BRAFV600E tumors 4 days after s.c. inoculation of 2 × 106 tumor cells into WT mice, Rag1−/− mice, or Rag2−/−Il2rg−/− mice with or without NK cell depletion. (H) Quantification of NK cells in control or Ptgs1/Ptgs2−/− BRAFV600E tumors 4 days after inoculation of WT mice or Batf3−/− mice. (I) Effect of NK cell depletion on the growth of Ptgs1/Ptgs2−/− BRAFV600E tumors in WT or Batf3−/− mice. Data shown in (A) and (F)–(I) are pooled from at least two independent experiments with 4–6 mice per group and represented as mean ± SEM; (A), (C), and (E–I): n.s., non-significant, p < 0.05, ∗∗p < 0.01, ∗∗∗p < 0.001. See also Figure S2.
Figure S2
Figure S2
Intratumoral cDC1 Accumulation Depends on NK Cells, Related to Figure 2 (A) Quantification of intratumoral NK cells over time. Each circle represents data for one single BRAFV600E tumor from a group of 4-6 tumors per type and time point. (B) Flow cytometric analysis of intratumoral lymphocytes in a Ptgs1/Ptgs2−/− BRAFV600E tumor. Data are representative of three independent experiments. (C) Frequency distribution showing the distance of cDC1 to NK1.1+ cells within an immunofluorescence image of a Ptgs1/Ptgs2−/− BRAFV600E tumor. (D) Quantification of intratumoral NK cells after NK cell depletion in the indicated mice given control or Ptgs1/Ptgs2−/− BRAFV600E tumors. (E) Correlation of total cDC1 numbers and tumor mass in Ptgs1/Ptgs2−/− BRAFV600E tumors in WT mice or WT mice that were depleted of NK cells prior to tumor cell inoculation. (F) Visualization of CD103+ cDC1 localization after surface reconstruction from immunofluorescence images for Ptgs1/Ptgs2−/− BRAFV600E tumors 4 days after transplantation into WT mice, WT mice depleted of NK cells or Rag2−/−Il2rg−/−mice. Scale bar 100μm. Images are representative of individual tumors from 5-7 mice. Arrows indicate multicellular clusters of cDC1, tumor margins are indicated by dashed lines. (G) Quantification of intratumoral cDC1 in immunofluorescence images of Ptgs1/Ptgs2−/− BRAFV600E tumors transplanted into WT mice, WT mice that were depleted of NK cells prior to tumor cell inoculation or Rag2−/−Il2rg−/−mice. Each circle represents data for one individual tumor. (H) Distance analyses based on surface reconstruction shown in (F). (I) Quantification of total CD11c+MHCII+ cells after treatment as in (D). (J) Quantification of intratumoral CD8+ T cells after NK cell depletion. (K) Quantification of intratumoral CD4+ T cells after NK cell depletion. Analyses shown in B-K were performed 4 days after tumor cell inoculation. Data shown in A, D, E, G and I-K are pooled from at least two independent experiments and represented as mean of all mice in each group ± SEM n.s., non-significant, p < 0.05, ∗∗p < 0.01, ∗∗∗p < 0.001.
Figure 3
Figure 3
Intratumoral NK Cells Produce CCL5 and XCL1 (A) Selective expression of chemokines by mouse NK cells based on analysis of global gene expression data from splenic immune cells (dataset GSE15907). (B–G) WT mice were injected s.c. with 2 × 106 control or Ptgs1/Ptgs2−/− BRAFV600E cells and tumors were analyzed 4 days later. (B) Chemokine expression in tumor lysates determined by protein array. (C) Relative chemokine expression based on densitometric analysis of (B). (D and E) Measurement of (D) CCL5 protein or (E) Xcl1 mRNA levels in total tumor extracts. (F and G) Flow cytometric analysis of (F) intracellular CCL5 protein or (G) Xcl1 mRNA in immune cells. FMO, fluorescence minus one. (H–J) As for (B)–(G) but tumors were analyzed 12 days after implantation. (H) Intracellular CCL5 protein and Xcl1 mRNA levels in NK cells and T cells from a representative Ptgs1/Ptgs2−/− BRAFV600E tumor. (I and J) Quantification of intracellular CCL5 protein (I) or Xcl1 mRNA (J). (K–M) Analysis of CCL5 and Xcl1 production by immune cells in mammary tumors from female MMTV-PyMT mice. (K) Representative plots showing intracellular CCL5 protein and Xcl1 mRNA levels. (L and M) Quantification of intracellular CCL5 (L) and intracellular Xcl1 mRNA (M). Data in (B) and (C) are representative of three independent experiments, bar graphs in (C) depict mean signal from duplicate capture spots ± SD. Data in (D) and (E) are pooled from at least 2 experiments with 3–5 mice per group. In (F), (G), (I), (J), (L), and (M), data are from one of at least two experiments with 3 mice per group represented as mean of each group ± SEM (D–G, I, J, L, and M): n.s., non-significant, p < 0.05, ∗∗p < 0.01, ∗∗∗p < 0.001. See also Figure S3.
Figure S3
Figure S3
Chemokine Production by Intratumoral NK Cells Does Not Depend on CD103+ cDC1, Related to Figure 3 (A) Quantification of CCL5 protein levels in lysates from control or Ptgs1/Ptgs2−/− tumors 4 days after tumor cell inoculation of WT mice (tumor ex vivo) or in lysates from control or Ptgs1/Ptgs2−/− BRAFV600E cells cultured in vitro. (B and C) WT and Batf3−/− mice were injected s.c. with 2x10⁶ control or Ptgs1/Ptgs2−/− BRAFV600E cells. 4 days later, tumors were excised, lysed and analyzed for (B) CCL5 protein or (C) Xcl1 mRNA. Data are representative of two independent experiments with 3-5 tumors per group and shown as mean of each group of mice from one experiment ± SEM n.d., none detected.
Figure 4
Figure 4
NK Cells Are the Main Source of CCL5 and XCL1 in COX-Deficient Tumors (A and B) WT mice, WT mice depleted of NK cells, or Rag1−/− mice were injected s.c. with 2 × 106 control or Ptgs1/Ptgs2−/− BRAFV600E cells and analyzed 4 days later for CCL5 protein (A) and Xcl1 mRNA (B). (C and D) WT mice, Rag1−/− and Rag2−/−Il2rg−/− mice were injected s.c. with 2 × 106 control or Ptgs1/Ptgs2−/− BRAFV600E cells and analyzed 4 days later for CCL5 protein (C) and Xcl1 mRNA (D). (E–G) Splenic NK cells from WT mice were cultured with IL-2 and stimulated with plate-bound anti-NK1.1 for 16 hr in the presence or absence of the indicated concentrations of PGE2. Culture supernatants were analyzed for CCL5 (E) and XCL1 (F) proteins while NK cells were analyzed for survival by flow cytometric analysis with annexin V and propidium iodide (G). (H and I) NK cells isolated from Ptgs1/Ptgs2−/− BRAFV600E tumors were stimulated with plate-bound anti-NK1.1 for 16 hr in vitro in the presence or absence of the indicated concentration of PGE2. Culture supernatants were analyzed for CCL5 (H) and XCL1 (I) proteins. (J) Expression of TIM-3 and PD-1 on NK cells in BRAFV600E tumors at day 4 and day 12 after tumor transplantation. Data in (A)–(D) are pooled from at least two independent experiments with 3–5 mice per group and represented as mean per group ± SEM. Data from one out of at least two experiments is shown in (E)–(J). Error bars indicate mean of duplicate wells ± SD; (F): n.d., not detected. (A–D): n.s., non-significant, ∗∗∗p < 0.001. See also Figure S4.
Figure S4
Figure S4
Effect of IL-15 and IL-15:IL-15Rα on PGE2-Mediated Inhibition of NK Cell Function, Related to Figure 4 Splenic NK cells from WT mice were cultured for 16h with IL-2, IL-15 or IL-15:IL-15Rα complexes with our without anti-NK1.1 stimulation and in the presence or absence of the indicated concentrations of PGE2. (A) Analysis of NK cell survival by flow cytometric analysis with annexin V and propidium iodide. (B and C) Analysis of CCL5 (B) or XCL1 (C) accumulation in culture supernatants. Data shown in A are pooled from three independent experiments and represented as mean of each group across three experiments ± SEM. Data from one of two experiments are shown in B and C as mean of duplicate wells per group ± SD.
Figure 5
Figure 5
Recruitment of cDC1 into Tumors by XCL1 and CCL5 Promotes Tumor Immune Control (A) Migration of cDC1 toward CCL5 or XCL1. (B) cDC1 accumulation in Ptgs1/Ptgs2−/− BRAFV600E tumors in WT mice injected with anti-CCL5 and anti-XCL1 antibodies or the respective isotype-matched controls. (C) Quantification of intratumoral cDC1 4 days after s.c. injection of 2 × 106Ptgs1/Ptgs2−/− BRAFV600E cells expressing CCL5 or XCL1 or transduced with an empty vector (EMPTY). (D and E) Growth of the tumors in (C) after s.c. transplantation of 2 × 105 cells into (D) WT or (E) Batf3−/− mice. (F) Growth of 2 × 105 EMPTY or XCL1-expressing Ptgs1/Ptgs2−/− BRAFV600E cells in WT mice with or without NK cell depletion after s.c. transplantation. (G) Quantification of intratumoral cDC1 4 days after s.c. injection of 2 × 106 B16-OVA cells EMPTY or overexpressing CCL5 or XCL1 into WT mice. (H) Tumor growth following s.c. injection of 2 × 105 B16-OVA cells EMPTY or overexpressing CCL5 or XCL1. (I and J) Same as (G) and (H) but using Ptgs2−/− CT26 colorectal cancer cells. Data in (A) are from one of three independent experiments and are shown as mean of duplicate transwells ±SD. Pooled data from at least two experiments are shown in (B)–(J) and represented as mean of each group of mice ± SEM; (B–J): n.s., non-significant, p < 0.05, ∗∗p < 0.01, ∗∗∗p < 0.001. See also Figure S5.
Figure S5
Figure S5
cDC1 Function Is Inhibited by PGE2, Related to Figure 5 (A) Quantification of intratumoral cDC1 4 days after s.c. transplantation of 2x10⁶ COX-sufficient control BRAFV600E melanoma cells EMPTY or expressing CCL5 or XCL1. (B) Tumor growth of COX-sufficient control BRAFV600E melanoma cells EMPTY or expressing CCL5 or XCL1 after s.c. transplantation of 2x10⁵ cells into WT mice. (C and D) Same as (A-B) but using CT26 cancer cells. (E–I) CD103+ cDC1 from in vitro DC cultures were sorted by FACS and incubated for 16h with PGE2 (100ng/ml) or conditioned medium (CM) from COX-sufficient control BRAFV600E melanoma cells before testing in vitro migration toward (E) recombinant CCL5 or (F) recombinant XCL1. (G-H) Analysis of Xcr1 (G) or Ccr5 (H) mRNA by RT-PCR or XCR1 surface protein by flow cytometry after the incubation period . (J) Flow cytometric analysis of XCR1 surface expression on intratumoral cDC1 isolated from control or Ptgs1/Ptgs2−/− BRAFV600E tumors. Pooled data from at least two independent experiments are shown in A-D and G, H and depicted as mean of all mice per group ± SEM. Representative data from one of at least three independent experiments are shown in E, F, I and J and depicted as mean per duplicate wells or mice per group from one experiment ± SD.
Figure 6
Figure 6
Cross Correlation of Gene Signatures for NK Cells, cDC1, CCL5, XCL1, and XCL2 in Human Cancer (A) Analysis of CCL5, XCL1, and XCL2 expression in 38 human hematopoietic cell populations based on global gene expression data (dataset from GSE24759). (B) Heatmap showing Pearson correlation values calculated pairwise between XCL1, XCL2, and CCL5 transcript levels in human TCGA datasets for skin cutaneous melanoma (SKCM, n = 460), breast invasive carcinoma (BRCA, n = 1092), head and neck squamous cell carcinoma (HNSC, n = 518), and lung adenocarcinoma (LUAD, n = 506). (C) Correlation between signatures for chemokines and NK cells within TCGA datasets. (D) Identification of cDC1-specific genes in human DC subsets based on global gene expression data (dataset from GSE77671). (E) Correlation of gene signatures specific for cDC1 and NK cells in TCGA datasets. (F) Correlation of gene signatures for chemokines and cDC1 in TCGA datasets. (G) Heatmap showing the Pearson correlation coefficient for the indicated gene signatures in TCGA datasets. r, Pearson correlation coefficient (r); p, p value. See also Figure S6.
Figure S6
Figure S6
Expression of Gene Signatures for cDC1, NK cells, CD8 T Cells, and Chemokines in Human Cancer Patients, Related to Figure 6 (A) Scatterplots showing the correlation of transcript levels for XCL1 versus XCL2, CCL5 versus XCL2 and CCL5 versus XCL1 for all patients from the TCGA SKCM dataset. (B) Distribution of the sum expression of indicated signature genes for all patients from the TCGA datasets SKCM, ordered from high to low. (C–E) Scatterplots showing the correlation between gene signatures within patient cohorts from TCGA datasets. (C) Signatures for CD8 T cells and cDC1. (D) Signatures for CD8 T cells and NK cells. (E) Signatures for chemokines and CD8 T cells. Pearson correlation coefficient (r) and P value are shown throughout.
Figure 7
Figure 7
Gene Signatures of NK Cells and cDC1 Positively Correlate with Cancer Patient Survival (A) Heatmap showing the ordered, z-transformed expression values for NK cell-specific genes in melanoma patients. (B) Expression of NK cell signature genes for top and bottom quartiles of TCGA datasets. (C) Prognostic value of the NK cell signature for overall survival of human cancer patients comparing top and bottom quartiles. (D) Heatmap showing the ordered, z-transformed expression values for cDC1-specific genes in melanoma patients. (E) Expression of cDC1 signature genes for top and bottom quartiles of indicated TCGA datasets. (F and G) Prognostic value of the cDC1 gene signature (F) or of CLEC9A expression levels (G) for cancer patient overall survival comparing top and bottom quartiles. (H) Hazard ration comparison of the cDC1 and a CD8 T cell signature as an indicator of overall survival. The dotted line indicates a p value of 0.05. Data in (B) and (E) are represented as mean ± SD. p, p value; n, number of data points in the analysis. See also Figure S7 and Table S1.
Figure S7
Figure S7
Prognostic Value of Chemokine Expression for Overall Survival, Related to Figure 7 (A and B) Survival analyses of a human breast cancer patient cohort with associated gene expression data available at the KM plotter site (http://kmplot.com). All breast cancer patients from the dataset or a sub-group of patients diagnosed with triple-negative breast cancer (TNBC) were split into the top and bottom half for expression of signature genes and compared for overall survival. (A) Prognostic value of a cDC1 signature (CLNK, BATF3, XCR1) for all breast cancer patients (n = 1764) or TNBC patients (n = 161). Please note that CLEC9A transcript is absent in this particular dataset and cannot be included in the signature. (B) Prognostic value of a NK cell signature (NCR1, NCR3, KLRB1, CD160, PRF1) for all breast cancer patients (n = 3951) or patients with TNBC (n = 255). (C) Prognostic value of CD68 expression levels in tumor biopsies for overall survival of human cancer patients from TCGA datasets. (D and E) Prognostic value of a chemokine signature (XCL1, XCL2 and CCL5) for overall survival of human cancer patients from (D) TCGA datasets as indicated or (E) human breast cancer patients available at the KM plotter site. p = p value, n = number of data points in the analysis.

Comment in

References

    1. Alexandre Y.O., Ghilas S., Sanchez C., Le Bon A., Crozat K., Dalod M. XCR1+ dendritic cells promote memory CD8+ T cell recall upon secondary infections with Listeria monocytogenes or certain viruses. J. Exp. Med. 2016;213:75–92. - PMC - PubMed
    1. Bachem A., Güttler S., Hartung E., Ebstein F., Schaefer M., Tannert A., Salama A., Movassaghi K., Opitz C., Mages H.W. Superior antigen cross-presentation and XCR1 expression define human CD11c+CD141+ cells as homologues of mouse CD8+ dendritic cells. J. Exp. Med. 2010;207:1273–1281. - PMC - PubMed
    1. Brewitz A., Eickhoff S., Dähling S., Quast T., Bedoui S., Kroczek R.A., Kurts C., Garbi N., Barchet W., Iannacone M. CD8+ T cells orchestrate pDC-XCR1+ dendritic cell spatial and functional cooperativity to optimize priming. Immunity. 2017;46:205–219. - PMC - PubMed
    1. Broz M.L., Binnewies M., Boldajipour B., Nelson A.E., Pollack J.L., Erle D.J., Barczak A., Rosenblum M.D., Daud A., Barber D.L. Dissecting the tumor myeloid compartment reveals rare activating antigen-presenting cells critical for T cell immunity. Cancer Cell. 2014;26:638–652. - PMC - PubMed
    1. Chen J.H., Perry C.J., Tsui Y.-C., Staron M.M., Parish I.A., Dominguez C.X., Rosenberg D.W., Kaech S.M. Prostaglandin E2 and programmed cell death 1 signaling coordinately impair CTL function and survival during chronic viral infection. Nat. Med. 2015;21:327–334. - PMC - PubMed

Publication types

MeSH terms