. 2018 Feb 15;69(4):636-647.e7.
doi: 10.1016/j.molcel.2018.01.019. Epub 2018 Feb 8.

N6-Methyladenosine Guides mRNA Alternative Translation during Integrated Stress Response

Affiliations

N6-Methyladenosine Guides mRNA Alternative Translation during Integrated Stress Response

Jun Zhou et al. Mol Cell. .

Abstract

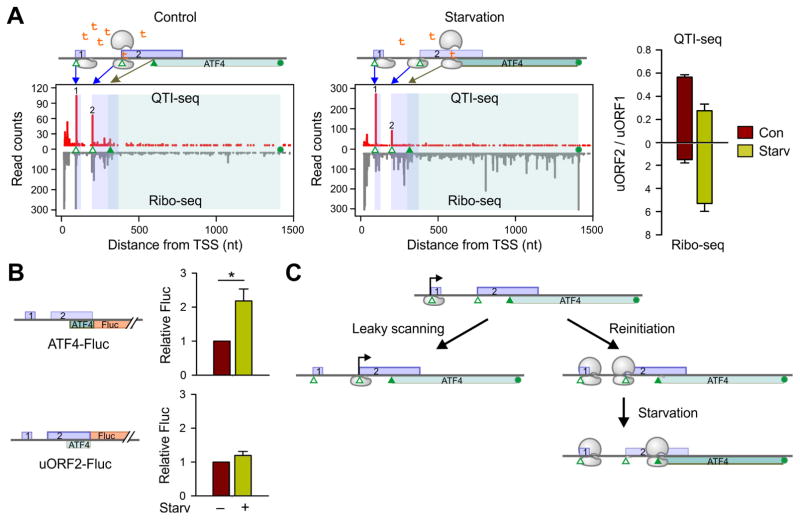
The integrated stress response (ISR) facilitates cellular adaptation to stress conditions via the common target eIF2α. During ISR, the selective translation of stress-related mRNAs often relies on alternative mechanisms, such as leaky scanning or reinitiation, but the underlying mechanism remains incompletely understood. Here we report that, in response to amino acid starvation, the reinitiation of ATF4 is not only governed by the eIF2α signaling pathway, but is also subjected to regulation by mRNA methylation in the form of N6-methyladenosine (m6A). While depleting m6A demethylases represses ATF4 reinitiation, knocking down m6A methyltransferases promotes ATF4 translation. We demonstrate that m6A in the 5' UTR controls ribosome scanning and subsequent start codon selection. Global profiling of initiating ribosomes reveals widespread alternative translation events influenced by dynamic mRNA methylation. Consistently, Fto transgenic mice manifest enhanced ATF4 expression, highlighting the critical role of m6A in translational regulation of ISR at cellular and organismal levels.

Keywords: ATF4; FTO; QTI-seq; alternative translation; epitranscriptome; integrated stress response; m6A; reinitiation; ribosome scanning; start codon selection.


Figures

Figure 1
Figure 1. Starvation-Induced ATF4 Reinitiation with Sustained uORF2 Translation
(A) A delayed reinitiation model is shown for ATF4 translation in response to amino acid starvation (top panels). MEF cells with or without amino acid starvation were subject to QTI-seq and Ribo-seq. Reads mapped to Atf4 are presented in bar graphs. Green triangles denote TIS codons with the solid triangle as the aTIS. Right panel shows the quantification of uORF2 translation. Both Ribo-seq and QTI-seq reads mapped to uORF2 are normalized to uORF1. Error bars, mean ± s.e.m.; n = 3, biological replicates. (B) Illustration of ATF-Fluc and uORF2-Fluc reporters. MEF cells transfected with reporter plasmids were subjected to amino acid starvation for 6 hr, followed by luminometry. Fluc activities are normalized to Rluc. Error bars, mean ± s.e.m.; * p < 0.05, n = 3, biological replicates. (C) Schematic of uORF2 translation via leaky scanning (left panel) or reinitiation (right panel). Migrating 80S ribosomes are inaccessible to LTM binding, resulting in the failure of QTI-seq to capture initiating ribosomes during ATF4 reinitiation. See also Figure S1.
Figure 2
Figure 2. Quantitative Proteomics of ATF4 Translation
(A) Schematic of SILAC. MEF cells were cultured in “light” or “heavy” media for 5 passages before treating “heavy” cells with amino acid starvation for 2 hr. Atf4 mRNA and associated proteins were purified by a biotinylated probe followed by mass spectrometry. (B) Relative ratio of Atf4 mRNA-associated 60S and 40S ribosomal proteins before and after amino acid starvation. Two biological replicates are shown. (C) A scatter plot shows Atf4 mRNA-associated proteins before and after amino acid starvation. The original peptide score (log2) and starvation-induced fold changes are shown in the x-axis and the y-axis, respectively. RNA-binding proteins (RBPs) are highlighted with ALKBH5 indicated. (D) Validation of Atf4 mRNA-associated ALKBH5 by immunoblotting using the same sample as (D). (E) Schematic of zero distance cross linking methodology. 4-Thiouridine (s4U)-labelled RNAs were crosslinked to directly associated proteins using 365 nm UV. Gapdh or Atf4 mRNAs were purified by biotinylated probes followed by immunoblotting. See also Figure S2.
Figure 3
Figure 3. mRNA Methylation Influences ATF4 Translation
(A) MEF cells with or without ALKBH5 knockdown were subject to amino acid starvation followed by immunoblotting. The right panel shows the relative ATF4 levels quantified by densitometry and normalized to β-actin. (B) MEF cells with or without FTO knockdown were subject to amino acid starvation followed by immunoblotting. The right panel shows the relative ATF4 levels quantified by densitometry and normalized to β-actin. (C) MEF cells with or without METTL3 knockdown were subject to amino acid starvation followed by immunoblotting. The right panel shows the relative ATF4 levels quantified by densitometry and normalized to β-actin. (D) MEF cells with or without METTL14 knockdown were subject to amino acid starvation followed by immunoblotting. The right panel shows the relative ATF4 levels quantified by densitometry and normalized to β-actin. From (A) to (D): Error bars, mean ± s.e.m.; n = 3, biological replicates. * p < 0.05.
Figure 4
Figure 4. uORF2 Methylation Influences ATF4 Translation
(A) MEF cells with or without amino acid starvation were subject to m6A-seq. Reads mapped to Atf4 are presented in line graphs. Atf4 uORF structure is shown above with m6A consensus sequence highlighted. Red arrow indicates the corresponding m6A peak. (B) MEF cells with or without ALKBH5 knockdown were subject to m6A-seq. Reads mapped to Atf4 are presented in line graphs. Atf4 uORF structure is shown above with m6A consensus sequence highlighted. Red arrow indicates the corresponding m6A peak. (C) Site-specific detection of m6A in Atf4 uORF2. Autoradiography shows primer extended products of endogenous Atf4 with or without amino acid starvation. Lower panel shows the Atf4 input determined by semi RT-PCR and the total mRNA stained by ethidium bromide. (D) MEF cells with either ALKBH5 or METTL3 knockdown were transfected with reporter plasmids encoding ATF4-Fluc or ATF4(A225G)-Fluc. After amino acid starvation for 6 h, Fluc activities were measured by luminometry. Error bars, mean ± s.e.m.; n = 3, biological replicates. * p < 0.05; ** p < 0.01. See also Figure S3 and S4.
Figure 5
Figure 5. uORF2 Methylation Influences Start Codon Selection
(A) Schematic of uORF2 translation via leaky scanning (left panel) or reinitiation (right panel) influenced by uORF2 methylation. (B) Toe-printing analysis using synthesized mRNAs with or without uORF2 mutation (A225G). Capped mRNAs were incubated in rabbit reticular lysates in the presence of cycloheximide. Expected positions corresponding to full length, uORF2 start codon, and the start codon of the main CDS are highlighted. (C) Toe-printing analysis as (B) using synthesized mRNAs incorporated with m6A.
Figure 6
Figure 6. m6A Guides Global Alternative Translation
(A) Metagene profiles of m6A distribution across the transcriptome of MEF cells with or without amino acid starvation. The top panel shows normalized mRNA regions, while the bottom panel shows the distance around start and stop codons. (B) Heat map of fold changes of aTIS density and local m6A levels (between −20 and + 60 nt) in response to amino acid starvation. Transcripts with or without uTIS are separated followed by hierarchical clustering. (C) A representative example (Copb2) of genes showing coordinated changes of aTIS density and downstream m6A levels in response to amino acid starvation. (D) uTIS codons identified by QTI-seq under the normal growth condition are grouped based on positive or negative m6A signals. Relative uTIS densities of individual TIS codons are plotted in a box plot. P values (Wilcoxon test) are shown above each boxes. (E) A representative example (Gadd45g) of genes showing decreased uTIS density and increased aTIS density as a result of changed m6A levels in response to amino acid starvation.
Figure 7
Figure 7. Alternative Translation in Liver-Specific Fto Transgenic Mice
(A) Metagene profiles of m6A distribution across the transcriptome of liver lysates derived from wild type or FtoAlb-Tg mice under well-fed (top panel) or overnight fasting (bottom panel). (B) Immunoblotting of liver lysates derived from wild type or FtoAlb-Tg mice under well-fed (top panel) or overnight fasting (bottom panel). The right panel shows the relative Atf4 mRNA levels obtained by qPCR, as well as ATF4 protein levels quantified by densitometry and normalized to β-actin. Error bars, mean ± s.e.m.; n = 3, biological replicates. * p < 0.05. (C) Ribo-seq reads mapped to Atf4 of liver lysates derived from wild type or FtoAlb-Tg mice are presented in bar graphs. (D) Scatter plots showing the correlation of regional ribosome density (5′UTR vs. CDS) between wild type or FtoAlb-Tg mice under normal feeding (top panel) and overnight fasting (bottom panel). (E) Box plots showing changes of regional ribosome density (5′UTR vs. CDS) for transcripts with differential 5′UTR methylation in liver lysates derived from FtoAlb-Tg mice. Dec / Inc refer to mRNAs with relatively decreased / increased 5′UTR methylation, respectively. P values (Wilcoxon test) are shown above each boxes. See also Figure S5 – S7.

Comment in

References

    1. Alarcon CR, Goodarzi H, Lee H, Liu X, Tavazoie S, Tavazoie SF. HNRNPA2B1 Is a Mediator of m(6)A-Dependent Nuclear RNA Processing Events. Cell. 2015;162:1299–1308. - PMC - PubMed
    1. Ameri K, Harris AL. Activating transcription factor 4. Int J Biochem Cell Biol. 2008;40:14–21. - PubMed
    1. Baltz AG, Munschauer M, Schwanhausser B, Vasile A, Murakawa Y, Schueler M, Youngs N, Penfold-Brown D, Drew K, Milek M, et al. The mRNA-bound proteome and its global occupancy profile on protein-coding transcripts. Mol Cell. 2012;46:674–690. - PubMed
    1. Batista PJ, Molinie B, Wang J, Qu K, Zhang J, Li L, Bouley DM, Lujan E, Haddad B, Daneshvar K, et al. m(6)A RNA modification controls cell fate transition in mammalian embryonic stem cells. Cell Stem Cell. 2014;15:707–719. - PMC - PubMed
    1. Bokar JA, Shambaugh ME, Polayes D, Matera AG, Rottman FM. Purification and cDNA cloning of the AdoMet-binding subunit of the human mRNA (N6-adenosine)-methyltransferase. RNA. 1997;3:1233–1247. - PMC - PubMed

Publication types

MeSH terms