. 2018 Mar 13;10(3):822-833.
doi: 10.1016/j.stemcr.2018.01.012. Epub 2018 Feb 8.

Low Resting Membrane Potential and Low Inward Rectifier Potassium Currents Are Not Inherent Features of hiPSC-Derived Cardiomyocytes

Affiliations

Low Resting Membrane Potential and Low Inward Rectifier Potassium Currents Are Not Inherent Features of hiPSC-Derived Cardiomyocytes

András Horváth et al. Stem Cell Reports. .

Abstract

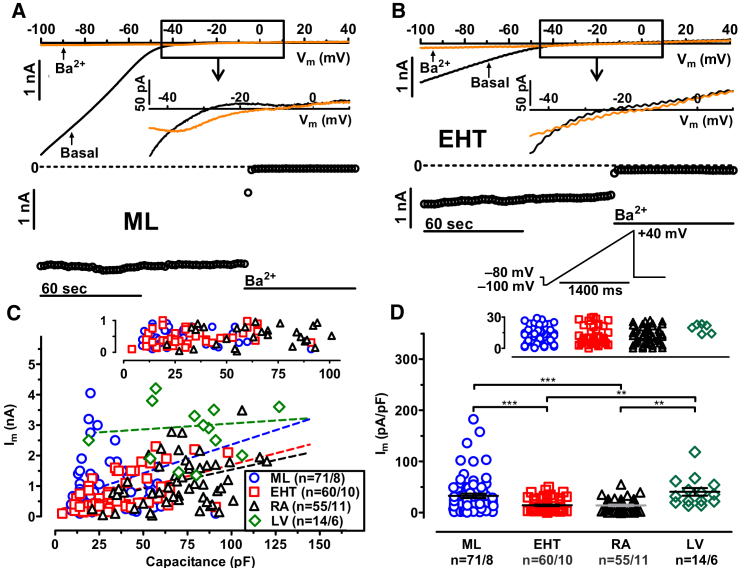
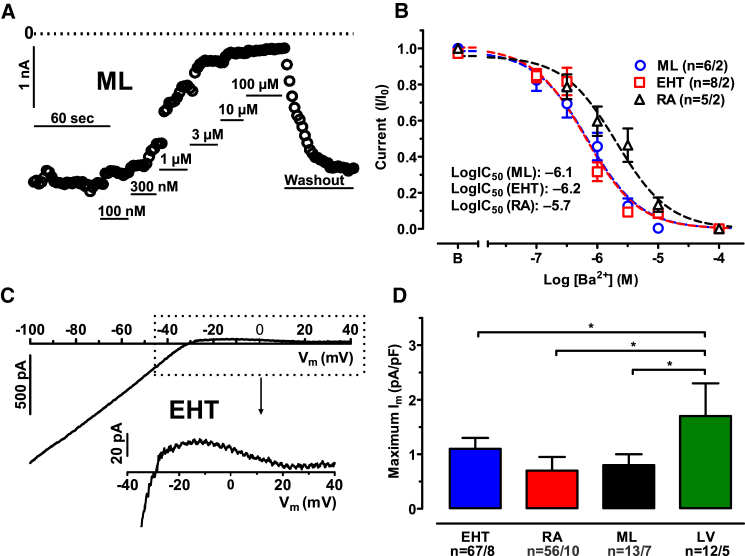
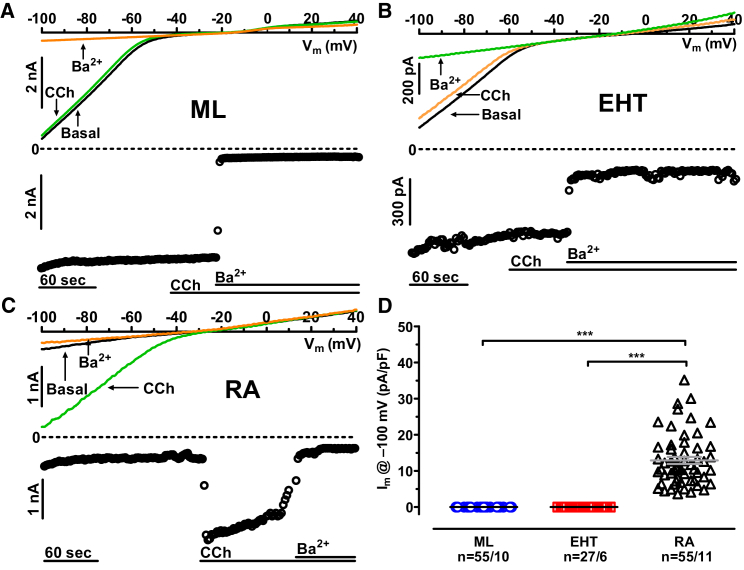
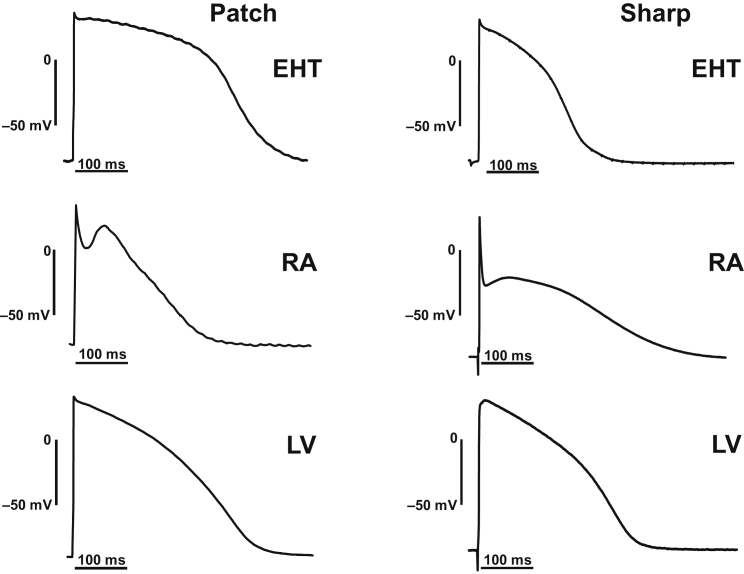
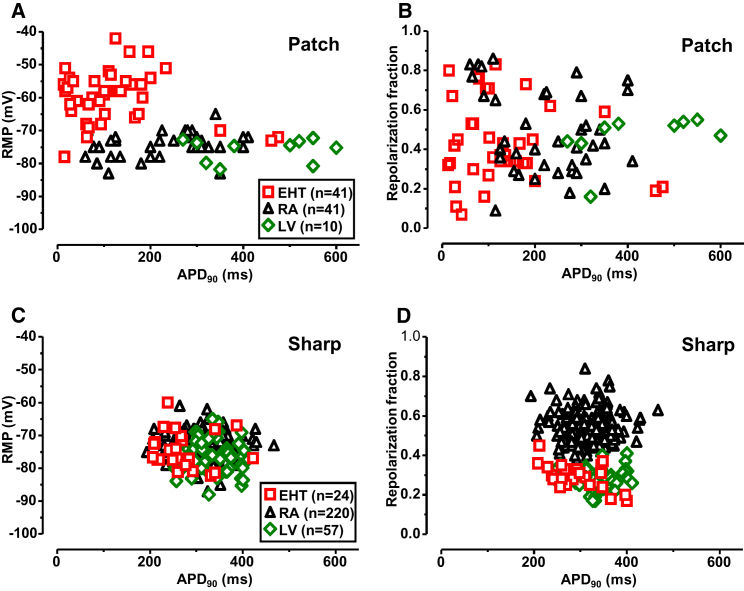
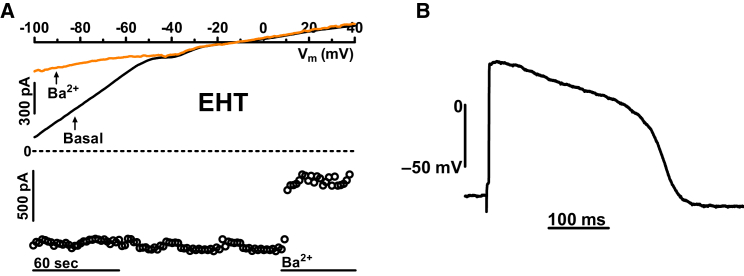
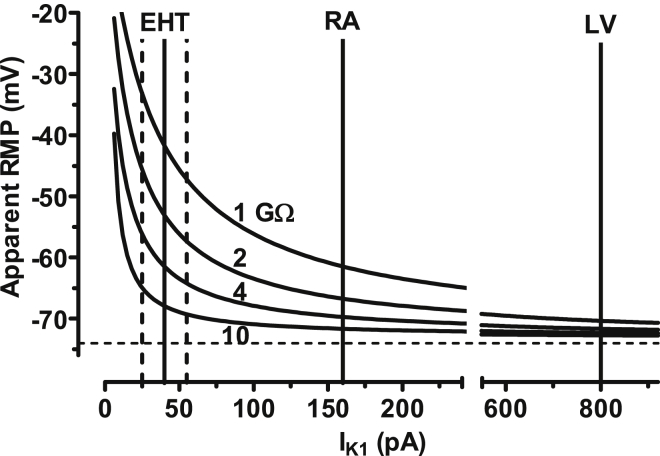
Human induced pluripotent stem cell (hiPSC) cardiomyocytes (CMs) show less negative resting membrane potential (RMP), which is attributed to small inward rectifier currents (IK1). Here, IK1 was measured in hiPSC-CMs (proprietary and commercial cell line) cultured as monolayer (ML) or 3D engineered heart tissue (EHT) and, for direct comparison, in CMs from human right atrial (RA) and left ventricular (LV) tissue. RMP was measured in isolated cells and intact tissues. IK1 density in ML- and EHT-CMs from the proprietary line was similar to LV and RA, respectively. IK1 density in EHT-CMs from the commercial line was 2-fold smaller than in the proprietary line. RMP in EHT of both lines was similar to RA and LV. Repolarization fraction and IK,ACh response discriminated best between RA and LV and indicated predominantly ventricular phenotype in hiPSC-CMs/EHT. The data indicate that IK1 is not necessarily low in hiPSC-CMs, and technical issues may underlie low RMP in hiPSC-CMs.

Keywords: I(K,ACh); I(K1); action potential duration; engineered heart tissue; human atrium; human induced pluripotent stem cell-derived cardiomyocytes; human ventricle; inward rectifier K(+) current; repolarization fraction; resting membrane potential.


Figures

Figure 1
Figure 1
Cell Size and Inward Rectifier Potassium Current in hiPSC-CMs from ML, EHT, RA, and LV (A and B) Original traces of inward rectifier currents (IK1) and time courses of current at −100 mV in hiPSC-CMs obtained from ML and EHT exposed to 1 mM Ba2+. Outward component of IK1 and voltage protocol is given as inset in (B). (C) Ba2+-sensitive IK1 current amplitudes measured at −100 mV plotted against cell capacitance; dotted lines indicate linear regression fit (R2 values were 0.1 for ML, 0.28 for EHT, 0.04 for iCell-EHT, 0.15 for RA, and 0.007 for LV). The upper scale shows data points with lower current amplitude. (D) Individual data points and respective mean values ± SEM for Ba2+-sensitive IK1 current densities measured at −100 mV in hiPSC-CMs from ML, EHT, and in CMs from RA and LV. The upper scale shows data points with lower current density. ∗∗p < 0.01, ∗∗∗p < 0.001 (one-way ANOVA followed by Bonferroni test). n/n, number of experiments/number of isolations in hiPSC-CMs and number of experiments/number of patients in RA and LV.
Figure 2
Figure 2
Ba2+ Sensitivity and Outward Component of IK1 in hiPSC-CMs and Human Adult CMs (A) Time course of inward currents measured at −100 mV in a hiPSC-CMs from ML exposed to increasing concentrations of Ba2+. (B) Concentration-response curves for Ba2+ on inward current at −100 mV in hiPSC-CMs from ML, EHT, and in CMs from RA. Mean values ± SEM. (C) Ba2+-sensitive current trace from hiPSC-CMs from ML. Outward component of current given on an extended scale at the bottom. (D) Mean values ± SEM of maximum outward peak currents in hiPSC-CMs from ML, EHT, and in CMs from RA and LV. p < 0.05 (one-way ANOVA followed by Bonferroni test) n/n = number of experiment/number of isolations in hiPSC-CMs and number of experiment/number of patients in RA and LV.
Figure 3
Figure 3
Lack of Carbachol Effect on Inward Rectifiers in hiPSC-CMs (A and B) Original traces of inward rectifier currents and time courses of current at −100 mV in hiPSC-CMs obtained from ML and EHT exposed to carbachol ([CCh], 2 μM). (C) Effect of CCh (2 μM) on IK,ACh in CMs from RA. (D) CCh effects expressed as absolute current change in response to CCh (2 μM) in ML, EHT, and in CMs from RA. Individual data points and mean values ± SEM. LV ∗∗∗p < 0.001 (one-way ANOVA followed by Bonferroni test). n/n = number of experiment/number of isolations in hiPSC-CMs and number of experiment/number of patients in RA.
Figure 4
Figure 4
Original AP Recordings Taken from EHT, RA, and LV Action potential recorded by patch-clamp (left) and sharp microelectrode (right) techniques. The patch-clamp recordings were measured from isolated CMs, while the sharp microelectrode recordings were measured from intact muscle preparations.
Figure 5
Figure 5
Individual Distribution of APD90, RMP, and Repolarization Fraction in EHT, RA, and LV (A and C) Individual data points of APD90 plotted versus respective RMP values measured by patch clamping of isolated CMs from EHT, RA, and LV (A) and by sharp microelectrodes in intact tissues from EHT, RA, and LV (C). (B and D) Individual data points of repolarization fraction versus APD90 in isolated CMs: from EHT, RA, and LV (B); and in intact tissues: EHT, RA, and LV (D).
Figure 6
Figure 6
Inward Rectifier Potassium Current and Action Potential in hiPSC-CMs from iCell-EHT (A) Original traces of inward rectifier currents (IK1) and time courses of current at −100 mV in hiPSC-CMs obtained from iCell-EHT exposed to 1 mM Ba2+. (B) Action potential recorded from iCell-EHT by sharp microelectrode technique. The recordings were measured from intact EHT preparations at 37°C.
Figure 7
Figure 7
Influence of Seal Resistance and Absolute IK1 Amplitude on Apparent RMP in Patch-Clamp Experiments Curves give calculated apparent RMP as a function of absolute IK1 amplitudes and seal resistance. It is assumed that inward current amplitudes are determined by IK1 only. True RMP was assumed to be −73 mV, as indicated by the dotted horizontal line. Vertical lines indicate absolute IK1 amplitudes at −100 mV. Dotted vertical lines illustrate 95% CI of IK1 measured in EHT. The apparent RMP was calculated by the equation VcM = VmM + VmM RM/Rseal. Please note data for EHT are taken from experiments independent from those presented in Figure 1 (numbers given in the Discussion). Data for RA and LV are taken from the literature (Amos et al., 1996). Numbers near the fit curves indicates seal resistance used for calculation. For details, see Discussion.

Comment in

References

    1. Amos G.J., Wettwer E., Metzger F., Li Q., Himmel H.M., Ravens U. Differences between outward currents of human atrial and subepicardial ventricular myocytes. J. Physiol. 1996;491:31–50. - PMC - PubMed
    1. Anumonwo J.M., Lopatin A.N. Cardiac strong inward rectifier potassium channels. J. Mol. Cell. Cardiol. 2010;48:45–54. - PMC - PubMed
    1. Burridge P.W., Keller G., Gold J.D., Wu J.C. Review production of de novo cardiomyocytes: human pluripotent stem cell differentiation and direct reprogramming. Cell Stem Cell. 2011;10:16–28. - PMC - PubMed
    1. Chandler N.J., Greener I.D., Tellez J.O., Inada S., Musa H., Molenaar P., DiFrancesco D., Baruscotti M., Longhi R., Anderson R.H. Molecular architecture of the human sinus node insights into the function of the cardiac pacemaker. Circulation. 2009;119:1562–1575. - PubMed
    1. Chen Z., Xian W., Bellin M., Dorn T., Tian Q., Goedel A., Dreizehnter L., Schneider C.M., Ward-van Oostwaard D., Ng J.K.M. Subtype-specific promoter-driven action potential imaging for precise disease modelling and drug testing in hiPSC-derived cardiomyocytes. Eur. Heart J. 2017;38:292–301. - PMC - PubMed

Publication types

MeSH terms