. 2018 Apr;208(4):1397-1408.
doi: 10.1534/genetics.117.300360. Epub 2018 Feb 2.

Transformation of Summary Statistics from Linear Mixed Model Association on All-or-None Traits to Odds Ratio

Affiliations

Transformation of Summary Statistics from Linear Mixed Model Association on All-or-None Traits to Odds Ratio

Luke R Lloyd-Jones et al. Genetics. 2018 Apr.

Abstract

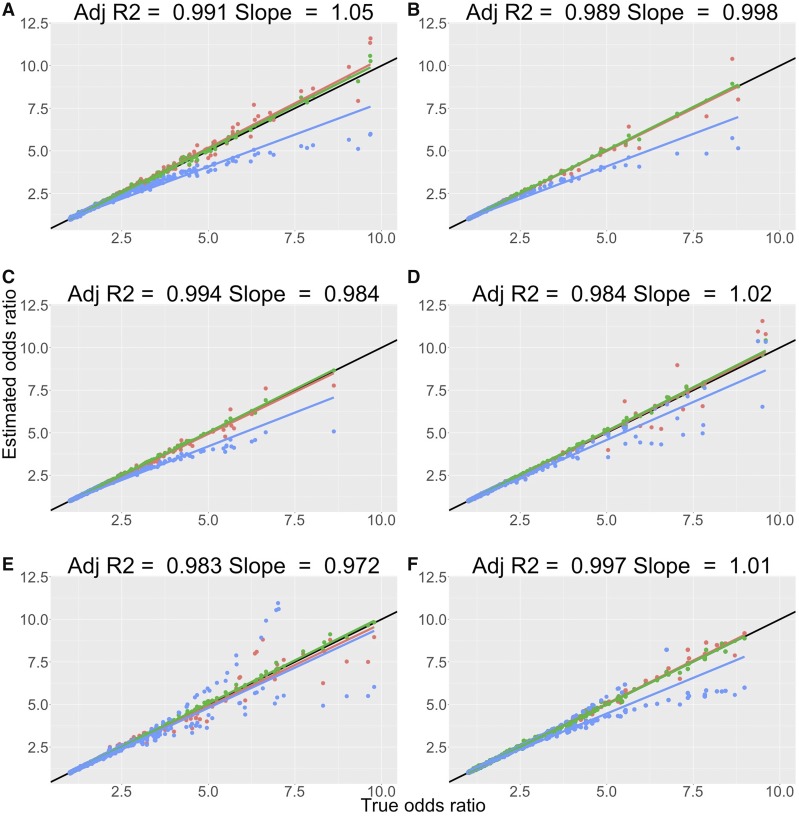
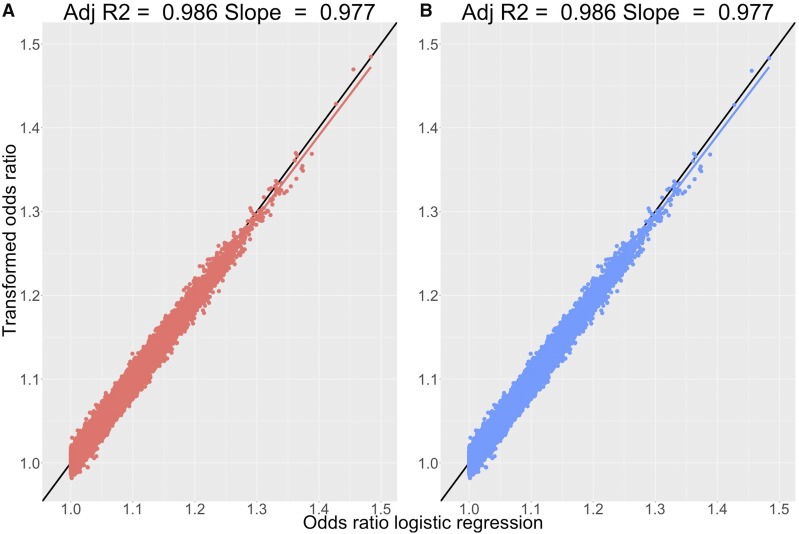
Genome-wide association studies (GWAS) have identified thousands of loci that are robustly associated with complex diseases. The use of linear mixed model (LMM) methodology for GWAS is becoming more prevalent due to its ability to control for population structure and cryptic relatedness and to increase power. The odds ratio (OR) is a common measure of the association of a disease with an exposure (e.g., a genetic variant) and is readably available from logistic regression. However, when the LMM is applied to all-or-none traits it provides estimates of genetic effects on the observed 0-1 scale, a different scale to that in logistic regression. This limits the comparability of results across studies, for example in a meta-analysis, and makes the interpretation of the magnitude of an effect from an LMM GWAS difficult. In this study, we derived transformations from the genetic effects estimated under the LMM to the OR that only rely on summary statistics. To test the proposed transformations, we used real genotypes from two large, publicly available data sets to simulate all-or-none phenotypes for a set of scenarios that differ in underlying model, disease prevalence, and heritability. Furthermore, we applied these transformations to GWAS summary statistics for type 2 diabetes generated from 108,042 individuals in the UK Biobank. In both simulation and real-data application, we observed very high concordance between the transformed OR from the LMM and either the simulated truth or estimates from logistic regression. The transformations derived and validated in this study improve the comparability of results from prospective and already performed LMM GWAS on complex diseases by providing a reliable transformation to a common comparative scale for the genetic effects.

Keywords: OR; complex diseases; genome-wide association studies; linear mixed models; summary statistics.


Figures

Figure 1
Figure 1
Performance of logistic regression and OR transformations from the linear model across simulation scenarios. Comparison of estimated ORs from logistic regression (green), transformed ORs from the LMM using OR2 (red), and the transformed ORs from the LMM using the equation from Pirinen et al. (2013) (blue), with true simulated ORs across logistic and liability threshold model simulation scenarios. (A) Results from the logistic model simulation. (B) Results from the simulation scenario with K=0.1, h2=0.5, ncontrols=5000, and ncases=5000 (k=0.5). (C) Results for the simulation scenario with K=0.05, h2=0.5, ncontrols=5000, and ncases=5000 (k=0.5). (D) Results for the simulation scenario with K=0.02, h2=0.5, ncontrols=8000, and ncases=2000 (k=0.2). (E) Results for the simulation scenario with K=0.01, h2=0.8, ncontrols=9000, and ncases=1000 (k=0.1). (F) Results from the rare variant simulation scenario with K=0.01, h2=0.05, ncontrols=8600, and ncases=1400 (k=0.14). All ORs have been reported for the allele that increases the odds of having the disease such that each point is greater than (1,1). Panels display comparisons from 5000 simulated true effects generated from the 50 replicates. All panels include the fitted linear regression line for each of the sets of points and the y=x line (black) for reference. Key statistics from the regression of the transformed ORs from OR2 are displayed at the top of each panel.
Figure 2
Figure 2
Performance of OR transformations for type 2 diabetes phenotype in the UK Biobank. Comparison of transformed ORs from OR2 and estimated ORs from logistic regression for type 2 diabetes in the UK Biobank. (A) Comparisons from 1,162,900 SNPs generated from logistic regression performed using the PLINK 1.9 software and a LMM implemented in the BOLT-LMM software and transformed using OR2. (B) Comparisons for the same set of results as A but with the transformation of Pirinen et al. (2013) used. Panels include the fitted regression line and y=x line (black) for reference with the key statistics of this regression displayed at the top of each panel.

References

    1. 1000 Genomes Project Consortium; Abecasis G. R., Auton A., Brooks L. D., DePristo M. A., Durbin R. M., et al. , 2012. An integrated map of genetic variation from 1,092 human genomes. Nature 491: 56–65. - PMC - PubMed
    1. Aldrich J. H., Nelson F. D., 1984. Linear Probability, Logit, and Probit Models, Vol. 45 Sage, London.
    1. Boraska V., Franklin C. S., Floyd J. A., Thornton L. M., Huckins L. M., et al. , 2014. A genome-wide association study of anorexia nervosa. Mol. Psychiatry 19: 1085–1094. - PMC - PubMed
    1. Chang B.-H., Lipsitz S., Waternaux C., 2000. Logistic regression in meta-analysis using aggregate data. J. Appl. Stat. 27: 411–424.
    1. Chang C., Chow C., Tellier L., Vattikuti S., Purcell S., et al. , 2015. Second-generation PLINK: rising to the challenge of larger and richer datasets. Gigascience 4: 7. - PMC - PubMed

Publication types

LinkOut - more resources