Review
. 2018 Jan;6(2):26.
doi: 10.21037/atm.2017.12.06.

Electrical impedance tomography

Affiliations
Review

Electrical impedance tomography

Beatriz Lobo et al. Ann Transl Med. 2018 Jan.

Abstract

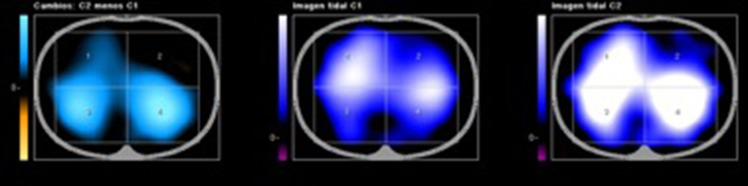
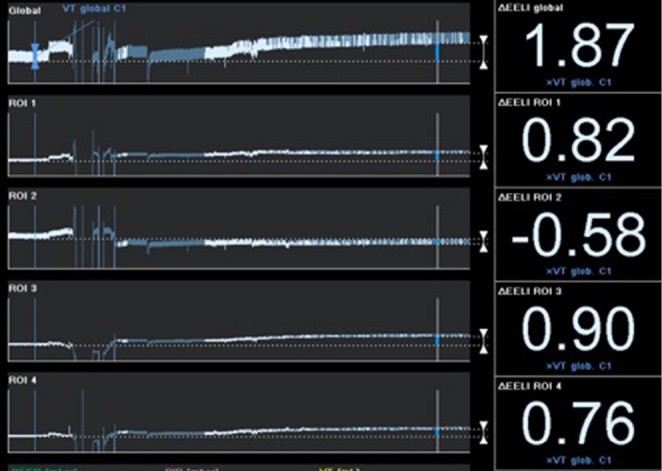
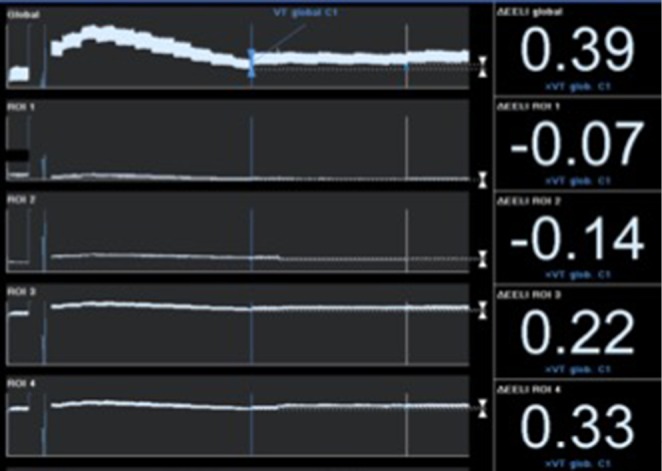
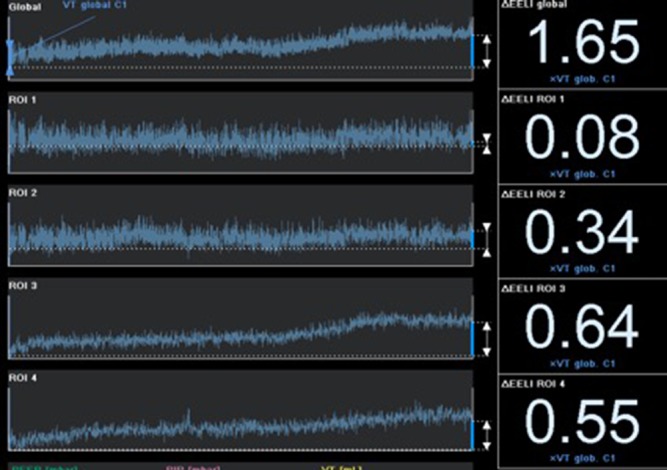
Continuous assessment of respiratory status is one of the cornerstones of modern intensive care unit (ICU) monitoring systems. Electrical impedance tomography (EIT), although with some constraints, may play the lead as a new diagnostic and guiding tool for an adequate optimization of mechanical ventilation in critically ill patients. EIT may assist in defining mechanical ventilation settings, assess distribution of tidal volume and of end-expiratory lung volume (EELV) and contribute to titrate positive end-expiratory pressure (PEEP)/tidal volume combinations. It may also quantify gains (recruitment) and losses (overdistention or derecruitment), granting a more realistic evaluation of different ventilator modes or recruitment maneuvers, and helping in the identification of responders and non-responders to such maneuvers. Moreover, EIT also contributes to the management of life-threatening lung diseases such as pneumothorax, and aids in guiding fluid management in the critical care setting. Lastly, assessment of cardiac function and lung perfusion through electrical impedance is on the way.

Keywords: Acute lung injury; critical care; electric impedance; physiologic monitoring; respiratory distress syndrome.


Conflict of interest statement

Conflicts of Interest: The authors have no conflicts of interest to declare.

Figures

Figure 1
Figure 1
EIT images showing impedance change after recruitment maneuver in patient suffering ARDS. Impedance change defined by colour coding scheme: impedance increase represented as blue-white, whilst impedance decrease represented as purple, and zero as black with a uniform color region around zero. Left side image, reference or basal EIT image; middle image, PEEP 5–10 cmH2O; right-side image, PEEP 10 cmH2O. EIT, electrical impedance tomography; ARDS, acute respiratory distress syndrome; PEEP, positive end-expiratory pressure.
Figure 2
Figure 2
PEEP titration after recruitment maneuver, demonstrating end-expiratory lung impedance changes stabilization (parallel to end-expiratory lung volume increase) after recruitment. PEEP, positive end-expiratory pressure.
Figure 3
Figure 3
EIT waveforms from a patient suffering septic shock due to peritonitis. The patient was initially ventilated on a pressure-control mode (settings: PEEP 10 mmH2O, FiO2 0.7 -PaO2/FiO2 ratio 190). A recruitment maneuver was carried out, in a 4 cmH2O steps every two minutes, until PEEP value reached 18 cmH2O. A decremental PEEP trial was performed afterwards (using a 2 cmH2O stepdown) until PEEP value reached 2 cmH2O (driving pressure was kept on 12 cmH2O). Tidal volume and oxygen saturation were monitored during incremental and decremental PEEP trials. Optimal PEEP was interpreted as the PEEP value with the best possible compliance value. After both trials, PEEP value was set on 6 cmH2O; no derecruitment was observed, and driving pressure was decreased to 10 cmH2O, witnessing a decrease in impedance change on anterior ROI and an increase on posterior ROI. EIT, electrical impedance tomography; PEEP, positive end-expiratory pressure.
Figure 4
Figure 4
EIT waveforms (global impedance and regions-of-interest waveforms represented as four quadrants: anterior right (ROI 1), anterior left (ROI 2), posterior right (ROI 3), posterior left (ROI 4). Increase in end-expiratory lung impedance variation (EELI), and therefore increase of functional residual capacity, after application of high flow nasal cannula, with a gas flow of 60 L/min. EIT, electrical impedance tomography.

References

    1. Theerawit P, Suthersan Y, Ball L, et al. Respiratory monitoring in adult intensive care unit. Expert Rev Respir Med 2017;11:6,453-68. 10.1080/17476348.2017.1325324 - DOI - PubMed
    1. Bellani G, Rouby JJ, Constantin JM, et al. Looking closer at acute respiratory distress syndrome: the role of advanced imaging techniques. Curr Opin Crit Care 2017;23:30-7. 10.1097/MCC.0000000000000380 - DOI - PubMed
    1. Chiumello D, Froio S, Bouhemad B, et al. Clinical review: Lung imaging in acute respiratory distress syndrome patients - an update. Crit Care 2013;17:243. 10.1186/cc13114 - DOI - PMC - PubMed
    1. Frerichs I. Electrical impedance tomography (EIT) in applications related to lung and ventilation: a review of experimental and clinical activities. Physiol. Meas 2000;21:R1-R21. 10.1088/0967-3334/21/2/201 - DOI - PubMed
    1. Frerichs I, Amato MBP, Van Kaam AH, et al. Chest electrical impedance tomography examination, data analysis, terminology, clinical use and recommendations: consensus statement of the TRanslational EIT developmeNt stuDy group. Thorax 2017;72:83- 93. 10.1136/thoraxjnl-2016-208357 - DOI - PMC - PubMed

LinkOut - more resources