. 2018 Mar 14;18(3):1962-1971.
doi: 10.1021/acs.nanolett.7b05354. Epub 2018 Feb 21.

Optical Voltage Sensing Using DNA Origami

Affiliations

Optical Voltage Sensing Using DNA Origami

Elisa A Hemmig et al. Nano Lett. .

Abstract

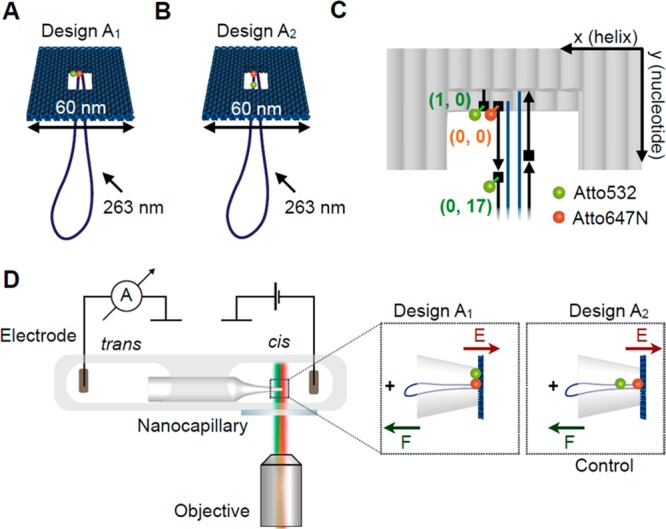
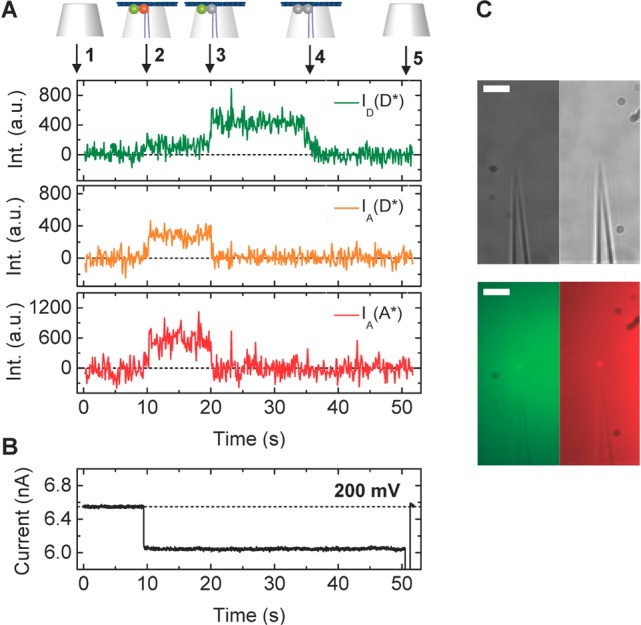
We explore the potential of DNA nanotechnology for developing novel optical voltage sensing nanodevices that convert a local change of electric potential into optical signals. As a proof-of-concept of the sensing mechanism, we assembled voltage responsive DNA origami structures labeled with a single pair of FRET dyes. The DNA structures were reversibly immobilized on a nanocapillary tip and underwent controlled structural changes upon application of an electric field. The applied field was monitored through a change in FRET efficiency. By exchanging the position of a single dye, we could tune the voltage sensitivity of our DNA origami structure, demonstrating the flexibility and versatility of our approach. The experimental studies were complemented by coarse-grained simulations that characterized voltage-dependent elastic deformation of the DNA nanostructures and the associated change in the distance between the FRET pair. Our work opens a novel pathway for determining the mechanical properties of DNA origami structures and highlights potential applications of dynamic DNA nanostructures as voltage sensors.

Keywords: DNA nanotechnology; coarse-grained simulations; nanocapillary; optical voltage measurements; single-molecule FRET.


Conflict of interest statement

The authors declare no competing financial interest.

Figures

Figure 1
Figure 1
(A) Illustration of the DNA origami plate with a double-stranded leash protruding from its central aperture. The plate is labeled with a FRET pair located at the edge of the central opening. The donor dye (ATTO532, green) is located closer to the edge of the plate while the acceptor is close to the leash in the center (ATTO647N, red). (B) Illustration of the control DNA origami plate with leash labeled with the same FRET pair. The green donor dye is now located on the leash. (C) Exact positions of the dyes in the central part of the two-layered DNA origami platform. Each gray rod represents a double helix and the scaffold strand in dark blue and staple strands in black. The ATTO dyes are located in three locations. We denote the positions using a DNA origami coordinate system (x, y) with x (helix number) and y (nucleotide number). The acceptor dye (ATTO647N) is defined as origin (0, 0) and is attached to the 5′-end (illustrated as rectangle) of the staple strand marking the starting point of the leash with respect to the plate. One donor dye (ATTO532) can be positioned at the 5′-end of a staple one helix away (1, 0) at the edge of the plate. Another donor dye (ATTO532) can be positioned at the 5′-end of the staple strand adjacent to the acceptor strand in a distance of 17 nucleotides from the acceptor dye along the leash (0, 17). (D) Schematic of experimental design. The core of the experimental setup consists of a nanocapillary connecting two electrolyte reservoirs. A voltage can be applied across the nanocapillary for ionic current recordings. The microfluidic chip containing the nanocapillary is placed directly above a fluorescence microscopy objective for synchronous single-molecule fluorescence imaging. (Insets) The DNA origami plate is trapped onto the nanocapillary tip upon applying a positive voltage.
Figure 2
Figure 2
Coarse-grained Brownian dynamics simulations of the voltage sensor. (A) (left) A typical simulation system. Electrostatic potential around the nanocapillary due to a 400 mV applied bias is superimposed with the initial configuration of the plate described using a low-resolution (five base pairs per bead) coarse-grained model. The configuration after 40 μs of simulation is shown to the right. Part of the nanocapillary is cut away for clarity. A high-resolution model of the plate (two beads per base pair) was used in subsequent simulations to measure the distance between the labeled nucleotides. The inset outlined in teal (left) shows the initial configuration of one such model under a 400 mV bias. The inset outlined in purple (right) shows the same model after a 500 ns simulation. Here, the side-by-side FRET pair of design A1 is shown, but similar simulations were used to estimate distances for both FRET pairs. (B) The distance between the labeled nucleotides during simulations of the high-resolution coarse-grained models at low (red) and high (dark red) applied biases for design A1. The circles indicate the states featured in panel A. (C) The distance between labeled nucleotides averaged over five simulations for each applied bias, relative to the distance obtained at 100 mV. The average distance between the nucleotides was obtained in each simulation, and the mean and standard error of the mean of the five distance values were calculated at each bias. The bars show the propagation of these errors for the difference of the distances. The lines show linear fits to the data.
Figure 3
Figure 3
(A) Representative examples of fluorescence intensity traces correlated with voltage and ionic current recordings for DNA origami plates with design A1. (A) (top) Trace annotations: 1, Bare nanocapillary. 2, DNA origami trapping. 3, Acceptor bleaching. 4, Donor bleaching. 5, DNA origami ejection. (bottom) Fluorescence intensity ID(D*), IA(D*), IA(A*) traces. (B) Ionic current trace, please note that during these measurements the voltage was held constant at 200 mV until t = 50 s when the structure is removed by applying a brief voltage fluctuation from + to −1000 mV. (C) Brightfield (top) and fluorescence (bottom) images of a FRET pair labeled origami immobilized at the capillary tip in the donor (left) and acceptor (right) emission channels. Scale bar: 5 μm.
Figure 4
Figure 4
Relative proximity ratio Esm* as a function of the voltage applied for design A1 (A) and for design A2 (B) from capillary experiments and coarse-grained simulations. Esm* is indicated relative to the value in the absence of an applied voltage i.e. E*(x mV) – E*(0 mV). For the unscaled proximity ratios, see Supplementary Figure S8. We used Ntot = 185 traces from 8 capillaries in design A1 and Ntot = 241 traces from 6 capillaries in design A2. Experimental zero voltage values were obtained by measuring the IA(D*) signal from origami structures immobilized on a coverslip using a BSA-biotin-neutravidin coating (outlined in Methods). The error bars correspond to the standard error of the mean. The simulated proximity ratio was calculated from the simulated distance between dye labeling sites, r using the expression relating FRET efficiency to distance E* = 1/⟨1 + (r/R0)6⟩ where R0 = 5.9 nm is the Förster radius.
Figure 5
Figure 5
Example trace (top) of the change in proximity ratio Esm* for a single trapped origami structure (measured and averaged proximity ratio for each voltage step) with steps in voltage (2 s, ΔV = 100 mV) from 100 to 400 mV (bottom) for (A) design A1 and (B) design A2.

References

    1. Das S.; Carnicer-Lombarte A.; Fawcett J. W.; Bora U. Bio-Inspired Nano Tools for Neuroscience. Prog. Neurobiol. 2016, 142, 1–22. 10.1016/j.pneurobio.2016.04.008. - DOI - PubMed
    1. Hasanzadeh M.; Shadjou N. Electrochemical Nanobiosensing in Whole Blood: Recent Advances. TrAC, Trends Anal. Chem. 2016, 80, 167–176. 10.1016/j.trac.2015.07.018. - DOI
    1. Jain K. K. Applications of Nanobiotechnology in Clinical Diagnostics. Clin. Chem. 2007, 53, 2002–2009. 10.1373/clinchem.2007.090795. - DOI - PubMed
    1. Cetin A. E.; Coskun A. F.; Galarreta B. C.; Huang M.; Herman D.; Ozcan A.; Altug H. Handheld High-Throughput Plasmonic Biosensor Using Computational on-Chip Imaging. Light: Sci. Appl. 2014, 3, e122.10.1038/lsa.2014.3. - DOI
    1. Sheehan P. E.; Whitman L. J. Detection Limits for Nanoscale Biosensors. Nano Lett. 2005, 5, 803–807. 10.1021/nl050298x. - DOI - PubMed

Publication types

MeSH terms