. 2018 Mar 7;38(10):2533-2550.
doi: 10.1523/JNEUROSCI.0669-17.2018. Epub 2018 Feb 5.

Regulation of Synapse Development by Vgat Deletion from ErbB4-Positive Interneurons

Affiliations

Regulation of Synapse Development by Vgat Deletion from ErbB4-Positive Interneurons

Thiri W Lin et al. J Neurosci. .

Abstract

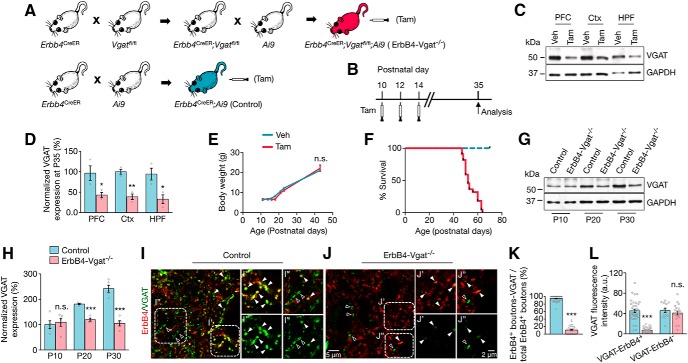
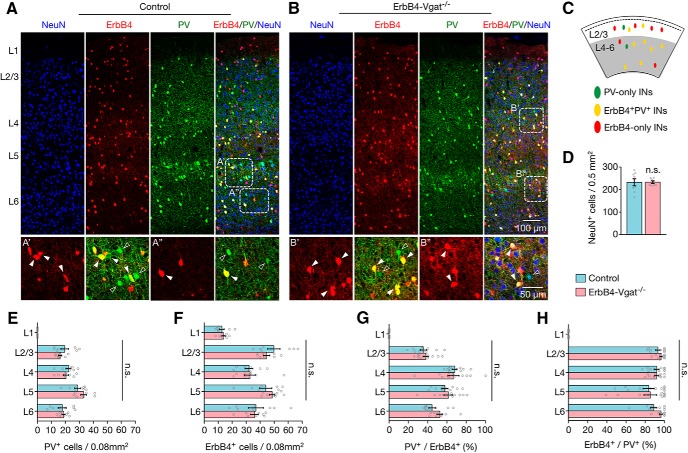
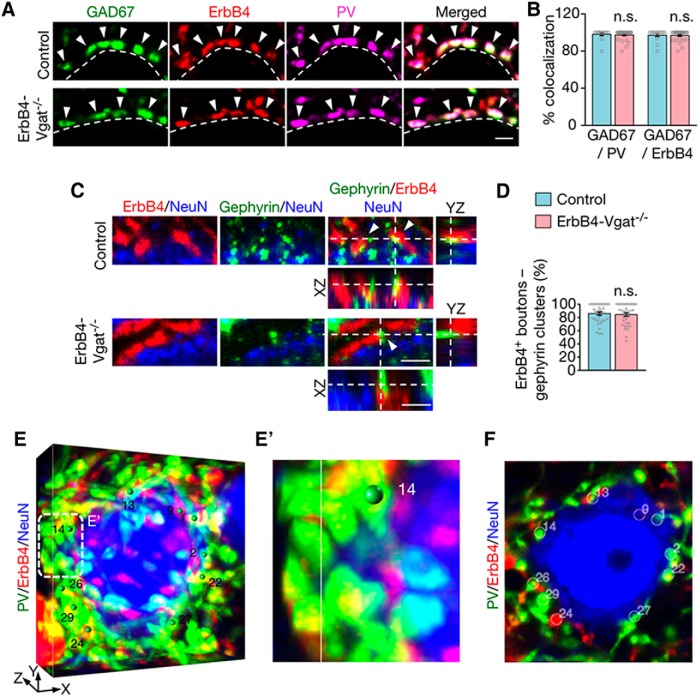
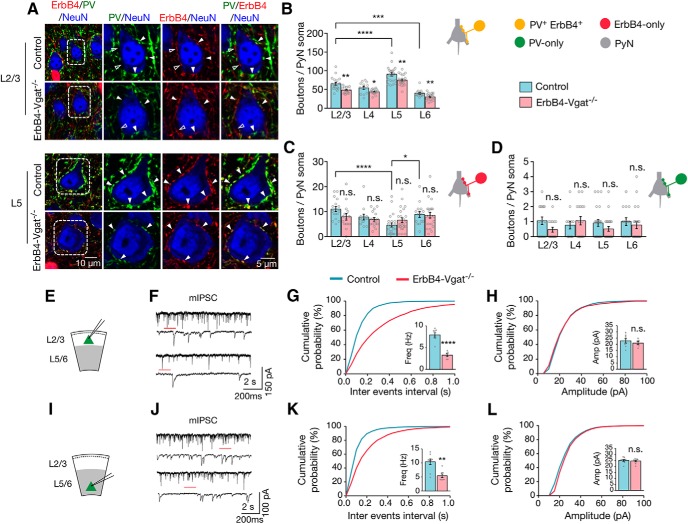
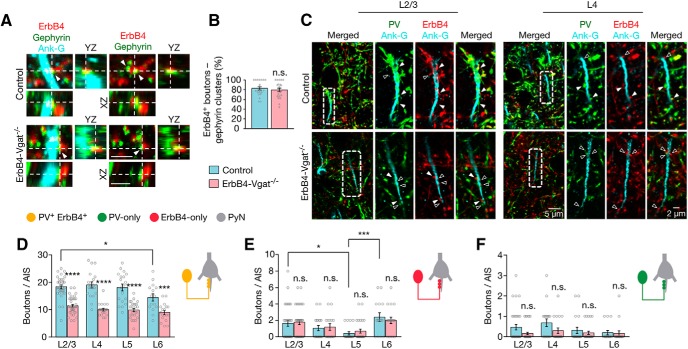
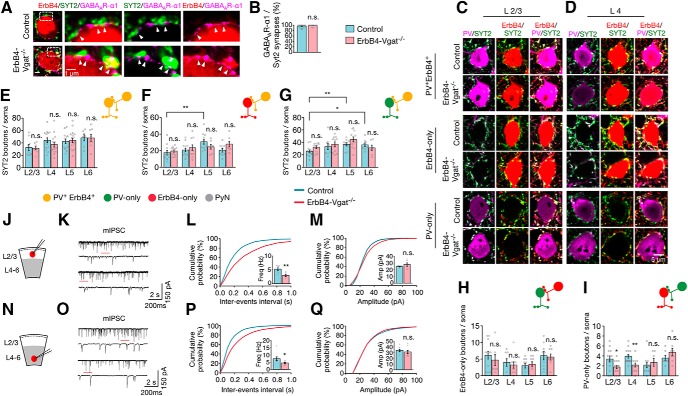
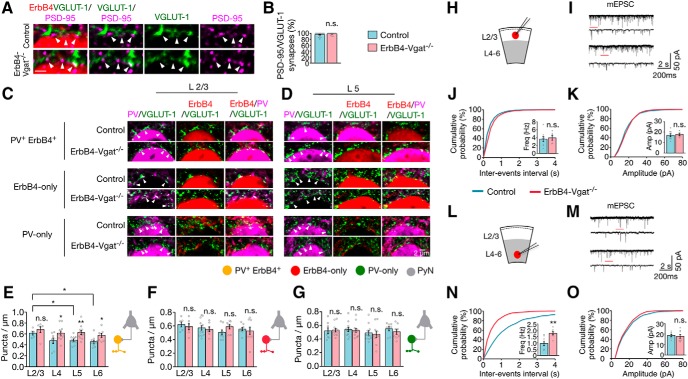
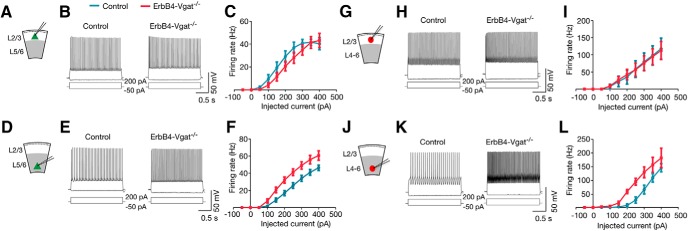
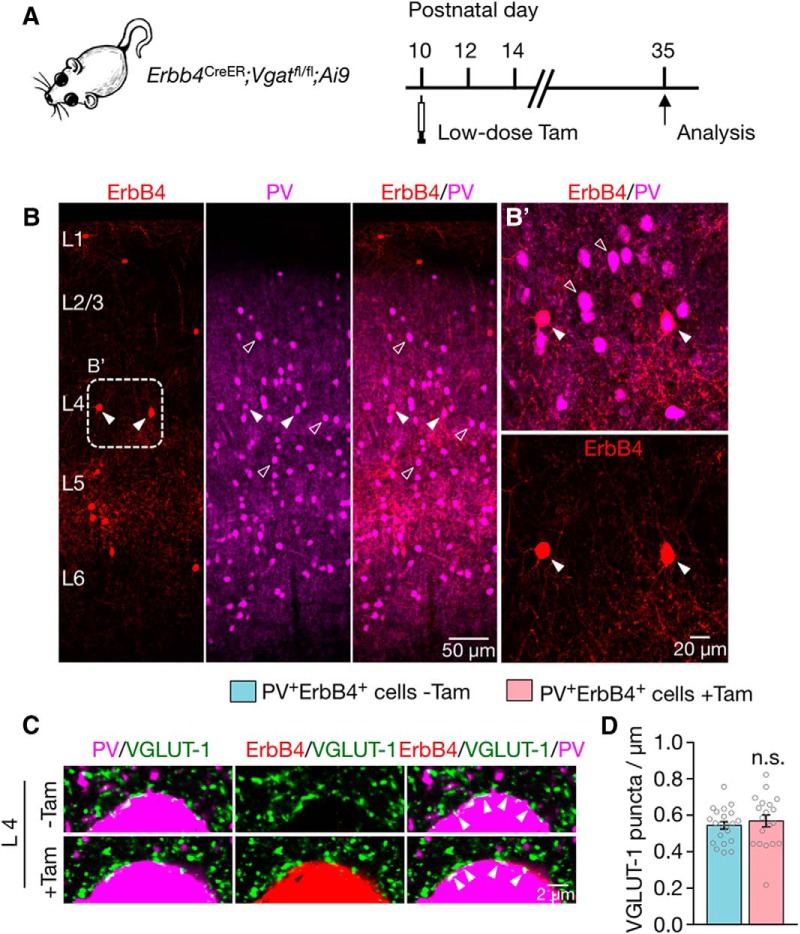
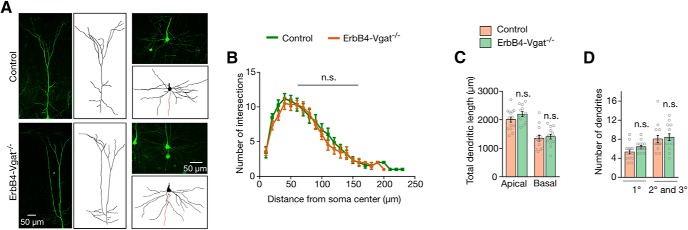
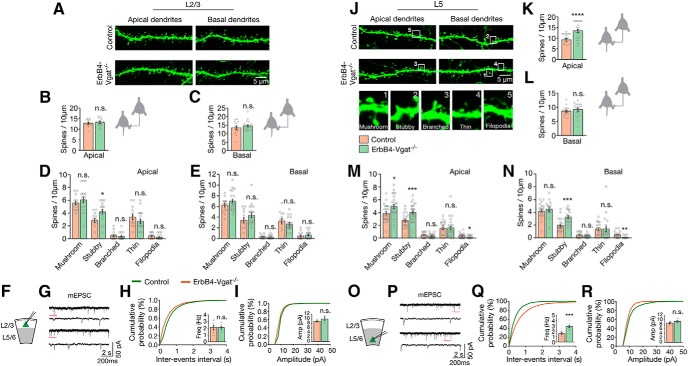
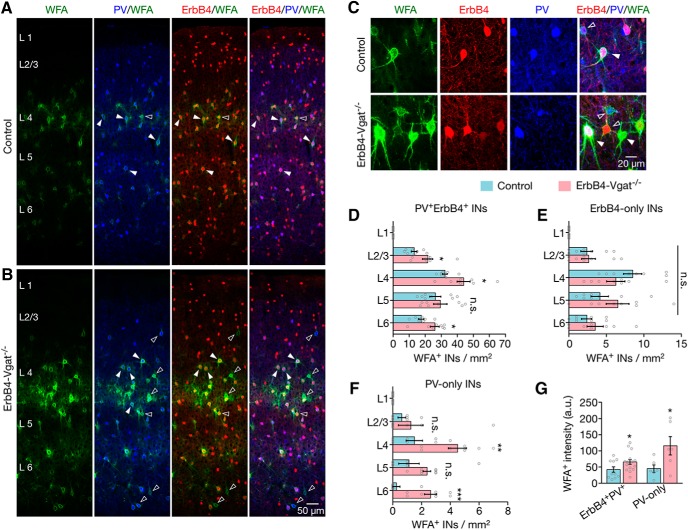
GABA signaling has been implicated in neural development; however, in vivo genetic evidence is missing because mutant mice lacking GABA activity die prematurely. Here, we studied synapse development by ablating vesicular GABA transporter (Vgat) in ErbB4+ interneurons. We show that inhibitory axo-somatic synapses onto pyramidal neurons vary from one cortical layer to another; however, inhibitory synapses on axon initial segments (AISs) were similar across layers. Conversely, parvalbumin-positive (PV+)/ErbB4+ interneurons and PV-only interneurons receive a higher number of inhibitory synapses from PV+ErbB4+ interneurons compared with ErbB4-only interneurons. Vgat deletion from ErbB4+ interneurons reduced axo-somatic or axo-axonic synapses from PV+ErbB4+ interneurons onto excitatory neurons. This effect was associated with corresponding changes in neurotransmission. However, the Vgat mutation seemed to have little effect on inhibitory synapses onto PV+ and/or ErbB4+ interneurons. Interestingly, perineuronal nets, extracellular matrix structures implicated in maturation, survival, protection, and plasticity of PV+ interneurons, were increased in the cortex of ErbB4-Vgat-/- mice. No apparent difference was observed between males and females. These results demonstrate that Vgat of ErbB4+ interneurons is essential for the development of inhibitory synapses onto excitatory neurons and suggest a role of GABA in circuit assembly.SIGNIFICANCE STATEMENT GABA has been implicated in neural development, but in vivo genetic evidence is missing because mutant mice lacking GABA die prematurely. Here, we ablated Vgat in ErbB4+ interneurons in an inducible manner. We provide evidence that the formation of inhibitory and excitatory synapses onto excitatory neurons requires Vgat in interneurons. In particular, inhibitory axo-somatic and axo-axonic synapses are more vulnerable. Our results suggest a role of GABA in circuit assembly.

Keywords: ErbB4; GABA; axo–axonic; axo–somatic; inhibition; parvalbumin.


Figures

Figure 1.
Figure 1.
Elimination of GABA transmission from ErbB4+ interneurons during postnatal development. A, Genetic strategy for postnatal ablation of Vgat in ErbB4+ interneurons. Erbb4CreER and Erbb4CreER;Vgatfl/fl mice were crossed with LSL-tdTomato (Ai9) mice to visualize ErbB4+ neurons. B, Tam administration and experimental timeline. C, Reduced VGAT in the brain tissues of Tam-treated Erbb4CreER;Vgatfl/fl mice compared with vehicle-treated controls at P35. D, Quantitative data of C (n = 3 mice per group, PFC: p = 0.04; Ctx: p = 0.003; HPF: p = 0.03). E, Comparable growth rate of vehicle- and Tam-treated Erbb4CreER;Vgatfl/fl mice. F, Kaplan–Meier survival curves of control and ErbB4-Vgat−/− mice (n = 21 and 22 mice, respectively). G, VGAT reduction in ErbB4-Vgat−/− mice. H, Quantitative data of G. I, J, Representative coronal sections were immunolabeled with antibody against VGAT. Higher magnification of dotted areas is shown in images on the right (ErbB4, red; VGAT, green). Closed arrowheads indicate VGAT punctae colocalized with ErbB4+ boutons; open arrowheads indicate VGAT punctae not colocalized with ErbB4+ boutons. K, Decreased number of VGAT punctae associated with ErbB4+ boutons in ErbB4-Vgat−/− mice. Control, n = 46 ROIs, 9 sections, 3 mice; ErbB4-Vgat−/−, n = 35 ROIs, 9 sections, 4 mice. L, Decreased VGAT intensity in ErbB4+, but not ErbB4 (ErbB4-negative), boutons in ErbB4-Vgat−/− mice. VGAT-ErbB4+: control, n = 36 ROIs, 9 sections, 3 mice; ErbB4-Vgat−/−, n = 20 ROIs, 9 sections, 4 mice. VGAT-ErbB4-: control, n = 14 ROIs, 9 sections, 3 mice; ErbB4-Vgat−/−, n = 19 ROIs, 9 sections, 4 mice. PFC, Prefrontal cortex; Ctx, cortex; HPF, hippocampal formation. Error bars indicate SEM. n.s., Not significant. *p < 0.05; **p < 0.01; ***p < 0.001.
Figure 2.
Figure 2.
No electrographic seizure activities were seen before P45 in ErbB4-Vgat−/− mice. A, Representative EEG traces of an ErbB4-Vgat−/− mouse. Traces indicated by red lines were zoomed out below. Abnormal spike-like activities were not observed until P42 and no electrographic seizure activities were observed until P46. B, Numbers of ErbB4-Vgat−/− mice with first-onset spontaneous seizure (n = 20). C, Summarized EEG power (0.5–40 Hz) spectrum density. D, EEG power spectrum density of control and ErbB4-Vgat−/− mice at P36 and P48. n = 6 and 8 controls and ErbB4-Vgat−/− mice, respectively. n.s., Not significant. Error bars indicate SEM. *p < 0.05; **p < 0.01; ***p < 0.001.
Figure 3.
Figure 3.
Normal laminar distribution of PV+ and ErbB4+ interneurons in ErbB4-Vgat−/− mice. A, B, Representative coronal sections showing genetically labeled ErbB4+ interneurons (red) and PV+ interneurons (green), with NeuN (blue) staining as background in controls (A) and ErbB4-Vgat−/− (B) mice. Dotted rectangles are enlarged at the bottom to highlight ErbB4, PV-only interneurons (green, open arrowheads) and PV+ErbB4+ interneurons (yellow, closed arrowheads) in control (A′, A′′) and ErbB4-Vgat−/− (B′, B′′). C, Distribution diagram of indicated interneurons in superficial and deep cortical layers. D, Similar NeuN+ cell density in control and ErbB4-Vgat−/− mice (n = 9 sections, 4 mice per group). EH, Similar number and distribution of PV+ (E), ErbB4+ (F), percentage of PV+/ErbB4+ (G), and percentage of ErbB4+/PV+ (H) cells in different cortical layers (n = 9 sections, 4 mice per group). INs, Interneurons; n.s., not significant. Error bars indicate SEM.
Figure 4.
Figure 4.
ErbB4+ and PV+ presynaptic boutons as synapse-forming terminals. A, Cortical sections of control and ErbB4-Vgat−/− mice were stained with the antibody against GAD67, which were visualized by the fluorescence-conjugated secondary antibody (green). Somas are outlined by dotted white lines. Arrowheads indicate PV+ and ErbB4+ presynaptic boutons that were positive for GAD67. Scale bar, 2 μm. B, Percentage of GAD67/PV and GAD67/ErbB4 boutons per soma (control, n = 14; ErbB4-Vgat−/−, n = 28 somas, 3 mice per group). C, ErbB4+ boutons in contact or partial overlap with the inhibitory postsynaptic marker gephyrin. Cortical sections of control and ErbB4-Vgat−/− mice were stained with the antibody against gephyrin, which were visualized by the fluorescence-conjugated secondary antibody (green). Somas of pyramidal neurons were labeled by NeuN (blue). Arrowheads indicate ErbB4+ boutons that are in contact or partial overlap with gephyrin clusters. Scale bar, 2 μm. D, Percentage of ErbB4+ boutons and gephyrin clusters/total ErbB4+ boutons per soma (control, n = 34; ErbB4-Vgat−/−, n = 36 somas, 3 mice per group). EF, 3D quantification of PV+ and/or ErbB4+ axo–somatic synapses. Shown are representative images generated by Vaa3D as described in the Materials and Methods. Volumetric images (E, E′) show boutons marked with green spheres, which correspond to white circles in single-plane images like the one shown in F. E′, Higher-magnification image of the dotted area in E. Scale bar, 5 μm. n.s., Not significant. Error bars indicate SEM.
Figure 5.
Figure 5.
Decreased axo–somatic inhibitory synapses by PV+ErbB4+ interneurons onto excitatory neurons. A, Representative Z-plane images of axo–somatic synapses onto pyramidal neurons. Cortical sections of control and ErbB4-Vgat−/− mice were stained with antibodies against PV and NeuN. Shown are L2/3 and L5 somas in which ErbB4+ boutons are labeled in red (tdTomato), PV boutons in green, and NeuN in blue. Open arrowheads indicate boutons that are either PV-only or ErbB4-only and closed arrowheads indicate PV+ErbB4+ boutons. Higher magnification images of dotted areas are shown on the right. BD, Quantitative analysis of axo–somatic synapses that are PV+ErbB4+ (B), ErbB4-only (C), and PV-only (D). Control, n = 18, 13, 23, and 14 somas in L2/3, L4, L5, and L6, respectively, 4 mice; ErbB4-Vgat−/−, n = 15, 17, 24, and 19 somas in L 2/3, L4, L5, and L6, respectively, 4 mice. E, I, Schematics of whole-cell patch-clamp recordings of L2/3 (E) and L5/6 (I) pyramidal neurons in cortical slices. F, J, Representative traces of mIPSCs from L2/3 (F) and L5/6 (J) pyramidal neurons in control and ErbB4-Vgat−/− mice. Traces indicated by red lines are shown magnified below. G, H, Reduced mIPSC frequency (G) and no change in mIPSC amplitude (H) in L2/3 pyramidal neurons of ErbB4-Vgat−/− mice compared with controls. Control, n = 8 cells; ErbB4-Vgat−/−, n = 6 cells, 3 mice per group. K, L, Reduced mIPSC frequency (K) and no change in mIPSC amplitude (L) in L5/6 pyramidal neurons of ErbB4-Vgat−/− mice compared with controls. Control, n = 9 cells, 3 mice; ErbB4-Vgat−/−, n = 8 cells, 3 mice. Shown are cumulative probability plots for interevent intervals and amplitudes of mIPSCs. Insets, bar graphs for mIPSC frequency (Freq) and amplitude (Amp). n.s., Not significant. Error bars indicate SEM. *p < 0.05; **p < 0.01; ***p < 0.001; ****p < 0.0001.
Figure 6.
Figure 6.
Decreased axo–axonic inhibitory synapses onto pyramidal neuron AISs. A, ErbB4+ boutons are in contact or partial overlap with the inhibitory postsynaptic marker gephyrin. Cortical sections of control and ErbB4-Vgat−/− mice were stained with the antibody against gephyrin, which were visualized by the fluorescence-conjugated secondary antibody (green). AISs were labeled by ankyrin-G (cyan). Arrowheads indicate ErbB4+ boutons that are in contact or partial overlap with gephyrin clusters. Scale bar, 2 μm. B, Percentage of ErbB4+ boutons and gephyrin clusters/total ErbB4+ boutons per AIS (control, n = 19 AISs; ErbB4-Vgat−/−, n = 21 AISs, 3 mice per group). C, Representative Z-plane images of axo–axonic synapses onto pyramidal neuron AISs. Cortical sections of control and ErbB4-Vgat−/− mice were stained with antibodies against PV and ankyrin-G. Shown are L2/3 and L4 AISs in which ErbB4+ boutons are labeled in red (tdTomato), PV boutons in green, and ankyrin-G in cyan. Open arrowheads indicate boutons that are either PV-only or ErbB4-only and closed arrowheads indicate PV+ErbB4+ boutons. Higher-magnification images of dotted areas are shown on the right. DF, Quantitative analysis of axo–axonic synapses that are PV+ErbB4+ (D), ErbB4-only (E), and PV-only (F). Control, n = 35, 19, 19, and 15 AISs in L2/3, L4, L5, and L6, respectively, 4 mice; ErbB4-Vgat−/−, n = 37, 20, 26, and 18 AISs in L 2/3, L4, L5, and L6, respectively, 4 mice. Ank-G, Ankyrin-G; n.s., not significant. Error bars indicate SEM. *p < 0.05.
Figure 7.
Figure 7.
Similar SYT2+ inhibitory synapses onto inhibitory neurons, but reduced SYT2/PV-only synapses onto ErbB4-only interneurons. A, SYT2 punctae in contact or partial overlap with GABAAR α1 punctae. Cortical sections were stained with antibodies against SYT2 and GABAAR α1, which were visualized by fluorescence-conjugated secondary antibodies (green and magenta, respectively). Genetically labeled ErbB4+ interneuron somas are represented in red (tdTomato). Shown on the right are high-magnification images of the dotted rectangles area. Arrowheads indicate SYT2 boutons in contact or partial overlap with GABAAR α1 punctae representing inhibitory synapses. B, Percentage of GABAAR α1/SYT2 punctae per soma (control, n = 28 somas; ErbB4-Vgat−/−, n = 25 somas, 3 mice per group). C, D, Representative Z-plane images of axo–somatic synapses onto interneurons. Cortical sections of control and ErbB4-Vgat−/− mice were stained with antibodies against PV and SYT2. Shown are L2/3 (C) and L4 (D) interneurons in which ErbB4+ boutons are labeled in red (tdTomato), PV boutons in magenta, and SYT2 in green. EG, Quantitative analysis of SYT2+ inhibitory axo–somatic synapses onto PV+ErbB4+ interneurons (E), ErbB4-only interneurons (F), and PV-only interneurons (G). H, No change in SYT2, ErbB4-only inhibitory synapses onto PV-only interneurons. I, Reduced SYT2, PV-only inhibitory synapses onto ErbB4-only interneurons. PV+ErbB4+ interneurons: control, n = 9, 15, 13, and 7 cells in L2/3, L4, L5, and L6, respectively, 4 mice; ErbB4-Vgat−/−, n = 9, 15, 17, and 8 cells in L 2/3, L4, L5, and L6, respectively, 4 mice. ErbB4-only interneurons: control, n = 13, 15, 11, and 10 cells in L2/3, L4, L5, and L6, respectively, 4 mice; ErbB4-Vgat−/−, n = 14, 11, 7, and 7 cells in L 2/3, L4, L5, and L6, respectively, 4 mice. PV-only interneurons: control, n = 13, 9, 10, and 9 cells in L2/3, L4, L5, and L6, respectively, 4 mice; ErbB4-Vgat−/−, n = 10, 11, 12, and 8 cells in L 2/3, L4, L5, and L6, respectively, 4 mice. J, N, Schematics of whole-cell patch-clamp recordings of L2/3 (J) and L4–L6 (N) ErbB4+ interneurons in cortical slices. K, O, Representative traces of mIPSCs from L2/3 (K) and L4–L6 (O) ErbB4+ interneurons in control and ErbB4-Vgat−/− mice. Traces indicated by red lines are shown magnified below. L, M, Reduced mIPSC frequency (L) and no change in mIPSC amplitude (M) in L2/3 ErbB4+ interneurons of ErbB4-Vgat−/− mice compared with controls. Control, n = 8 cells, 3 mice; ErbB4-Vgat−/−, n = 6 cells, 3 mice. P, Q, Reduced mIPSC frequency (P) and no change in mIPSC amplitude (Q) in L4–L6 ErbB4+ interneurons of ErbB4-Vgat−/− mice compared with controls. Control, n = 8 cells, 3 mice; ErbB4-Vgat−/−, n = 9 cells, 3 mice. Shown are cumulative probability plots for interevent intervals and amplitudes of mIPSCs. Insets, Bar graphs for mIPSC frequency and amplitude. Freq, frequency, Amp, amplitude. n.s., Not significant. Error bars indicate SEM. *p < 0.05; **p < 0.01.
Figure 8.
Figure 8.
Increased excitatory inputs onto PV+ErbB4+ interneurons in deep layers. A, VGLUT-1 punctae in contact or partial overlap with PSD-95 punctae. Cortical sections were stained with antibodies against VGLUT-1 and PSD-95, which were visualized by fluorescence-conjugated secondary antibodies (green and magenta, respectively). Genetically labeled ErbB4+ interneuron somas were represented in red (tdTomato). Arrowheads indicate Vglut-1 punctae in contact or partial overlap with PSD-95 punctae, representing excitatory synapses. B, Percentage of Vglut-1/PSD-95 punctae per soma (control, n = 19 somas; ErbB4-Vgat−/−, n = 17 somas, 3 mice per group). C, D, Representative images of excitatory axo–somatic synapses onto interneurons. Cortical sections of control and ErbB4-Vgat−/− mice were stained with antibodies against PV and VGLUT-1. Shown are L2/3 (C) and L5 (D) interneurons, where ErbB4+ somas were labeled in red (tdTomato), VGLUT-1 punctae in green, and PV in magenta. EG, Quantitative analysis of excitatory synapses onto PV+ErbB4+ interneurons (E), ErbB4-only (F), and PV-only (G; n = 6 sections per mice; 5–7 somas per cortical layer per section, 3 mice per group). H, L, Schematics of whole-cell patch-clamp recordings of L2/3 (H) and L4–L6 (L) ErbB4+ interneurons in cortical slices. I, M, Representative traces of mEPSCs from L2/3 (I) and L4–L6 (M) ErbB4+ interneurons in control and ErbB4-Vgat−/− mice. Traces indicated by red lines are shown magnified below. J, K, No change in mEPSC frequency (J) and amplitude (K) in L2/3 ErbB4+ interneurons of ErbB4-Vgat−/− mice compared with controls. Control, n = 8 cells, 3 mice; ErbB4-Vgat−/−, n = 6 cells, 3 mice. N, O, Increased mEPSC frequency (N) and no change in mEPSC amplitude (O) in L4–L6 ErbB4+ interneurons of ErbB4-Vgat−/− mice compared with controls. Control, n = 8 cells, 3 mice; ErbB4-Vgat−/−, n = 8 cells, 3 mice. Shown are cumulative probability plots for interevent intervals and amplitudes of mEPSCs. Insets, Bar graphs for mEPSC frequency and amplitude. n.s., Not significant. Error bars indicate SEM. *p < 0.05; **p < 0.01.
Figure 9.
Figure 9.
Increased excitability of pyramidal neurons and ErbB4+ interneurons in deep cortical layers of ErbB4-Vgat−/− mice. A, D, Schematics of whole-cell patch-clamp recordings of L2/3 (A) and L5/6 (D) pyramidal neurons in cortical slices. B, E, Representative traces of action potentials for 2 s step current injection (−50 to 200 pA) in L2/3 (B) and L5/6 (E) pyramidal neurons in control and ErbB4-Vgat−/− mice. C, F, Left shift of firing F–I curves) in L5/6 pyramidal neurons, but not those in L2/3 in ErbB4-Vgat−/− mice. L2/3: n = 10 cells, 3 mice per genotype. L5/6: n = 10 cells, 3 mice per genotype. G, J, Schematics of whole-cell patch-clamp recordings of L2/3 (G) and L4–L6 (J) ErbB4+ interneurons in cortical slices. H, K, Representative traces of action potentials for 2 s step-current injection (−50 to 200 pA) in L2/3 (H) and L4–L6 (K) ErbB4+ interneurons in control and ErbB4-Vgat−/− mice. I, L, No change in average firing frequency versus current relationships (F–I curves) in L2/3 (I) and an increased in excitability (left shift in F–I curve) in L4–L6 (L) ErbB4+ interneurons of ErbB4-Vgat−/− mice compared with controls. L2/3: n = 10 cells, 3 mice per genotype. L5/6: n = 10 cells, 3 mice per genotype. n.s., Not significant. Error bars indicate SEM.
Figure 10.
Figure 10.
Non-cell-autonomous regulation by Vgat mutation of excitatory synapses onto PV+ErbB4+ interneurons. A, Paradigm of low-dose Tam administration and experimental timeline. B, Representative coronal sections showing sparsely recombined ErbB4+ interneurons (red, labeled by tdTomato) and PV+ interneurons (magenta). Higher-magnification image of the dotted rectangle (B′) is shown on the right. C, No change in excitatory synapses onto sparsely recombined PV+ErbB4+ interneurons compared with PV+ interneurons without recombination. Cortical sections were stained with antibodies against PV and VGLUT-1. Shown are L4 interneurons in which ErbB4+ interneurons are labeled in red (tdTomato), VGLUT-1 punctae in green, and PV+ interneurons in magenta. D, Quantitative data in C. n = 21 PV+ and n = 19 PV+ErbB4+ interneurons, 3 mice. n.s., Not significant. Error bars indicate SEM.
Figure 11.
Figure 11.
Normal development of pyramidal neurons in ErbB4-Vgat−/− mice. A, Representative images and associated 3D reconstructed images of pyramidal neurons. B, No change in dendritic complexity, which was revealed by Sholl analysis at 10 μm concentric circles around the soma. C, Quantitative analysis of total dendritic length. D, Quantitative analysis of dendritic branches. BD, n = 15 and 12 neurons for apical dendrites and n = 15 and 14 neurons for basal dendrites, of control and ErbB4-Vgat−/− mice respectively, 3 control and 4 ErbB4-Vgat−/− mice. n.s., Not significant. Error bars indicate SEM.
Figure 12.
Figure 12.
Increased dendritic spines of pyramidal neurons in ErbB4-Vgat−/− mice. A, Representative images of apical and basal dendritic spines (genetically labeled by GFP) of L2/3 pyramidal neurons in control and ErbB4-Vgat−/− mice. B, C, Similar dendritic spines of apical and basal dendrites of L2/3 pyramidal neurons in control and ErbB4-Vgat−/− mice (n = 12 and 15 neurons from 3 controls and 4 ErbB4-Vgat−/− mice, respectively, 2–3 dendritic segments per neuron). D, E, Spine subtypes distribution of L2/3 apical and basal dendrites. J, Representative images of apical and basal dendritic spines (genetically labeled by GFP) of L5 pyramidal neurons in control and ErbB4-Vgat−/− mice. Examples of different subtypes of dendritic spines in numbered boxes are shown in high magnification at the bottom. K, L, Dendritic spines of apical, but not basal, dendrites were increased (n = 19 and 18 neurons, in 3 controls and 4 ErbB4-Vgat−/− mice, respectively, 2–3 dendritic segments per neuron). M, N, Spine subtype distribution of L5 apical and basal dendrites. F, O, Schematics of whole-cell patch-clamp recordings of L2/3 (F) and L5/6 (O) pyramidal neurons in cortical slices. G, P, Representative traces of mEPSCs from L2/3 (G) and L5/6 (P) pyramidal neurons in control and ErbB4-Vgat−/− mice. Traces indicated by red lines are shown magnified below. H, I, no change in mEPSC frequency (H) and amplitude (I) in L2/3 pyramidal neurons of ErbB4-Vgat−/− mice compared with controls. Control, n = 8 cells, 3 mice; ErbB4-Vgat−/−, n = 6 cells, 3 mice. Q, R, Increased mEPSC frequency (Q) and no change in mEPSC amplitude (R) in L5/6 pyramidal neurons of ErbB4-Vgat−/− mice compared with controls. Control, n = 9 cells, 3 mice; ErbB4-Vgat−/−, n = 9 cells, 3 mice. Shown are cumulative probability plots for interevent intervals and amplitudes of mEPSCs. Insets, Bar graphs for mEPSC frequency and amplitude. Error bars indicate SEM. n.s., Not significant. *p < 0.05; **p < 0.01; ***p < 0.001; ****p < 0.0001.
Figure 13.
Figure 13.
Upregulated perineuronal nets of PV+ErbB4+ interneurons. A, B, Representative images of WFA-labeled PNNs (green), genetically labeled ErbB4+ interneurons (red), and coimmunofluorescence staining of PV (blue). C, Z-stacked images of ErbB4-only (red, open arrowhead), PV-only (blue, open arrowhead), or PV+ErbB4+ interneurons (closed arrowhead) surrounded by PNNs. D, Increased PV+ErbB4+ interneurons in L2/3, L4, and L6 that were surrounded by PNNs. E, No change in numbers of ErbB4-only interneurons that were surrounded by PNNs. F, Increased PV-only interneurons in L4 and L6 that were surrounded by PNNs. G, Increased PNN intensity surrounding PV-only and double-positive interneurons (control, n = 8 sections, 4 mice; ErbB4-Vgat−/−, n = 8 sections, 4 mice). INs, Interneurons. Error bars indicate SEM. n.s., Not significant. *p < 0.05; **p < 0.01.

References

    1. Asada H, Kawamura Y, Maruyama K, Kume H, Ding RG, Kanbara N, Kuzume H, Sanbo M, Yagi T, Obata K (1997) Cleft palate and decreased brain gamma-aminobutyric acid in mice lacking the 67-kDa isoform of glutamic acid decarboxylase. Proc Natl Acad Sci U S A 94:6496–6499. 10.1073/pnas.94.12.6496 - DOI - PMC - PubMed
    1. Baho E, Di Cristo G (2012) Neural activity and neurotransmission regulate the maturation of the innervation field of cortical GABAergic interneurons in an age-dependent manner. J Neurosci 32:911–918. 10.1523/JNEUROSCI.4352-11.2012 - DOI - PMC - PubMed
    1. Bartos M, Vida I, Jonas P (2007) Synaptic mechanisms of synchronized gamma oscillations in inhibitory interneuron networks. Nat Rev Neurosci 8:45–56. 10.1038/nrn2044 - DOI - PubMed
    1. Bean JC, Lin TW, Sathyamurthy A, Liu F, Yin DM, Xiong WC, Mei L (2014) Genetic labeling reveals novel cellular targets of schizophrenia susceptibility gene: distribution of GABA and non-GABA ErbB4-positive cells in adult mouse brain. J Neurosci 34:13549–13566. 10.1523/JNEUROSCI.2021-14.2014 - DOI - PMC - PubMed
    1. Butt SJ, Sousa VH, Fuccillo MV, Hjerling-Leffler J, Miyoshi G, Kimura S, Fishell G (2008) The requirement of Nkx2–1 in the temporal specification of cortical interneuron subtypes. Neuron 59:722–732. 10.1016/j.neuron.2008.07.031 - DOI - PMC - PubMed

Publication types

MeSH terms

LinkOut - more resources