. 2018 Apr;8(4):478-497.
doi: 10.1158/2159-8290.CD-17-1271. Epub 2018 Feb 5.

MEF2C Phosphorylation Is Required for Chemotherapy Resistance in Acute Myeloid Leukemia

Affiliations

MEF2C Phosphorylation Is Required for Chemotherapy Resistance in Acute Myeloid Leukemia

Fiona C Brown et al. Cancer Discov. 2018 Apr.

Abstract

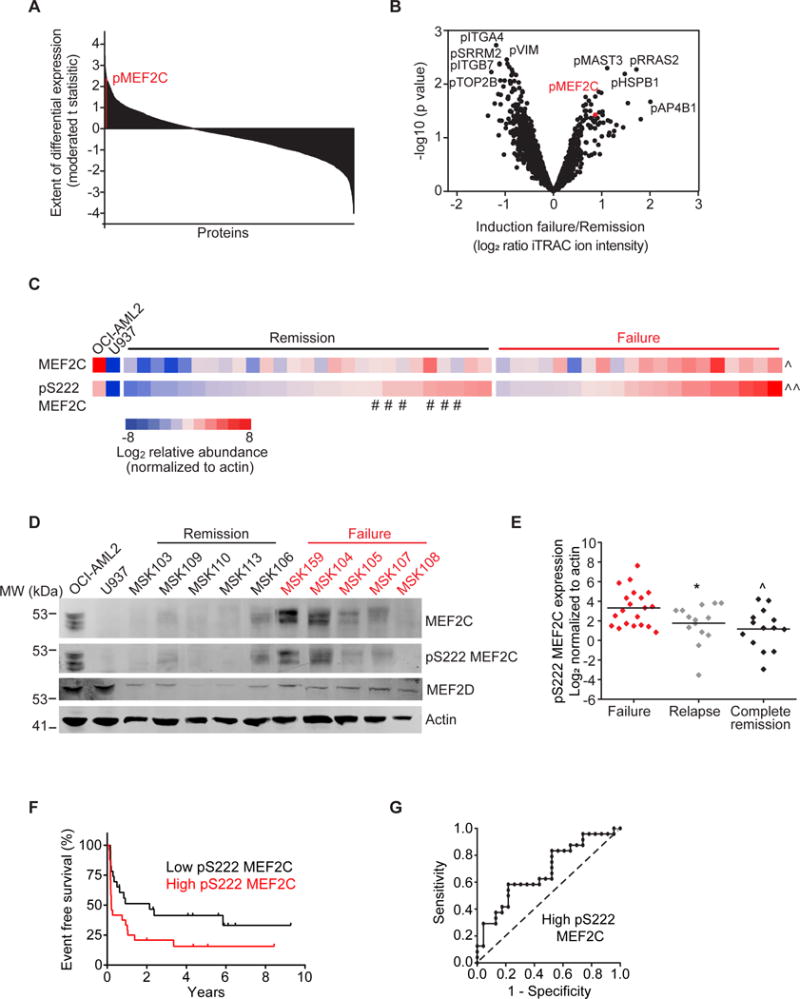
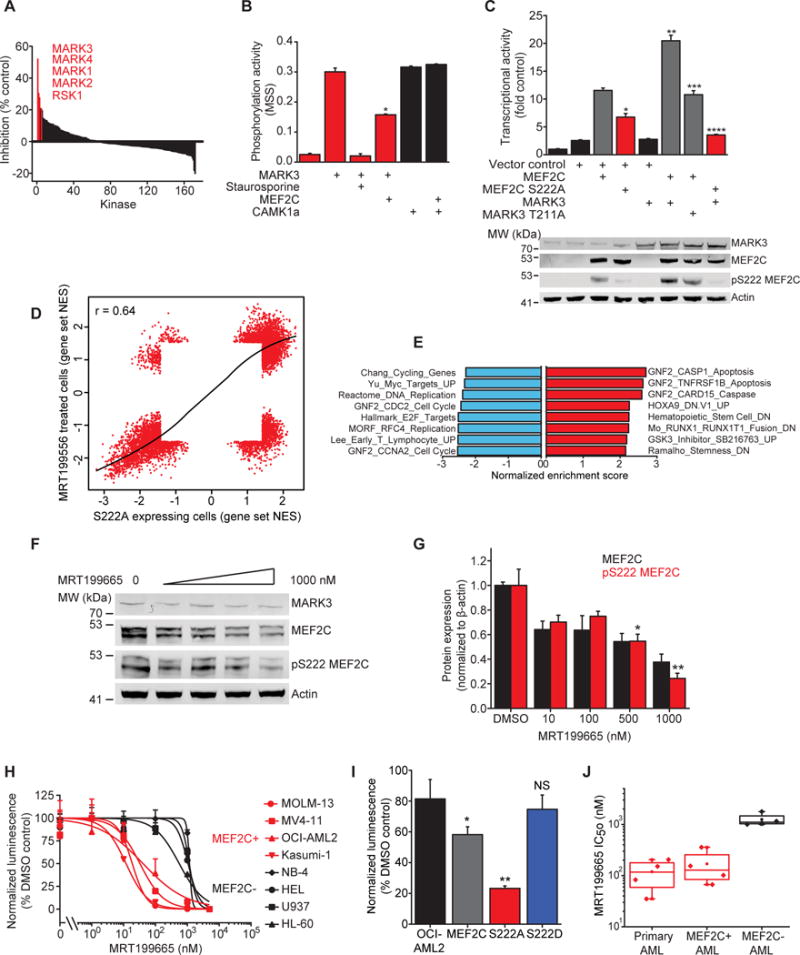
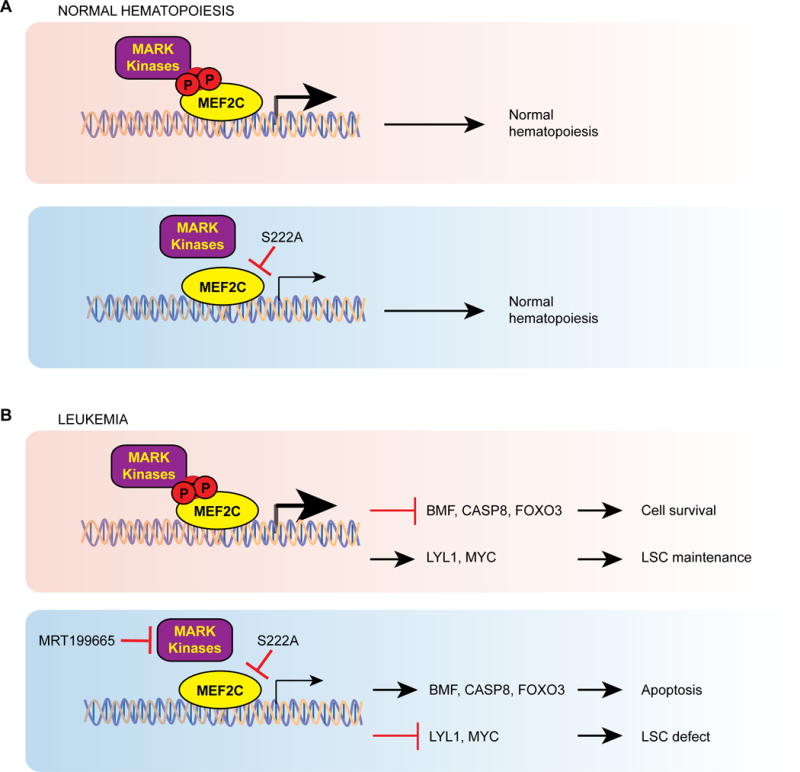
In acute myeloid leukemia (AML), chemotherapy resistance remains prevalent and poorly understood. Using functional proteomics of patient AML specimens, we identified MEF2C S222 phosphorylation as a specific marker of primary chemoresistance. We found that Mef2cS222A/S222A knock-in mutant mice engineered to block MEF2C phosphorylation exhibited normal hematopoiesis, but were resistant to leukemogenesis induced by MLL-AF9 MEF2C phosphorylation was required for leukemia stem cell maintenance and induced by MARK kinases in cells. Treatment with the selective MARK/SIK inhibitor MRT199665 caused apoptosis and conferred chemosensitivity in MEF2C-activated human AML cell lines and primary patient specimens, but not those lacking MEF2C phosphorylation. These findings identify kinase-dependent dysregulation of transcription factor control as a determinant of therapy response in AML, with immediate potential for improved diagnosis and therapy for this disease.Significance: Functional proteomics identifies phosphorylation of MEF2C in the majority of primary chemotherapy-resistant AML. Kinase-dependent dysregulation of this transcription factor confers susceptibility to MARK/SIK kinase inhibition in preclinical models, substantiating its clinical investigation for improved diagnosis and therapy of AML. Cancer Discov; 8(4); 478-97. ©2018 AACR.This article is highlighted in the In This Issue feature, p. 371.


Conflict of interest statement

Conflicts of interest:

No potential conflicts of interest were disclosed by the authors.

Figures

Figure 1
Figure 1. Phosphorylation of MEF2C at serine 222 is associated with primary AML chemoresistance
A, Phosphoproteomic screen for differentially abundant protein phosphorylation sites detected in diagnostic AML specimens in patients with primary chemotherapy resistance and induction failure, as compared to patients who achieved complete induction remission, with pS222 is marked in red (Data S1, Figures S1A and B). B, Volcano plot of protein phosphorylation sites detected in induction failure versus complete remission specimens, with candidate phosphoproteins marked, including pMEF2C (red). C, Heatmap of MEF2C expression and S222 phosphorylation in a matched cohort of 47 specimens, as measured using quantitative fluorescence immunoblotting, and normalized to actin. # denotes specimens from patients with high pS222 expression who achieved complete remission but experienced AML relapse. ^ and ^^ p = 6.0 × 10⁻³ and 6.5 × 10⁻⁴ for remission versus failure for MEF2C and pS222 MEF2C respectively (t-test). D, Representative Western immunoblot analysis for MEF2C, pS222 MEF2C and MEF2D in a cohort of age, disease and therapy-matched AML patient specimens with induction failure and complete remission. The human AML cell lines OCI-AML2 and U937 serve as positive and negative controls for MEF2C expression and S222 phosphorylation, respectively. E, Normalized log2 expression of pS222 MEF2C compared to actin in induction failure, relapse and complete remission AML patient specimens. * and ^ p = 2.7 × 10⁻² and 3.5 × 10⁻³ for induction failure versus relapse and remission respectively (t-test). F, Event-free survival analysis of 47 AML patient specimens assessed in c-e, separated above or below median pS222 MEF2C expression levels. p = 3.8 × 10⁻² (log-rank test). G, Receiver operator characteristic (ROC) curve analysis for pS222 MEF2C in this cohort. p = 3.2 × 10⁻² (Wilcoxon test).
Figure 2
Figure 2. A therapeutic window for targeting MEF2C phosphorylation in AML
A, Sequencing electropherograms of tail genomic DNA from Mef2cS222A/S222A and Mef2cS222D/S222D mice, demonstrating specific CRISPR/Cas9-induced c.TCA>GCG and c.TCA>GAT mutations, as underlined red and green, respectively. B, Western immunoblot of bone marrow B220+ and Gr-1+/CD11b+ cells from Mef2cS222A/S222A and Mef2cS222D/S222D mice. C, Total numbers of myeloid (Gr-1+/CD11b+), B-cell (B220+) and T-cell (CD4+/CD8+) bone marrow cells from Mef2cS222A/S222A and Mef2cS222D/S222D mice as assessed by D, FACS analysis. Error bars represent standard deviation of the mean from 3 mice. E, Peripheral blood chimerism of CD45.2+ cells at 4 weeks following competitive transplantation. Error bars represent standard deviation of the mean of 10 animals per group. F, Peripheral blood engraftment of CD45.2+ cells as a function of time post-transplant as in e. Bars denote mean. G, Serial replating clonogenic efficiencies of bone marrow GMP cells from Mef2cS222A/S222A, Mef2cS222D/S222D and wild-type litter mates transduced with MLL-AF9. Error bars represent standard deviation of the mean of 3 biological replicates (additional data in Figure S6). * p = 3.3 × 10⁻³ of WT;MLL-AF9 versus S222A/S222A;MLL-AF9 (t-test). H, Kaplan–Meier survival curves of mice transplanted with MLL-AF9 transformed bone marrow GMP cells from Mef2cS222A/S222A, Mef2cS222D/S222D and wild-type litter mate controls. p = 6.8 × 10⁻⁹ for Mef2cS222A/S222A vs wild-type litter mates, log rank test for 10 animals per group. Solid and dashed black lines denote wild-type liter mates for Mef2cS222A/S222A and Mef2cS222D/S222D, respectively.
Figure 3
Figure 3. MEF2C phosphorylation is required for leukemia stem cell survival and maintenance
A, Kaplan–Meier survival curves of secondary recipient mice transplanted with 100 cells of wild-type MLL-AF9;MEF2C, dominant negative MLL-AF9;MEF2C S222A or control MLL-AF9;MIT transformed leukemias. p = 2.2 × 10⁻¹⁰ for MLL-AF9;MEF2C S222A versus MLL-AF9;MEF2C, log rank test for 20 animals per group. B, Limiting dilution analysis of frequency of leukemia initiating cells in secondary MLL-AF9 transplants. Solid and dashed lines represent the calculated stem cell frequencies and their 95% confidence intervals, respectively. p = 6.7 × 10⁻⁸ for S222A versus MEF2C (chi-squared test). C, Colony formation of primary Runx1−/−;Flt3ITD;MEF2C leukemia cells. Below, representative micrographs of colonies at day 7. * p = 1.9 × 10⁻⁵ S222A vs MEF2C, t-test. Error bars represent standard deviation of the mean of 3 biological replicates. Scale bar denotes 100 μm. D, Kaplan–Meier survival curves of tertiary recipient mice transplanted with 50,000 cells of wild-type Runx1−/−;Flt3ITD;MEF2C, dominant negative Runx1−/−;Flt3ITD;MEF2C S222A and Runx1−/−;Flt3ITD;MEF2C S222D or control Runx1−/−;Flt3ITD;MIT transduced leukemias. p = 3.1 × 10⁻³ for MLL-AF9;MEF2C S222A versus MLL-AF9;MEF2C, log-rank test for 5 animals per group. E, Western immunoblot analysis for MEF2C and pS222 MEF2C in OCI-AML2 cells lentivirally transduced with wild-type MEF2C or dominant negative MEF2C S222A transgenes and treated for 48 hours with 600 ng/ml of doxycycline to induce transgene expression. F, Quantitative analysis of MEF2C and pS222 MEF2C, as measured using quantitative fluorescence immunoblotting, and normalized to actin, demonstrating equal expression of MEF2C and MEF2C S222A protein (*p = 0.96, t-test) and significantly reduced abundance of pS222 MEF2C (**p = 1.1 × 10⁻³ for MEF2C S222A versus MEF2C, t-test). Error bars represent standard deviation of the mean for 3 biological replicates. G, Growth of human AML cell lines lentivirally transduced with wild-type MEF2C or dominant negative MEF2C S222A and MEF2C S222D transgenes and treated for 72 hours with 600 ng/ml doxycycline to induce transgene expression. Error bars represent standard deviation of the mean for 3 biological replicates. * and ** p = 3.4 × 10⁻³ and 8.4 × 10⁻³ for MEF2C versus MEF2C S222A, respectively (t-test). H, Kaplan–Meier survival curves of NSG mice transplanted with OCI-AML2 cells transduced with wild-type MEF2C and dominant negative MEF2C S222A transgenes, and treated with doxycycline in chow 3 days following transplantation continuously in vivo. p = 3.5 × 10⁻⁶ MEF2C versus MEF2C S222A, log-rank test for 10 animals per group.
Figure 4
Figure 4. MEF2C phosphorylation is required for MEF2C-mediated gene expression program
A, Activity of luciferase transcriptional MEF2 reporter in HEK293T cells lentivirally transduced with wild-type MEF2C or mutant MEF2C S222A, as compared to vector control. Error bars represent standard deviation of the mean for 3 biological replicates. * p = 4.0 × 10⁻² for MEF2C S222A versus MEF2C, t-test. B, Western immunoblot analysis for MEF2C and pS222 MEF2C in transcriptional reporter cells, demonstrating equal protein expression of MEF2C transgenes, and reduced pS222 in MEF2C S222A transduced cells. C, Hierarchical clustering of gene expression of the most differentially expressed genes in OCI-AML2 cells transduced with wild-type MEF2C or dominant-negative MEF2C S222A transgenes (−), and treated with 600 ng/ml doxycycline for 48 hours to induce transgene expression (+). Three biological replicates are shown, as indicated. Blue-to-red color gradient indicates relative gene expression. D, Gene set enrichment analysis (GSEA) of significantly upregulated and downregulated gene sets. E, GSEA illustrates enrichment of apoptotic genes in MEF2C S222A expressing cells. Normalized enrichment score = 1.76 and false discovery rate q = 5.2 × 10⁻³. F, Combined analysis of differentially expressed genes identified in RNA-seq shown in C versus differentially accessible genes identified in ATAC-seq containing canonical MEF2 sequence motifs. S222A-induced and S222A-repressed genes are highlighted in red and blue, respectively. G, Western immunoblot analysis for LYL1 in OCI-AML2 cells lentivirally transduced with wild-type MEF2C or dominant negative MEF2C S222A transgenes and treated for 48 hours with 600 ng/ml of doxycycline to induce transgene expression. Below, quantitative analysis of LYL1 expression normalized to actin. H, BH3 profiling of OCI-AML2 cells transduced with wild-type MEF2C or dominant-negative MEF2C S222A transgenes, and treated with 600 ng/ml doxycycline for 48 hours to induce transgene expression. Error bars represent standard deviation of the mean for 3 biological replicates. *, ** and *** p = 1.3 × 10⁻², 1.2 × 10⁻² and 2.9 × 10⁻² for MEF2C S222A versus MEF2C respectively, t-test. I, Western immunoblot analysis for MEF2C in DSS-treated OCI-AML2 cells lentivirally transduced with wild-type MEF2C or dominant negative MEF2C S222A transgenes and treated for 48 hours with 600 ng/ml of doxycycline to induce transgene expression.
Figure 5
Figure 5. Chemical inhibition of MARK-induced MEF2C phosphorylation exhibits selective toxicity against MEF2C-activated human AML cells
A, Recombinant screen for serine kinases that phosphorylate MEF2C S222, as assayed by significant pS222 MEF2C product inhibition marked in red. B, Phosphorylation activity of recombinant MARK3 (red) as compared to control CAMK1α (black) on model substrate as product-inhibited by synthetic pS222 MEF2C peptide. Staurosporine serves as positive control. Error bars represent standard deviation of the mean for 3 biological replicates. * p = 4.1 × 10⁻⁵ for MARK3 activity with and without MEF2C, t-test. C, Activity of luciferase transcriptional MEF2 reporter in HEK293T cells lentivirally transduced with MEF2C, MARK3 or their mutants, as indicated. Error bars represent standard deviations of the mean for 3 biological replicates. *, **, *** and **** p = 2.3 × 10⁻⁴, 3.4 × 10⁻⁵, 5.0 × 10⁻⁵, and 1.5 × 10⁻⁷ for MEF2C S222A;vector versus MEF2C;vector, MEF2C;MARK3 versus MEF2C;vector, MEF2C;MARK3 T211A versus MEF2C;MARK3, and MEF2C S222A;MARK3 versus MEF2C;MARK3, respectively (t-test). Below, Western immunoblot analysis demonstrating equal protein expression of MEF2C and MARK3 transgenes, with reduced S222 phosphorylation by expression of MEF2C S222A and MARK3 T211A mutants. D, Correlation analysis of differentially expressed gene sets between S222A-expressing OCI-AML2 cells and MRT199665-treated OCI-AML2 cells. r = 0.64, Pearson correlation coefficient. E, Gene set enrichment analysis (GSEA) of significantly upregulated and downregulated gene sets. F, Western immunoblot for MEF2C, pS222 MEF2C and MARK3 in OCI-AML2 cells treated with increasing concentrations of MRT199665 for 12 hours. G, Quantitative analysis of MEF2C and pS222 MEF2C abundance, as measured using quantitative fluorescence immunoassays, and normalized to actin, demonstrating significant reduction of MEF2C phosphorylation by MRT199665 as compared to DMSO control (p = 5.5 × 10⁻³ and 3.4 × 10⁻⁴ for 500 and 1000 nM, respectively (t-test)). Error bars represent standard deviation of the mean for 2 biological replicates. H, Growth of human AML cell lines at 48 hours as a function of MRT199665 concentration for MEF2C-expressing cells (red) as compared to those that lack MEF2C (black), as indicated. Error bars represent standard deviation of the mean for 3 biological replicates. I, Growth of OCI-AML2 cells lentivirally transduced with wild-type MEF2C or dominant negative MEF2C S222A or MEF2C S222D transgenes and treated with 600 ng/ml doxycycline to induce transgene expression and 100 nM MRT199665 for 72 hours. (* and ** p = 3.7 × 10⁻² and 1.3 × 10⁻³ for MEF2C and S222A verses OCI-AML2, respectively (t-test)). Error bars represent standard deviation of the mean for 3 biological replicates J, MRT199665 IC50 values for primary patient AML specimens and human AML cell lines with (red) and without (black) MEF2C activation upon 48 hours of drug treatment in vitro. Box plots represent mean and quartile, with whiskers denoting maximum and minimum values.
Figure 6
Figure 6. MARK kinase inhibition overcomes chemotherapy resistance of MEF2C-activated AML cell lines and patient cells
Growth of OCI-AML2 cells lentivirally transduced with wild-type MEF2C or dominant negative MEF2C S222A or MEF2C S222D transgenes and treated with 600 ng/ml doxycycline to induce transgene expression and increasing concentrations of cytarabine A, and doxorubicin B, for 72 hours. Error bars represent standard deviation of the mean for 3 biological replicates. p = 8.8 × 10⁻⁸ and 3.4 × 10⁻⁹ for MEF2C versus MEF2C S222A by nonlinear regression for cytarabine and doxorubicin, respectively. C, Kaplan–Meier survival curves of NSG mice transplanted with OCI-AML2 cells transduced with wild-type MEF2C and dominant negative MEF2C S222A transgenes, and D, treated with doxycycline in chow 3 days following transplantation continuously in vivo. One week following transplant, animals were treated with vehicle or cytarabine (blue arrow) intraperitoneally for 5 days. p = 6.8 × 10⁻⁵ MEF2C vs S222A cytarabine treated, log-rank test for 10 animals per group. E, Cytarabine IC50 values for human AML cell lines with MEF2C-activation (MEF2C+) as compared to those lacking MEF2C (MEF2C-) after 48 hours of drug treatment in the absence (−MRT) or presence of 100 nM (+MRT) MRT199665. Each data point represents the mean of biological triplicates of an individual sample. * p = 0.024 for +MRT versus −MRT for MEF2C-activated cells by paired t-test. F, Cytarabine IC50 values for primary patient AML specimens or normal CD34 cells with MEF2C after 48 hours of drug treatment in the absence (-MRT) or presence of 100 nM (+MRT) MRT199665 in vitro. Each data point represents the mean of biological triplicates of an individual sample. * p = 0.036 for +MRT versus -MRT by paired t-test.
Figure 7
Figure 7. Model of signaling-dependent dysregulation of MEF2C in AML and chemotherapy resistance
Model of kinase-dependent dysregulation of MEF2C in AML and chemotherapy resistance. A, MEF2C S222 phosphorylation is regulated by MARK kinases and is dispensable for normal hematopoiesis, B, but is required for enhanced leukemia stem cell survival and chemotherapy resistance via control of genes such as LYL1, MYC, BMF, CASP8 and FOXO3. This differential functional dependency can be exploited for therapy and blockade of chemotherapy resistance using selective MARK kinase inhibition.

References

    1. Schuback HL, Arceci RJ, Meshinchi S. Somatic characterization of pediatric acute myeloid leukemia using next-generation sequencing. Seminars in hematology. 2013;50:325–32. - PubMed
    1. Cancer Genome Atlas Research N. Genomic and epigenomic landscapes of adult de novo acute myeloid leukemia. The New England journal of medicine. 2013;368:2059–74. - PMC - PubMed
    1. Papaemmanuil E, Gerstung M, Bullinger L, Gaidzik VI, Paschka P, Roberts ND, et al. Genomic Classification and Prognosis in Acute Myeloid Leukemia. The New England journal of medicine. 2016;374:2209–21. - PMC - PubMed
    1. Zuber J, Rappaport AR, Luo W, Wang E, Chen C, Vaseva AV, et al. An integrated approach to dissecting oncogene addiction implicates a Myb-coordinated self-renewal program as essential for leukemia maintenance. Genes & development. 2011;25:1628–40. - PMC - PubMed
    1. Coombs CC, Tallman MS, Levine RL. Molecular therapy for acute myeloid leukaemia. Nat Rev Clin Oncol. 2016;13:305–18. - PMC - PubMed

Publication types

Substances