Case Reports
. 2018 Mar 1;128(3):1043-1056.
doi: 10.1172/JCI94996. Epub 2018 Feb 12.

Physiological genomics identifies genetic modifiers of long QT syndrome type 2 severity

Affiliations
Case Reports

Physiological genomics identifies genetic modifiers of long QT syndrome type 2 severity

Sam Chai et al. J Clin Invest. .

Abstract

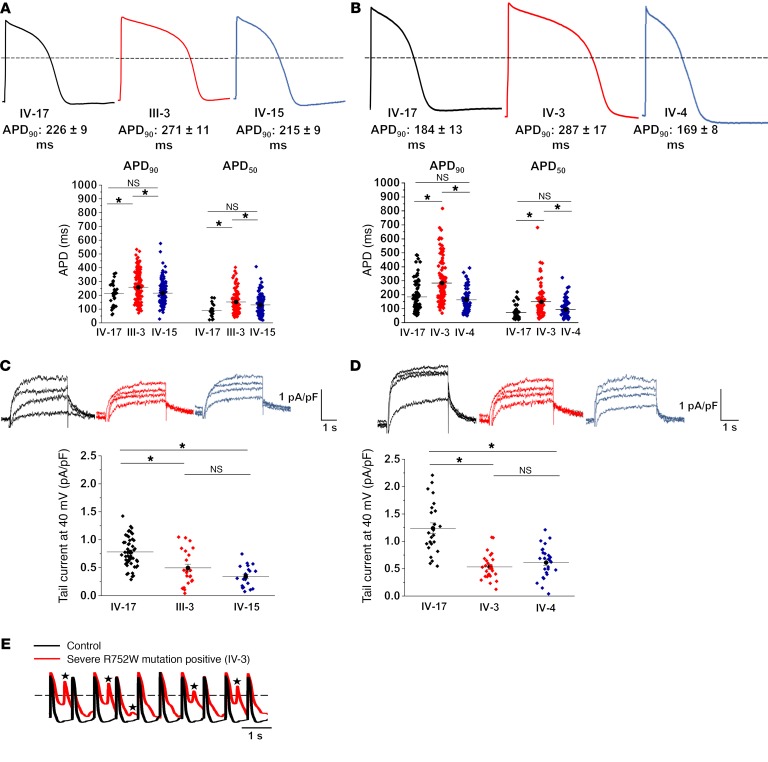
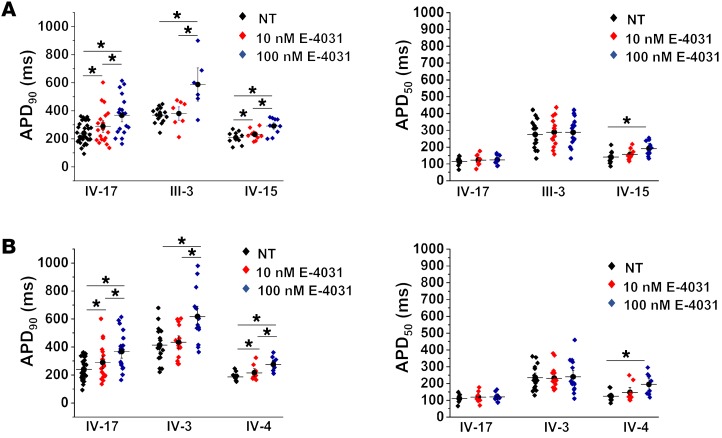
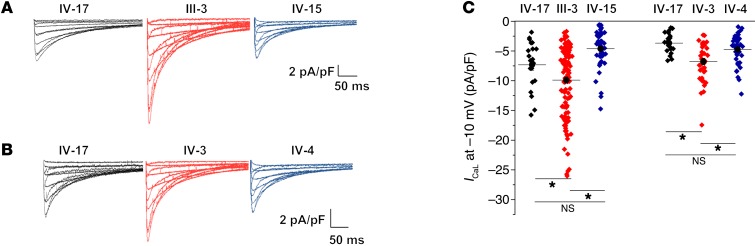
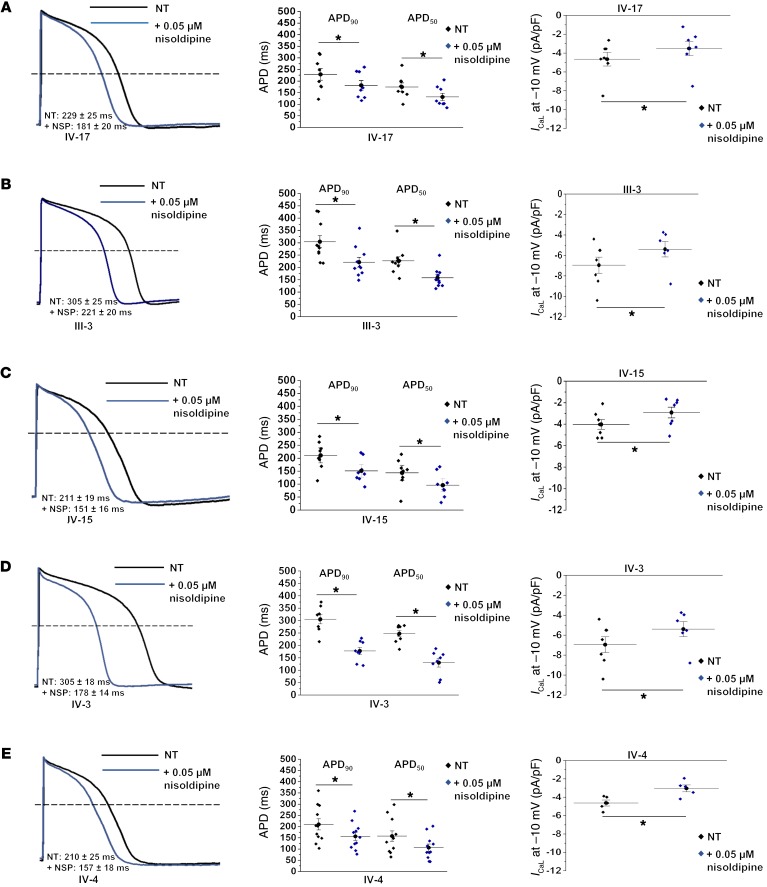
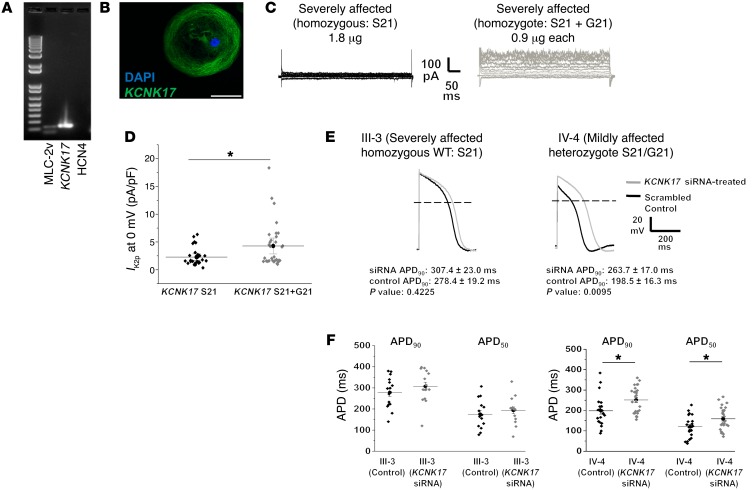
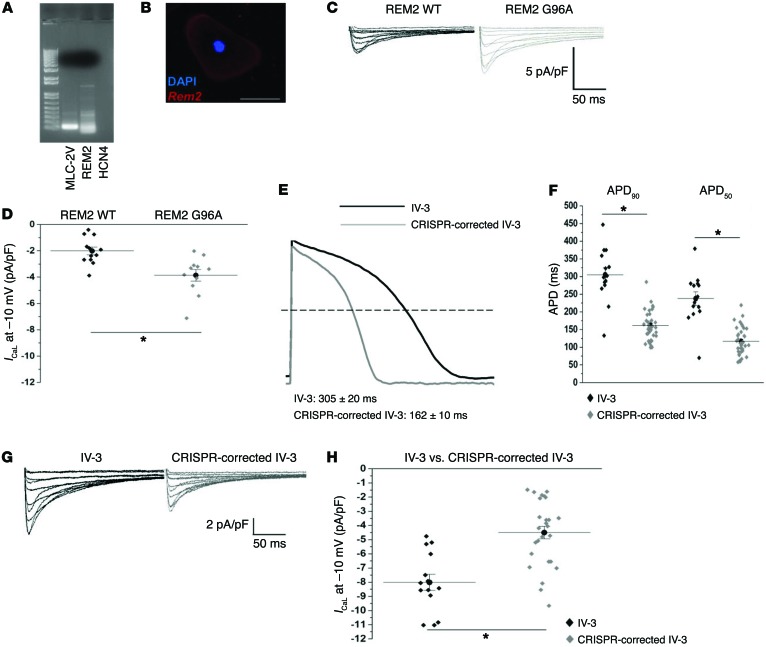
Congenital long QT syndrome (LQTS) is an inherited channelopathy associated with life-threatening arrhythmias. LQTS type 2 (LQT2) is caused by mutations in KCNH2, which encodes the potassium channel hERG. We hypothesized that modifier genes are partly responsible for the variable phenotype severity observed in some LQT2 families. Here, we identified contributors to variable expressivity in an LQT2 family by using induced pluripotent stem cell-derived cardiomyocytes (iPSC-CMs) and whole exome sequencing in a synergistic manner. We found that iPSC-CMs recapitulated the clinical genotype-phenotype discordance in vitro. Importantly, iPSC-CMs derived from the severely affected LQT2 patients displayed prolonged action potentials compared with cells from mildly affected first-degree relatives. The iPSC-CMs derived from all patients with hERG R752W mutation displayed lower IKr amplitude. Interestingly, iPSC-CMs from severely affected mutation-positive individuals exhibited greater L-type Ca2+ current. Whole exome sequencing identified variants of KCNK17 and the GTP-binding protein REM2, providing biologically plausible explanations for this variable expressivity. Genome editing to correct a REM2 variant reversed the enhanced L-type Ca2+ current and prolonged action potential observed in iPSC-CMs from severely affected individuals. Thus, our findings showcase the power of combining complementary physiological and genomic analyses to identify genetic modifiers and potential therapeutic targets of a monogenic disorder. Furthermore, we propose that this strategy can be deployed to unravel myriad confounding pathologies displaying variable expressivity.

Keywords: Arrhythmias; Cardiology; Genetics; Ion channels; iPS cells.


Conflict of interest statement

Conflict of interest: The authors have declared that no conflict of interest exists.

Figures

Figure 1
Figure 1. Clinical details of carrier pairs in Cleveland LQT2 family.
Zoomed-in snapshot of the family pedigree that focuses on 5 individuals of the family we used to generate the carrier pairs along with their relevant patient history (see Methods for in-depth explanation of patient selection and phenotype binning criteria and Supplemental Table 2 for clinical details on all 26 R752W mutation–positive individuals). Individuals are referenced first by the generation number and then by the family member number, read from left to right (e.g., IV-3 is generation 4, family member 3). This reference system is used throughout the paper. The black square is the hERG mutation negative healthy male control. Blue circles and squares are females and males, respectively, who are mildly-affected-phenotype hERG R752W mutation–positive relatives. Red circles and squares are severely-affected-phenotype hERG R752W mutation–positive relatives. Hatched circles and squares are females and males, respectively, who are hERG R752W-carrying individuals who are not fully characterized in this study.
Figure 2
Figure 2. LQT2 genotype-phenotype discordance reproduced in patient-specific iPSC-CMs.
(A) Representative action potential traces from the control (IV-7), a severely-affected-phenotype LQT2 male (III-3), and his son, a hERG R752W mutant–positive, mildly-affected-phenotype male (IV-15). Summary APD90 (90% of repolarization) and APD50 (50% of repolarization) data are also shown (below traces). (B) Representative action potential traces from the control (IV-17) and the second pair (sister pair), a severely affected LQT2 female (IV-3) and a hERG R752W mutant–positive, mildly affected female (IV-4). Summary APD90 and APD50 data are shown (below traces). (C) Representative IKr traces and respective summary IKr tail current density from each patient-derived iPSC-CM depicted in A. (D) Representative IKr traces and respective summary IKr tail current density for each patient-derived iPSC-CM depicted in B. (E) A 1-Hz paced action potential train from IV-17 and IV-3 iPSC-CMs. Stars denote early afterdepolarizations. Dashed line in APD traces denotes 0 mV. Between 30 and 203 cells from 9 different iPSC clones (3 each from IV-17, III-3, IV-15 paired trio) were analyzed in A and C. Between 77 and 134 cells from 9 different iPSC clones (3 each from IV-17, IV-3, IV-4 paired trio) were analyzed in B and D. Exact numbers of replicate measures (n) for each are listed in Supplemental Table 3. Results are shown as mean ± SEM. *Statistical significance (P < 0.05) as determined by ANOVA in the summary data for AD.
Figure 3
Figure 3. Effects of IKr blockade on severely and mildly affected patient iPSC-CMs.
(A and B) The effects of E-4031 (hERG channel blocker) at 2 different concentrations on the IV-17, III-3, and IV-15 trio as well as the IV-17, IV-3, and IV-4 trio. Between 8 and 32 cells were analyzed per E-4031 treatment condition for APD in A and B. NT, no treatment. *Statistical significance (P < 0.05) as determined by ANOVA in A and B.
Figure 4
Figure 4. L-type calcium current density increase revealed by patient-specific iPSC-CMs.
(A) Representative macroscopic whole-cell L-type Ca2+ (ICaL) traces from the IV-17, III-3, and IV-15 paired trio. (B) ICaL from the IV-17, IV-3, and IV-4 paired trio. (C) Summary data from A and B. Between 24 and 95 cells from 9 different iPSC clones (3 each from IV-17, III-3, IV-15 paired trio) were analyzed in A. Between 20 and 47 cells from 9 different iPSC clones (3 each from IV-17, IV-3, IV-4 paired trio) were analyzed in B. *Statistical significance (P < 0.05) as determined by ANOVA in C.
Figure 5
Figure 5. Nisoldipine reveals increased ICaL sensitivity in severely affected iPSC-CMs.
(AE) The effect of 0.05 μM nisoldipine on both trios. Data are depicted as macroscopic action potential record, APD summary data, and ICaL comparison between no drug and nisoldipine. Between 8 and 11 cells were analyzed for the effects of nisoldipine on APD and 5–8 cells for the effects of nisoldipine on ICaL in AE. See Supplemental Table 4 for exact numbers of replicate measures (n) and statistical analysis (paired Student’s t test). Dose-response relationship for nisoldipine (Supplemental Figure 1) was determined before selection of the concentration used in these experiments (a concentration lower than EC50 was chosen because the objective was to shorten the APD and ICaL to levels more like those of control iPSC-CMs). *P < 0.05; as determined by paired 2-tailed Student’s t test.
Figure 6
Figure 6. Two-pore potassium channel KCNK17 variant produces significant increase in K2p current.
(A) Single-cell RT-PCR confirms KCNK17 expression and ventricular lineage in electrophysiology-verified ventricular patient iPSC-CMs. MLC-2v, myosin light chain 2 ventricle (ventricular lineage marker); HCN4, hyperpolarization-activated cyclic nucleotide-gated potassium channel 4 (pacemaker lineage marker). (B) Immunohistochemistry confirms KCNK17 expression in iCell ventricular cardiomyocyte. Blue, nucleus; green, KCNK17. Scale bar: 50 μm. (C) Representative macroscopic current-voltage traces obtained from homozygous WT (KCNK17 S21 only, mimics severely affected patient alleles) and heterozygous state (KCNK17 S21 + G21, mimics mildly affected patient alleles). (D) Mean current density analyzed at 0 mV between WT and heterozygote conditions from 3 independent experiments. Relative current KCNK17 S21: 2.27 ± 0.30 (n = 29); and KCNK17 S21 + G21: 4.28 ± 0.70 (n = 32). *P = 0.01 as determined by unpaired Student’s t test. Results normalized to capacitance and shown as mean ± SEM. (E) Representative macroscopic action potential traces following KCNK17 siRNA silencing (gray) compared with scrambled control (black) in III-3 (P = 0.42, n = 15 in each group) and IV-4 (P = 0.01, n = 21 in control, n = 27 in siRNA) as determined by unpaired Student’s t test. (F) Summary APD90 and APD50 data from III-3 and IV-4 in control versus KCNK17 siRNA groups. *P < 0.02 as determined by unpaired Student’s t test. No significant changes were observed in mean diastolic potential (MDP) or action potential amplitude (APA) between siRNA and control recordings from III-3. MDP was unchanged in IV-4, but APA was higher in the siRNA group (100.26 ± 2.73 mV) compared with control (87.24 ± 2.18 mV) (Supplemental Table 6).
Figure 7
Figure 7. REM2 variant found in severely affected individuals drives significant increase in ICaL, but is reverted back to WT levels with CRISPR/Cas9–mediated gene correction.
(A) Single-cell RT-PCR confirmation of REM2 expression and ventricular lineage in electrophysiology-verified ventricular patient iPSC-CMs (IV-3–derived cell shown here). MLC-2v, myosin light chain 2 ventricle (ventricular lineage marker); HCN4, hyperpolarization-activated cyclic nucleotide-gated potassium channel 4 (pacemaker lineage marker). (B) Immunohistochemical confirmation of REM2 expression in an iCell ventricular cardiomyocyte. Blue, nucleus; red, REM2. Scale bar: 50 μm. (C) Macroscopic L-type Ca2+ currents obtained from iCell ventricular cardiomyocytes transfected with either REM2 wild type or REM2 G96A (mimicking the SNP found in severely affected hERG R752W mutation–positive individuals, III-3 and IV-3). (D) Summary data of REM2 WT overexpression (2 μg cDNA) in iCell ventricular cardiomyocytes compared with REM2 G96A. REM2 WT and REM2 G96A are composed of 3 independent experiments (REM2 WT n = 12, REM2 G96A n = 11). Relative current for REM2 WT at 0 mV, –2.21 ± –0.34, compared with REM2 G96A, –3.60 ± –0.39. *P = 0.002 as determined by unpaired Student’s t test. (E) The effects of CRISPR/Cas9–mediated correction of the REM2 G96A mutant allele back to the wild type (from A96 to G96) on APD90 (macroscopic action potential record shown). (F) Summary APD90 and APD50 data from IV-3 compared with CRISPR-corrected IV-3. (G) Macroscopic raw traces of L-type calcium current comparing IV-3 against CRISPR-corrected IV-3. (H) Summary L-type calcium current data comparing IV-3 against CRISPR-corrected IV-3. See Supplemental Table 8 for exact numbers of replicate measures (n) and statistical analysis. Three separate CRISPR/Cas9–corrected differentiations were characterized for data shown in EH. *Statistical significance (P < 0.05) as determined by unpaired Student’s t test in F and H.

References

    1. Priori SG, et al. Genetic and molecular basis of cardiac arrhythmias: impact on clinical management parts I and II. Circulation. 1999;99(4):518–528. doi: 10.1161/01.CIR.99.4.518. - DOI - PubMed
    1. Morita H, Wu J, Zipes DP. The QT syndromes: long and short. Lancet. 2008;372(9640):750–763. doi: 10.1016/S0140-6736(08)61307-0. - DOI - PubMed
    1. Schwartz PJ, et al. Prevalence of the congenital long-QT syndrome. Circulation. 2009;120(18):1761–1767. doi: 10.1161/CIRCULATIONAHA.109.863209. - DOI - PMC - PubMed
    1. George AL., Jr Molecular and genetic basis of sudden cardiac death. J Clin Invest. 2013;123(1):75–83. doi: 10.1172/JCI62928. - DOI - PMC - PubMed
    1. Curran ME, Splawski I, Timothy KW, Vincent GM, Green ED, Keating MT. A molecular basis for cardiac arrhythmia: HERG mutations cause long QT syndrome. Cell. 1995;80(5):795–803. doi: 10.1016/0092-8674(95)90358-5. - DOI - PubMed

Publication types

MeSH terms

Supplementary concepts