

Clinical and Patient-Centered Outcomes in Obese Patients With Type 2 Diabetes 3 Years After Randomization to Roux-en-Y Gastric Bypass Surgery Versus Intensive Lifestyle Management: The SLIMM-T2D Study
- PMID: 29432125
- PMCID: PMC5860843
- DOI: 10.2337/dc17-0487
Clinical and Patient-Centered Outcomes in Obese Patients With Type 2 Diabetes 3 Years After Randomization to Roux-en-Y Gastric Bypass Surgery Versus Intensive Lifestyle Management: The SLIMM-T2D Study
Abstract
Objective: To compare the effect of Roux-en-Y gastric bypass (RYGB) surgery versus intensive medical diabetes and weight management (IMWM) on clinical and patient-reported outcomes in obese patients with type 2 diabetes.
Research design and methods: We prospectively randomized 38 obese patients with type 2 diabetes (15 male and 23 female, with mean ± SD weight 104 ± 16 kg, BMI 36.3 ± 3.4 kg/m2, age 52 ± 6 years, and HbA1c 8.5 ± 1.3% [69 ± 14 mmol/mol]) to laparoscopic RYGB (n = 19) or IMWM (n = 19). Changes in weight, HbA1c, cardiovascular risk factors (UKPDS risk engine), and self-reported health status (the 36-Item Short-Form [SF-36] survey, Impact of Weight on Quality of Life [IWQOL] instrument, and Problem Areas in Diabetes Survey [PAID]) were assessed.
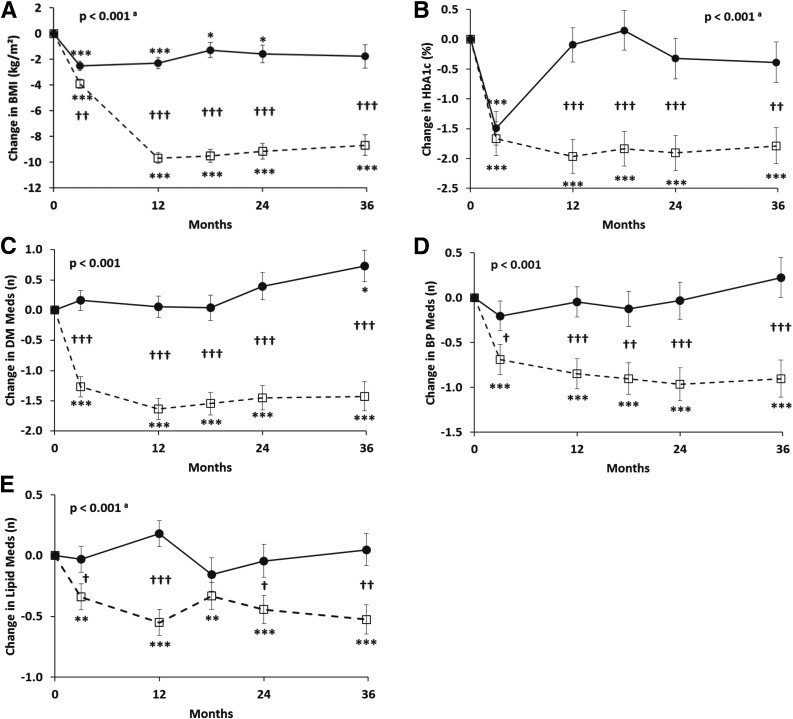
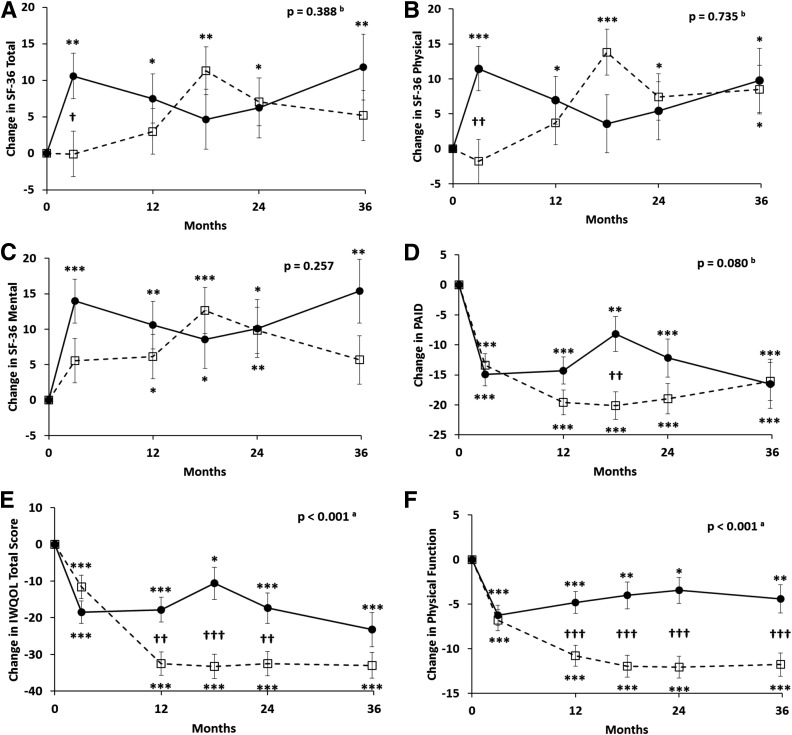
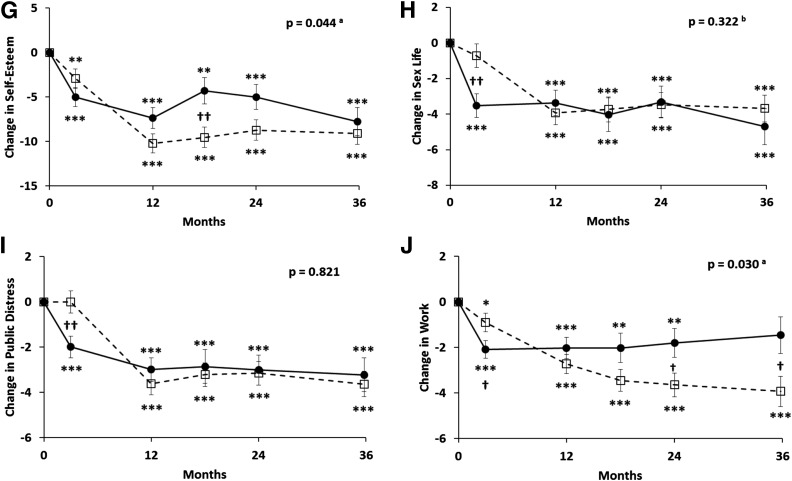
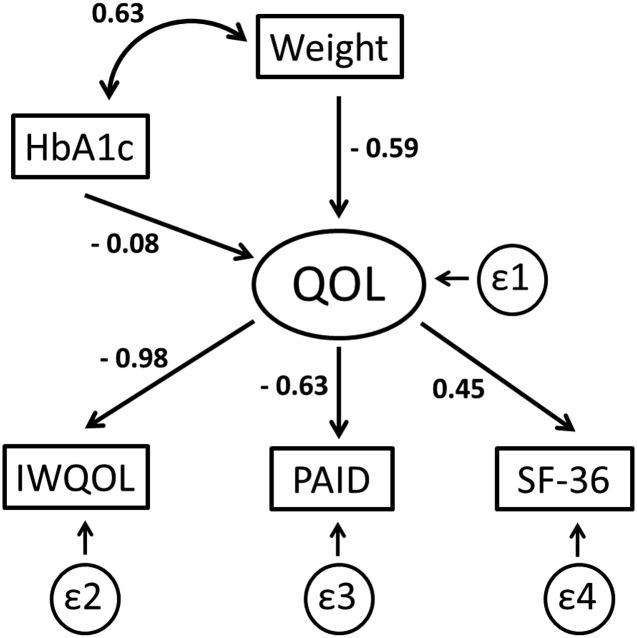
Results: After 3 years, the RYGB group had greater weight loss (mean -24.9 kg [95% CI -29.5, -20.4] vs. -5.2 [-10.3, -0.2]; P < 0.001) and lowering of HbA1c (-1.79% [-2.38, -1.20] vs. -0.39% [-1.06, 0.28] [-19.6 mmol/mol {95% CI -26.0, -13.1} vs. -4.3 {-11.6, 3.1}]; P < 0.001) compared with the IMWM group. Changes in cardiometabolic risk for coronary heart disease and stroke were all more favorable in RYGB versus IMWM (P < 0.05 to P < 0.01). IWQOL improved more after RYGB (P < 0.001), primarily due to subscales of physical function, self-esteem, and work performance. SF-36 and PAID scores improved in both groups, with no difference between treatments. A structural equation model demonstrated that improvement in overall quality of life was more strongly associated with weight loss than with improved HbA1c and was manifest by greater improvements in IWQOL than with either SF-36 or PAID.
Conclusions: Three years after randomization to RYGB versus IMWM, surgery produced greater weight loss, lower HbA1c, reduced cardiovascular risk, and improvements in obesity-related quality of life in obese patients with type 2 diabetes.
Trial registration: ClinicalTrials.gov NCT01073020.
© 2018 by the American Diabetes Association.
Figures
References
-
- Ali MK, Bullard KM, Saaddine JB, Cowie CC, Imperatore G, Gregg EW. Achievement of goals in U.S. diabetes care, 1999-2010. N Engl J Med 2013;368:1613–1624 - PubMed
-
- Franz MJ, Boucher JL, Rutten-Ramos S, VanWormer JJ. Lifestyle weight-loss intervention outcomes in overweight and obese adults with type 2 diabetes: a systematic review and meta-analysis of randomized clinical trials. J Acad Nutr Diet 2015;115:1447–1463 - PubMed
-
- Karlsson J, Taft C, Rydén A, Sjöström L, Sullivan M. Ten-year trends in health-related quality of life after surgical and conventional treatment for severe obesity: the SOS intervention study. Int J Obes 2007;31:1248–1261 - PubMed
-
- Kolotkin RL, Crosby RD, Williams GR, Hartley GG, Nicol S. The relationship between health-related quality of life and weight loss. Obes Res 2001;9:564–571 - PubMed
Publication types
MeSH terms
Substances
Associated data
Grants and funding
LinkOut - more resources
Full Text Sources
Other Literature Sources
Medical
Research Materials
Miscellaneous
