

Thymic involution and rising disease incidence with age
- PMID: 29432166
- PMCID: PMC5828591
- DOI: 10.1073/pnas.1714478115
Thymic involution and rising disease incidence with age
Abstract
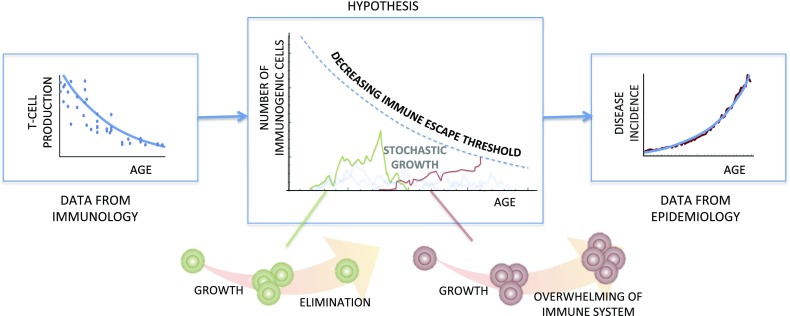
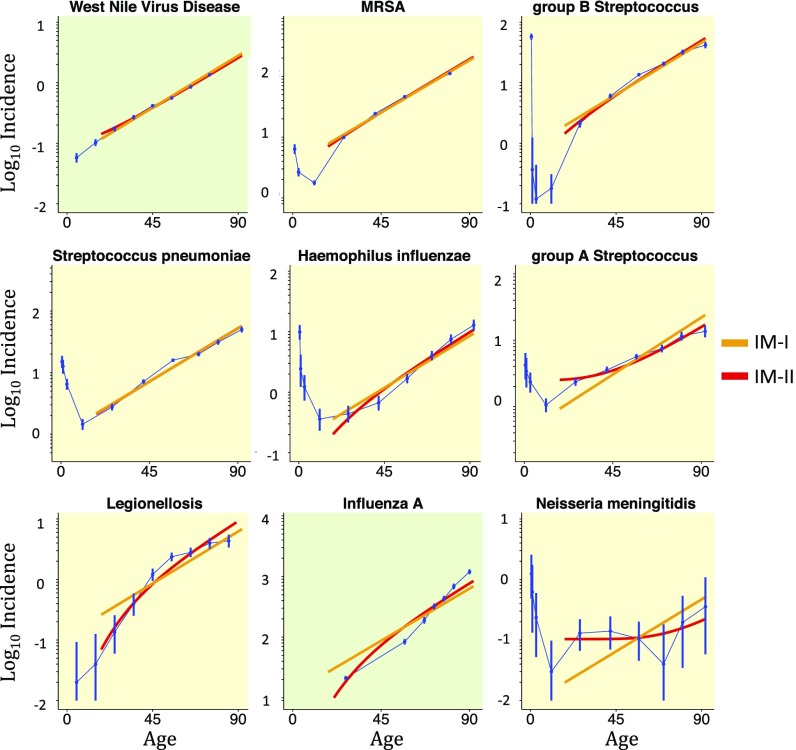
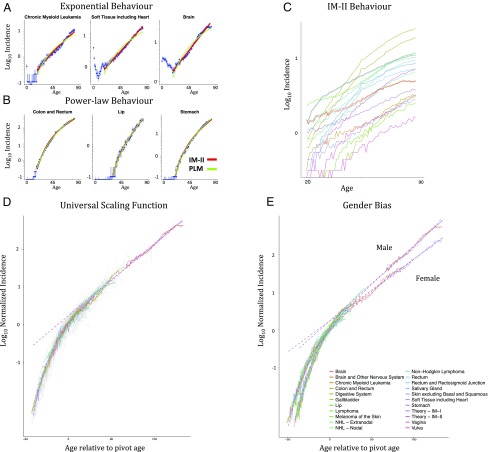
For many cancer types, incidence rises rapidly with age as an apparent power law, supporting the idea that cancer is caused by a gradual accumulation of genetic mutations. Similarly, the incidence of many infectious diseases strongly increases with age. Here, combining data from immunology and epidemiology, we show that many of these dramatic age-related increases in incidence can be modeled based on immune system decline, rather than mutation accumulation. In humans, the thymus atrophies from infancy, resulting in an exponential decline in T cell production with a half-life of ∼16 years, which we use as the basis for a minimal mathematical model of disease incidence. Our model outperforms the power law model with the same number of fitting parameters in describing cancer incidence data across a wide spectrum of different cancers, and provides excellent fits to infectious disease data. This framework provides mechanistic insight into cancer emergence, suggesting that age-related decline in T cell output is a major risk factor.
Keywords: T cell; cancer; driver mutations; infectious disease; thymus.
Copyright © 2018 the Author(s). Published by PNAS.
Conflict of interest statement
The authors declare no conflict of interest.
Figures
Comment in
-
Are most cancer cases a consequence of an immune deficiency caused by thymic involution?Proc Natl Acad Sci U S A. 2018 May 8;115(19):E4314-E4315. doi: 10.1073/pnas.1803180115. Epub 2018 Apr 18. Proc Natl Acad Sci U S A. 2018. PMID: 29669914 Free PMC article. No abstract available.
-
Strengthening the immune system for cancer prevention.Proc Natl Acad Sci U S A. 2018 May 8;115(19):E4316-E4317. doi: 10.1073/pnas.1802584115. Epub 2018 Apr 18. Proc Natl Acad Sci U S A. 2018. PMID: 29669915 Free PMC article. No abstract available.
-
Shortcomings of the immunological model of carcinogenesis.Proc Natl Acad Sci U S A. 2018 May 8;115(19):E4318. doi: 10.1073/pnas.1802507115. Epub 2018 Apr 18. Proc Natl Acad Sci U S A. 2018. PMID: 29669916 Free PMC article. No abstract available.
-
Reply to Jiménez-Alonso et al., Schooling and Zhao, and Mortazavi: Further discussion on the immunological model of carcinogenesis.Proc Natl Acad Sci U S A. 2018 May 8;115(19):E4319-E4321. doi: 10.1073/pnas.1802809115. Epub 2018 Apr 18. Proc Natl Acad Sci U S A. 2018. PMID: 29669926 Free PMC article. No abstract available.
References
-
- van den Dool C, de Boer RJ. The effects of age, thymectomy, and HIV Infection on alpha and beta TCR excision circles in naive T cells. J Immunol. 2006;177:4391–4401. - PubMed
-
- Murray JM, et al. Naive T cells are maintained by thymic output in early ages but by proliferation without phenotypic change after age twenty. Immunol Cell Biol. 2003;81:487–495. - PubMed
-
- Douek DC, et al. Changes in thymic function with age and during the treatment of HIV infection. Nature. 1998;396:690–695. - PubMed
Publication types
MeSH terms
Grants and funding
LinkOut - more resources
Full Text Sources
Other Literature Sources
Medical
