

General amino acid control in fission yeast is regulated by a nonconserved transcription factor, with functions analogous to Gcn4/Atf4
- PMID: 29432178
- PMCID: PMC5828588
- DOI: 10.1073/pnas.1713991115
General amino acid control in fission yeast is regulated by a nonconserved transcription factor, with functions analogous to Gcn4/Atf4
Abstract
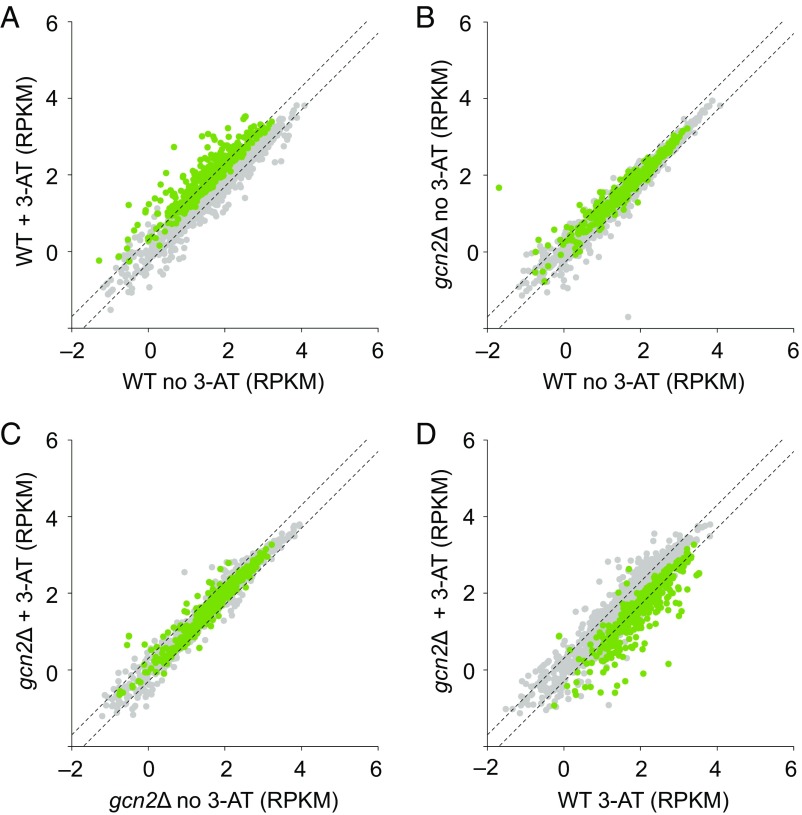
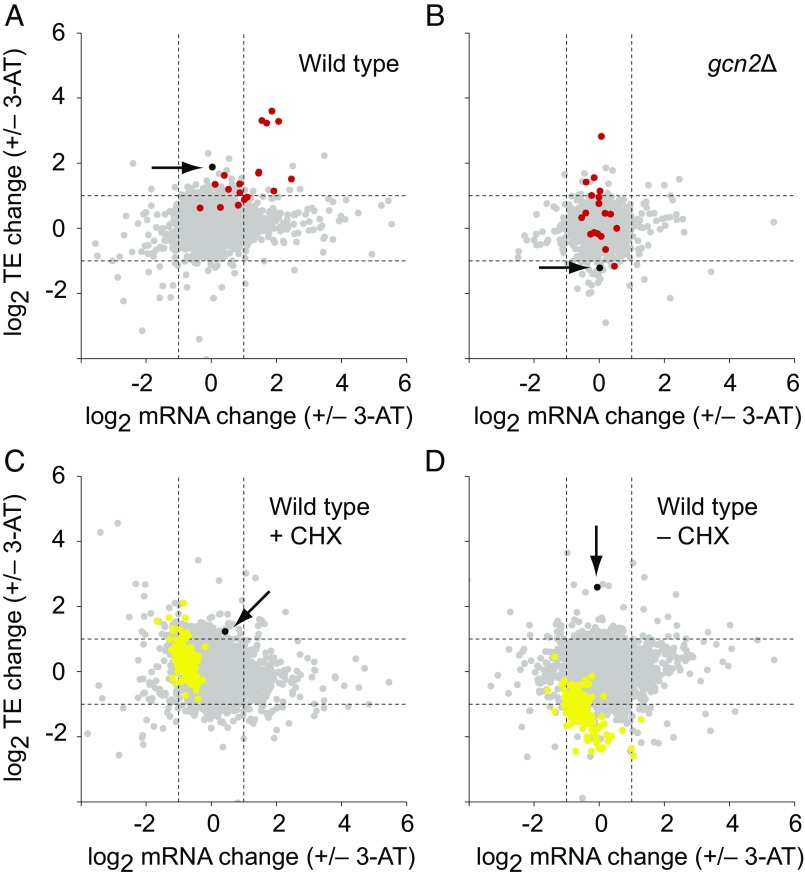
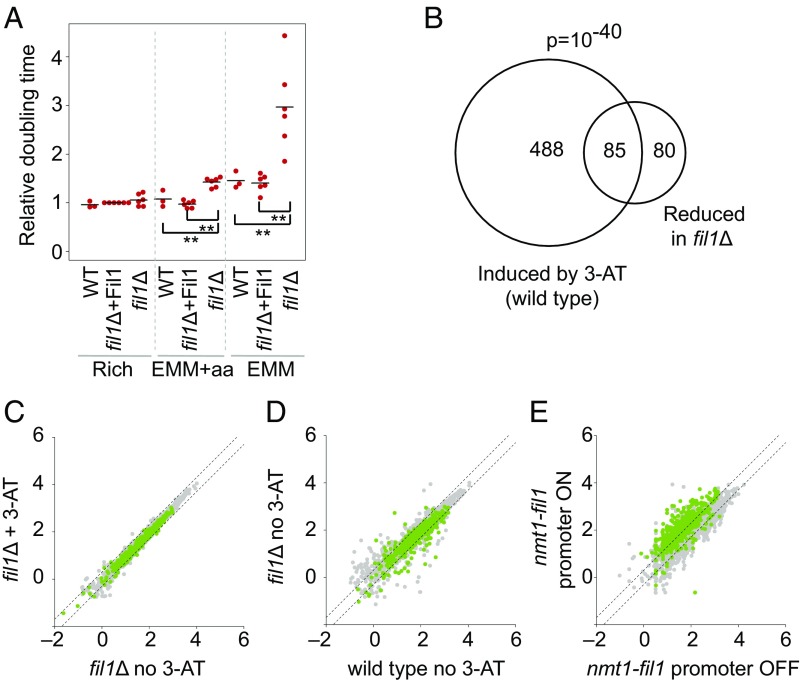
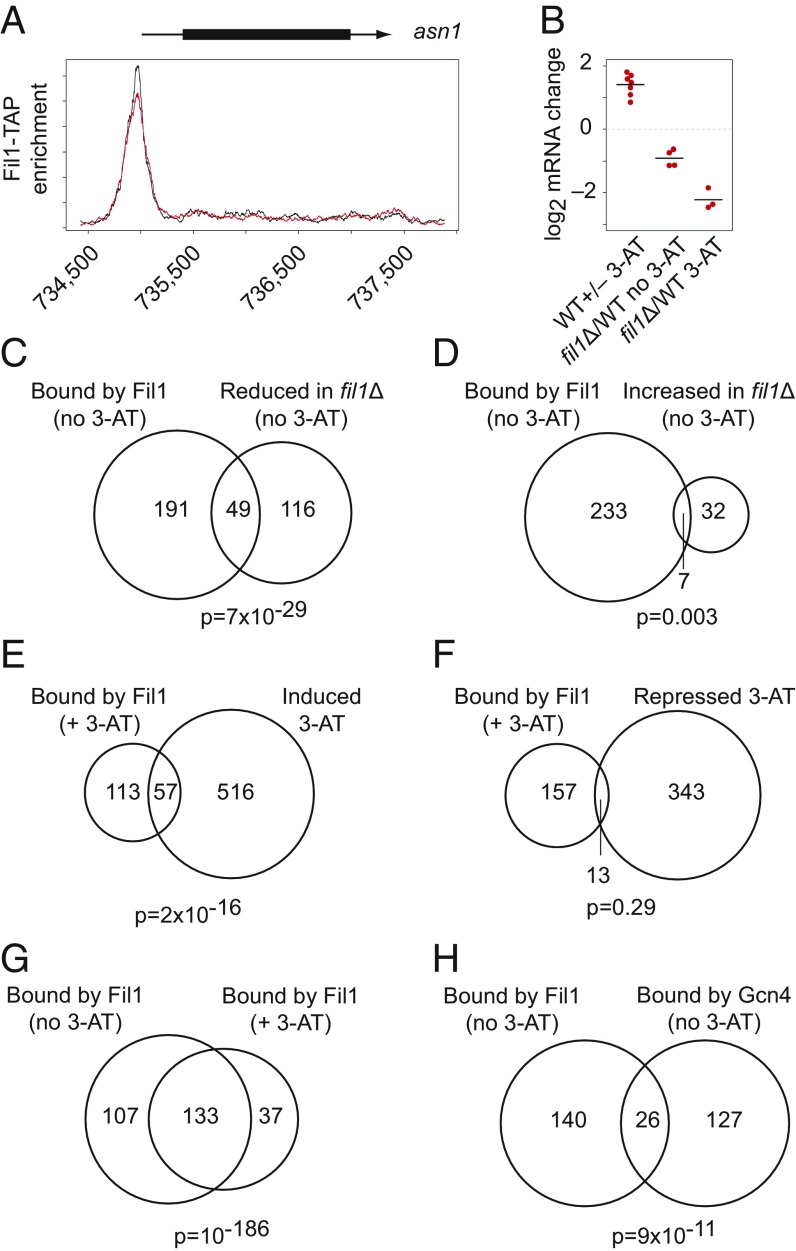
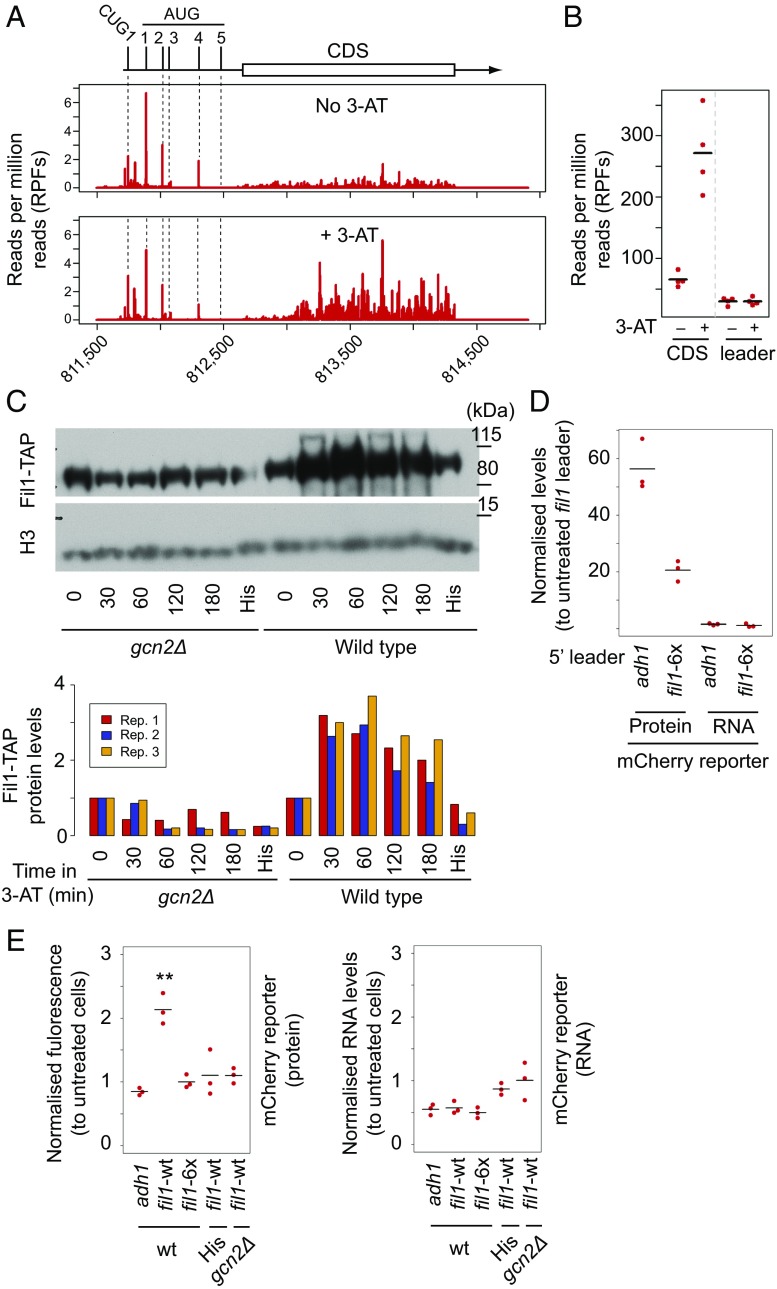
Eukaryotes respond to amino acid starvation by enhancing the translation of mRNAs encoding b-ZIP family transcription factors (GCN4 in Saccharomyces cerevisiae and ATF4 in mammals), which launch transcriptional programs to counter this stress. This pathway involves phosphorylation of the eIF2 translation factor by Gcn2-protein kinases and is regulated by upstream ORFs (uORFs) in the GCN4/ATF4 5' leaders. Here, we present evidence that the transcription factors that mediate this response are not evolutionarily conserved. Although cells of the fission yeast Schizosaccharomyces pombe respond transcriptionally to amino acid starvation, they lack clear Gcn4 and Atf4 orthologs. We used ribosome profiling to identify mediators of this response in S. pombe, looking for transcription factors that behave like GCN4 We discovered a transcription factor (Fil1) translationally induced by amino acid starvation in a 5' leader and Gcn2-dependent manner. Like Gcn4, Fil1 is required for the transcriptional response to amino acid starvation, and Gcn4 and Fil1 regulate similar genes. Despite their similarities in regulation, function, and targets, Fil1 and Gcn4 belong to different transcription factor families (GATA and b-ZIP, respectively). Thus, the same functions are performed by nonorthologous proteins under similar regulation. These results highlight the plasticity of transcriptional networks, which maintain conserved principles with nonconserved regulators.
Keywords: ATF4; GCN4; fission yeast; ribosome profiling; translational control.
Conflict of interest statement
The authors declare no conflict of interest.
Figures
Similar articles
-
A single inhibitory upstream open reading frame (uORF) is sufficient to regulate Candida albicans GCN4 translation in response to amino acid starvation conditions.RNA. 2014 Apr;20(4):559-67. doi: 10.1261/rna.042267.113. Epub 2014 Feb 25. RNA. 2014. PMID: 24570481 Free PMC article.
-
Gene-specific translational control of the yeast GCN4 gene by phosphorylation of eukaryotic initiation factor 2.Mol Microbiol. 1993 Oct;10(2):215-23. doi: 10.1111/j.1365-2958.1993.tb01947.x. Mol Microbiol. 1993. PMID: 7934812 Review.
-
Gcn2 mediates Gcn4 activation in response to glucose stimulation or UV radiation not via GCN4 translation.J Biol Chem. 2001 May 18;276(20):16944-51. doi: 10.1074/jbc.M100383200. Epub 2001 Feb 28. J Biol Chem. 2001. PMID: 11350978
-
Transcription factor GCN4 for control of amino acid biosynthesis also regulates the expression of the gene for lipoamide dehydrogenase.Biochem J. 1999 Jun 15;340 ( Pt 3)(Pt 3):855-62. Biochem J. 1999. PMID: 10359673 Free PMC article.
-
Origin of translational control by eIF2α phosphorylation: insights from genome-wide translational profiling studies in fission yeast.Curr Genet. 2021 Jun;67(3):359-368. doi: 10.1007/s00294-020-01149-w. Epub 2021 Jan 9. Curr Genet. 2021. PMID: 33420908 Free PMC article. Review.
Cited by
-
Magnesium depletion extends fission yeast lifespan via general amino acid control activation.Microbiologyopen. 2021 Mar;10(2):e1176. doi: 10.1002/mbo3.1176. Microbiologyopen. 2021. PMID: 33970532 Free PMC article.
-
Leucine depletion extends the lifespans of leucine-auxotrophic fission yeast by inducing Ecl1 family genes via the transcription factor Fil1.Mol Genet Genomics. 2019 Dec;294(6):1499-1509. doi: 10.1007/s00438-019-01592-6. Epub 2019 Aug 27. Mol Genet Genomics. 2019. PMID: 31456006
-
Response to leucine in Schizosaccharomyces pombe (fission yeast).FEMS Yeast Res. 2022 Apr 26;22(1):foac020. doi: 10.1093/femsyr/foac020. FEMS Yeast Res. 2022. PMID: 35325114 Free PMC article. Review.
-
Global translation inhibition yields condition-dependent de-repression of ribosome biogenesis mRNAs.Nucleic Acids Res. 2019 Jun 4;47(10):5061-5073. doi: 10.1093/nar/gkz231. Nucleic Acids Res. 2019. PMID: 30937450 Free PMC article.
-
Research progress on the function and regulatory pathways of amino acid permeases in fungi.World J Microbiol Biotechnol. 2024 Nov 25;40(12):392. doi: 10.1007/s11274-024-04199-1. World J Microbiol Biotechnol. 2024. PMID: 39581943 Review.
References
-
- Spriggs KA, Bushell M, Willis AE. Translational regulation of gene expression during conditions of cell stress. Mol Cell. 2010;40:228–237. - PubMed
-
- Hinnebusch AG. Translational regulation of GCN4 and the general amino acid control of yeast. Annu Rev Microbiol. 2005;59:407–450. - PubMed
-
- Castilho BA, et al. Keeping the eIF2 alpha kinase Gcn2 in check. Biochim Biophys Acta. 2014;1843:1948–1968. - PubMed
Publication types
MeSH terms
Substances
Grants and funding
LinkOut - more resources
Full Text Sources
Other Literature Sources
Molecular Biology Databases
