Piezo2 channel regulates RhoA and actin cytoskeleton to promote cell mechanobiological responses
- PMID: 29432180
- PMCID: PMC5828612
- DOI: 10.1073/pnas.1718177115
Piezo2 channel regulates RhoA and actin cytoskeleton to promote cell mechanobiological responses
Abstract
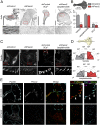
Actin polymerization and assembly into stress fibers (SFs) is central to many cellular processes. However, how SFs form in response to the mechanical interaction of cells with their environment is not fully understood. Here we have identified Piezo2 mechanosensitive cationic channel as a transducer of environmental physical cues into mechanobiological responses. Piezo2 is needed by brain metastatic cells from breast cancer (MDA-MB-231-BrM2) to probe their physical environment as they anchor and pull on their surroundings or when confronted with confined migration through narrow pores. Piezo2-mediated Ca2+ influx activates RhoA to control the formation and orientation of SFs and focal adhesions (FAs). A possible mechanism for the Piezo2-mediated activation of RhoA involves the recruitment of the Fyn kinase to the cell leading edge as well as calpain activation. Knockdown of Piezo2 in BrM2 cells alters SFs, FAs, and nuclear translocation of YAP; a phenotype rescued by overexpression of dominant-positive RhoA or its downstream effector, mDia1. Consequently, hallmarks of cancer invasion and metastasis related to RhoA, actin cytoskeleton, and/or force transmission, such as migration, extracellular matrix degradation, and Serpin B2 secretion, were reduced in cells lacking Piezo2.
Keywords: RhoA; actin stress fibers; calcium signaling; cancer; mechanotransduction.
Conflict of interest statement
The authors declare no conflict of interest.
Figures


Similar articles
-
YAP regulates cell mechanics by controlling focal adhesion assembly.Nat Commun. 2017 May 15;8:15321. doi: 10.1038/ncomms15321. Nat Commun. 2017. PMID: 28504269 Free PMC article.
-
Gonadotropin-releasing hormone receptor activates GTPase RhoA and inhibits cell invasion in the breast cancer cell line MDA-MB-231.BMC Cancer. 2012 Nov 23;12:550. doi: 10.1186/1471-2407-12-550. BMC Cancer. 2012. PMID: 23176180 Free PMC article.
-
Mechanosensitive ion channel Piezo2 is important for enterochromaffin cell response to mechanical forces.J Physiol. 2017 Jan 1;595(1):79-91. doi: 10.1113/JP272718. Epub 2016 Aug 13. J Physiol. 2017. PMID: 27392819 Free PMC article.
-
FilGAP and its close relatives: a mediator of Rho-Rac antagonism that regulates cell morphology and migration.Biochem J. 2013 Jul 1;453(1):17-25. doi: 10.1042/BJ20130290. Biochem J. 2013. PMID: 23763313 Review.
-
Regulation of RhoA activity by adhesion molecules and mechanotransduction.Curr Mol Med. 2014 Feb;14(2):199-208. doi: 10.2174/1566524014666140128104541. Curr Mol Med. 2014. PMID: 24467208 Free PMC article. Review.
Cited by
-
A dietary fatty acid counteracts neuronal mechanical sensitization.Nat Commun. 2020 Jun 19;11(1):2997. doi: 10.1038/s41467-020-16816-2. Nat Commun. 2020. PMID: 32561714 Free PMC article.
-
Mechano-Sensing Channel PIEZO2 Enhances Invasive Phenotype in Triple-Negative Breast Cancer.Int J Mol Sci. 2022 Aug 31;23(17):9909. doi: 10.3390/ijms23179909. Int J Mol Sci. 2022. PMID: 36077309 Free PMC article.
-
Dissemination of RasV12-transformed cells requires the mechanosensitive channel Piezo.Nat Commun. 2020 Jul 16;11(1):3568. doi: 10.1038/s41467-020-17341-y. Nat Commun. 2020. PMID: 32678085 Free PMC article.
-
3D Microfluidic Bone Tumor Microenvironment Comprised of Hydroxyapatite/Fibrin Composite.Front Bioeng Biotechnol. 2019 Jul 17;7:168. doi: 10.3389/fbioe.2019.00168. eCollection 2019. Front Bioeng Biotechnol. 2019. PMID: 31380359 Free PMC article.
-
Potassium channel-driven bioelectric signalling regulates metastasis in triple-negative breast cancer.EBioMedicine. 2022 Jan;75:103767. doi: 10.1016/j.ebiom.2021.103767. Epub 2021 Dec 18. EBioMedicine. 2022. PMID: 34933180 Free PMC article.
References
-
- Ridley AJ, et al. Cell migration: Integrating signals from front to back. Science. 2003;302:1704–1709. - PubMed
-
- Schwab A, Fabian A, Hanley PJ, Stock C. Role of ion channels and transporters in cell migration. Physiol Rev. 2012;92:1865–1913. - PubMed
-
- Mrkonjic S, Destaing O, Albiges-Rizo C. Mechanotransduction pulls the strings of matrix degradation at invadosome. Matrix Biol. 2017;57–58:190–203. - PubMed
-
- Leong HS, et al. Invadopodia are required for cancer cell extravasation and are a therapeutic target for metastasis. Cell Rep. 2014;8:1558–1570. - PubMed
Publication types
MeSH terms
Substances
Grants and funding
LinkOut - more resources
Full Text Sources
Other Literature Sources
Research Materials
Miscellaneous

