

Three classes of recurrent DNA break clusters in brain progenitors identified by 3D proximity-based break joining assay
- PMID: 29432181
- PMCID: PMC5828622
- DOI: 10.1073/pnas.1719907115
Three classes of recurrent DNA break clusters in brain progenitors identified by 3D proximity-based break joining assay
Abstract
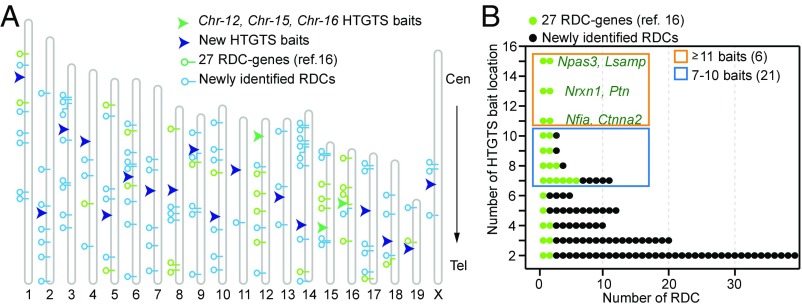
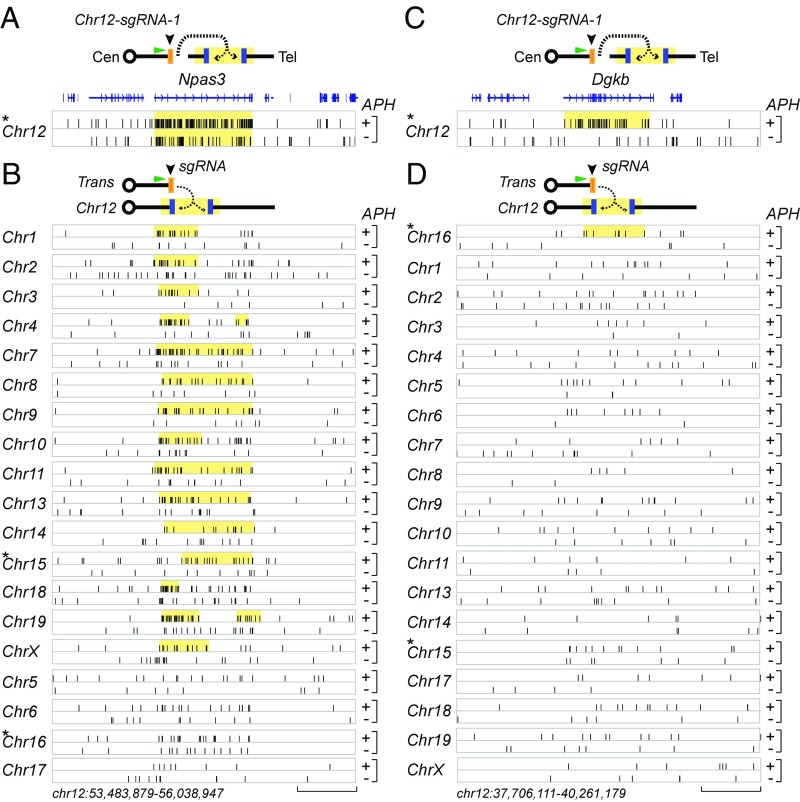
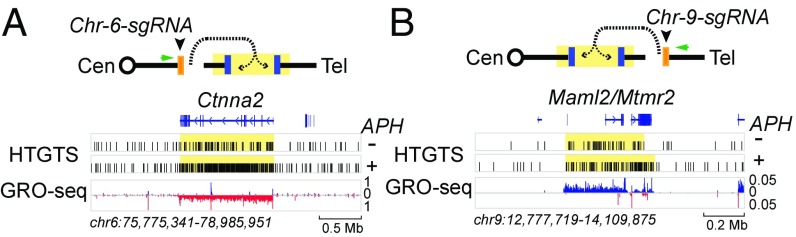
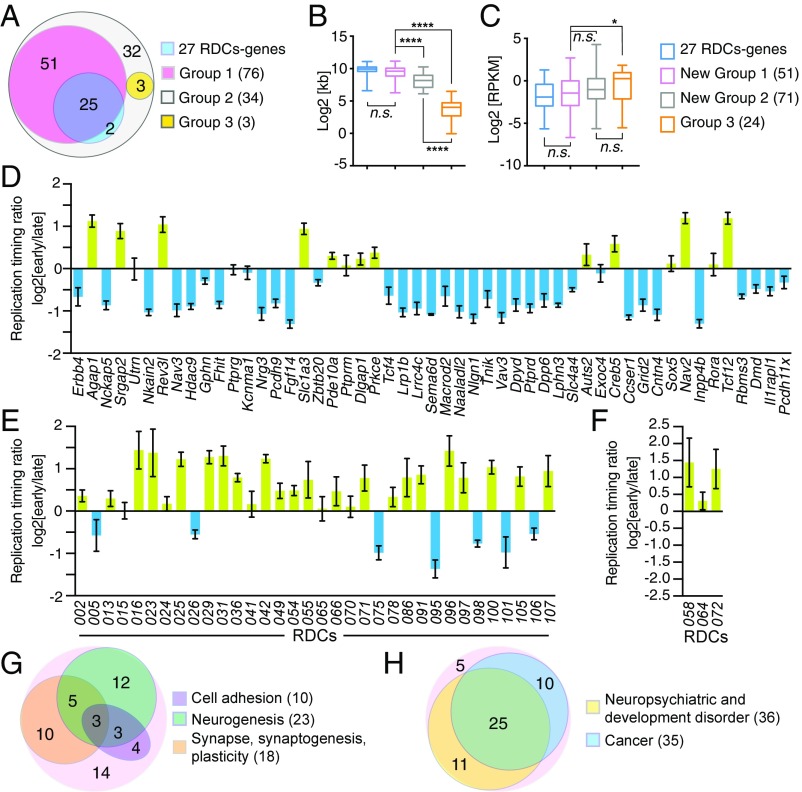
We recently discovered 27 recurrent DNA double-strand break (DSB) clusters (RDCs) in mouse neural stem/progenitor cells (NSPCs). Most RDCs occurred across long, late-replicating RDC genes and were found only after mild inhibition of DNA replication. RDC genes share intriguing characteristics, including encoding surface proteins that organize brain architecture and neuronal junctions, and are genetically implicated in neuropsychiatric disorders and/or cancers. RDC identification relies on high-throughput genome-wide translocation sequencing (HTGTS), which maps recurrent DSBs based on their translocation to "bait" DSBs in specific chromosomal locations. Cellular heterogeneity in 3D genome organization allowed unequivocal identification of RDCs on 14 different chromosomes using HTGTS baits on three mouse chromosomes. Additional candidate RDCs were also implicated, however, suggesting that some RDCs were missed. To more completely identify RDCs, we exploited our finding that joining of two DSBs occurs more frequently if they lie on the same cis chromosome. Thus, we used CRISPR/Cas9 to introduce specific DSBs into each mouse chromosome in NSPCs that were used as bait for HTGTS libraries. This analysis confirmed all 27 previously identified RDCs and identified many new ones. NSPC RDCs fall into three groups based on length, organization, transcription level, and replication timing of genes within them. While mostly less robust, the largest group of newly defined RDCs share many intriguing characteristics with the original 27. Our findings also revealed RDCs in NSPCs in the absence of induced replication stress, and support the idea that the latter treatment augments an already active endogenous process.
Keywords: neural stem cells; neurodevelopment; nonhomologous end-joining; recurrent DNA break clusters; replication stress.
Conflict of interest statement
The authors declare no conflict of interest.
Figures
Similar articles
-
Induction of recurrent break cluster genes in neural progenitor cells differentiated from embryonic stem cells in culture.Proc Natl Acad Sci U S A. 2020 May 12;117(19):10541-10546. doi: 10.1073/pnas.1922299117. Epub 2020 Apr 24. Proc Natl Acad Sci U S A. 2020. PMID: 32332169 Free PMC article.
-
Long Neural Genes Harbor Recurrent DNA Break Clusters in Neural Stem/Progenitor Cells.Cell. 2016 Feb 11;164(4):644-55. doi: 10.1016/j.cell.2015.12.039. Cell. 2016. PMID: 26871630 Free PMC article.
-
Transcription-associated processes cause DNA double-strand breaks and translocations in neural stem/progenitor cells.Proc Natl Acad Sci U S A. 2016 Feb 23;113(8):2258-63. doi: 10.1073/pnas.1525564113. Epub 2016 Feb 12. Proc Natl Acad Sci U S A. 2016. PMID: 26873106 Free PMC article.
-
DNA double-strand breaks as drivers of neural genomic change, function, and disease.DNA Repair (Amst). 2018 Nov;71:158-163. doi: 10.1016/j.dnarep.2018.08.019. Epub 2018 Aug 23. DNA Repair (Amst). 2018. PMID: 30195640 Free PMC article. Review.
-
Translocations in normal B cells and cancers: insights from new technical approaches.Adv Immunol. 2013;117:39-71. doi: 10.1016/B978-0-12-410524-9.00002-5. Adv Immunol. 2013. PMID: 23611285 Review.
Cited by
-
Linear interaction between replication and transcription shapes DNA break dynamics at recurrent DNA break Clusters.Nat Commun. 2024 Apr 27;15(1):3594. doi: 10.1038/s41467-024-47934-w. Nat Commun. 2024. PMID: 38678011 Free PMC article.
-
Heterogeneous interactions and polymer entropy decide organization and dynamics of chromatin domains.Biophys J. 2022 Jul 19;121(14):2794-2812. doi: 10.1016/j.bpj.2022.06.008. Epub 2022 Jun 6. Biophys J. 2022. PMID: 35672951 Free PMC article.
-
Induction of recurrent break cluster genes in neural progenitor cells differentiated from embryonic stem cells in culture.Proc Natl Acad Sci U S A. 2020 May 12;117(19):10541-10546. doi: 10.1073/pnas.1922299117. Epub 2020 Apr 24. Proc Natl Acad Sci U S A. 2020. PMID: 32332169 Free PMC article.
-
Causes and consequences of DNA double-stranded breaks in cardiovascular disease.Mol Cell Biochem. 2025 Apr;480(4):2043-2064. doi: 10.1007/s11010-024-05131-9. Epub 2024 Oct 15. Mol Cell Biochem. 2025. PMID: 39404936 Review.
-
Detection and analysis of complex structural variation in human genomes across populations and in brains of donors with psychiatric disorders.Cell. 2024 Nov 14;187(23):6687-6706.e25. doi: 10.1016/j.cell.2024.09.014. Epub 2024 Sep 30. Cell. 2024. PMID: 39353437
References
-
- Taccioli GE, et al. Impairment of V(D)J recombination in double-strand break repair mutants. Science. 1993;260:207–210. - PubMed
-
- Li Z, et al. The XRCC4 gene encodes a novel protein involved in DNA double-strand break repair and V(D)J recombination. Cell. 1995;83:1079–1089. - PubMed
-
- Gao Y, et al. A critical role for DNA end-joining proteins in both lymphogenesis and neurogenesis. Cell. 1998;95:891–902. - PubMed
-
- Barnes DE, Stamp G, Rosewell I, Denzel A, Lindahl T. Targeted disruption of the gene encoding DNA ligase IV leads to lethality in embryonic mice. Curr Biol. 1998;8:1395–1398. - PubMed
Publication types
MeSH terms
Grants and funding
LinkOut - more resources
Full Text Sources
Other Literature Sources
Molecular Biology Databases
