. 2018 Feb 20;115(8):E1799-E1808.
doi: 10.1073/pnas.1714668115. Epub 2018 Feb 5.

Lipid bilayer composition modulates the unfolding free energy of a knotted α-helical membrane protein

Affiliations

Lipid bilayer composition modulates the unfolding free energy of a knotted α-helical membrane protein

M R Sanders et al. Proc Natl Acad Sci U S A. .

Abstract

α-Helical membrane proteins have eluded investigation of their thermodynamic stability in lipid bilayers. Reversible denaturation curves have enabled some headway in determining unfolding free energies. However, these parameters have been limited to detergent micelles or lipid bicelles, which do not possess the same mechanical properties as lipid bilayers that comprise the basis of natural membranes. We establish reversible unfolding of the membrane transporter LeuT in lipid bilayers, enabling the comparison of apparent unfolding free energies in different lipid compositions. LeuT is a bacterial ortholog of neurotransmitter transporters and contains a knot within its 12-transmembrane helical structure. Urea is used as a denaturant for LeuT in proteoliposomes, resulting in the loss of up to 30% helical structure depending upon the lipid bilayer composition. Urea unfolding of LeuT in liposomes is reversible, with refolding in the bilayer recovering the original helical structure and transport activity. A linear dependence of the unfolding free energy on urea concentration enables the free energy to be extrapolated to zero denaturant. Increasing lipid headgroup charge or chain lateral pressure increases the thermodynamic stability of LeuT. The mechanical and charge properties of the bilayer also affect the ability of urea to denature the protein. Thus, we not only gain insight to the long-sought-after thermodynamic stability of an α-helical protein in a lipid bilayer but also provide a basis for studies of the folding of knotted proteins in a membrane environment.

Keywords: membrane proteins; protein folding; protein–lipid interactions.


Conflict of interest statement

The authors declare no conflict of interest.

Figures

Fig. 1.
Fig. 1.
Crystal structure of LeuT in OG (PDB ID code 3GJD) taken from Quick et al. (39). A shows the full structure of the protein with the knot core highlighted in blue, the slipknot loop in yellow, and the slipknot tail in green from opposite viewpoints (B) taken from sequence data presented by knotprot database.
Fig. 2.
Fig. 2.
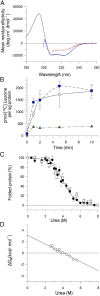
Unfolding and refolding of LeuT in 1 mM DDM detergent micelles by urea. (A) Far-UV CD of LeuT in DDM (black), unfolded in 8 M urea (red), and refolded into DDM (blue). (B) Transport of 14C Leu into liposomes composed of 0.5:0.5 DOPC:DOPG by initially folded LeuT (open circles) and LeuT unfolded and refolded followed by reconstitution into liposomes (blue squares). Control of empty liposomes in identical buffer conditions (green triangles). (C) Equilibrium unfolding of LeuT in different urea concentration in the presence of 1 mM DDM micelles at pH 7.4. Unfolding (black circles) and refolding (white squares) of LeuT in DDM at different concentrations of urea measured by CD intensity at 222 nm. The percent folded protein on the y axis is determined from CD signal intensity at 222 nm, where 100% represents the 222-nm value of fully folded LeuT in DDM and 0% represents the partly unfolded 8 M urea state (that possesses 65% of original helical content). The continuous line represents a two-state fit to the unfolding curve; error bars represent SD of at least five repeated samples. (D) The free energy of unfolding was determined at different urea concentrations using equation ΔG = −RT ln([unfolded]/[folded]) and data from C; extrapolation to zero urea gives a ΔGUH2O = +3.1 ± 0.3 kcal·mol−1. All data shown are a sum of at least five repeats, each based upon at least three separate protein preparations.
Fig. 3.
Fig. 3.
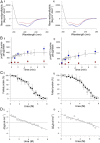
Unfolding and refolding of LeuT in liposomes composed of (i) 0.8:0.2 DOPC:DOPE and (ii) 0.5:0.5 DOPC:DOPE. (A) Far-UV CD of LeuT at a protein lipid ratio of 1:25 (black), unfolded in 8 M urea and 0.29 mM OG (red), and refolded into 50 mM sodium phosphate pH 7.4 buffer (blue). (B) Transport of 14C Leu into liposomes composed of DOPC:DOPE by LeuT (open circles), 8 M unfolded LeuT (red circles), and refolded LeuT (blue squares). (C) Equilibrium unfolding of LeuT in DOPC/DOPE liposomes at different urea concentrations and 0.29 mM OG at pH 7.6. Unfolding (black circles) and refolding (white squares) were measured by CD intensity at 222 nm. The percent folded protein on the y axis is determined from CD signal intensity at 222 nm, where 100% represents the 222-nm value of fully folded reconstituted LeuT in the relevant lipid composition and 0% represents the partly unfolded 8 M urea state that still possesses some helical content (between 69 and 73% of the original). The continuous line represents a two-state fit to the unfolding curve; error bars represent SD of at least six repeated samples. (D) The free energy of unfolding was determined at different urea concentrations using equation ΔG = −RT ln([unfolded]/[folded]) and data from C; extrapolation to zero urea gives ΔGUH2O = +2.6 ± 0.1 kcal·mol−1 for 0.8:0.2 DOPC:DOPE and ΔGUH2O = + 2.9 ± 0.2 kcal⋅mol−1 for 0.5:0.5 DOPC:DOPE. All data shown are a sum of at least six repeats, each based upon at least three different protein preparations.
Fig. 4.
Fig. 4.
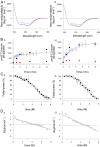
Unfolding and refolding of LeuT in liposomes composed of (i) 0.8:0.2 DOPC:DOPG and (ii) 0.5:0.5 DOPC:DOPG. (A) Far-UV CD of LeuT at a protein lipid ratio of 1:25 (black), unfolded in 8 M urea and 0.29 mMOG (red) and refolded (blue). (B) Transport of 14C Leu into liposomes composed of DOPC:DOPE by LeuT (open circles), 8 M unfolded LeuT (red circles), and refolded LeuT (blue squares). (C) Equilibrium unfolding of LeuT in DOPC/DOPG liposomes at different urea concentrations and 0.29 mM OG at pH 7.6. Unfolding (black circles) and refolding (white squares) were measured by CD intensity at 222 nm. The percent folded protein on the y axis is determined from CD signal intensity at 222 nm, where 100% represents the 222-nm value of fully folded reconstituted LeuT in the relevant lipid composition and 0% represents the partly unfolded 8 M urea state that still possesses some helical content (between 79 and 82% of the original). The continuous line represents a two-state fit to the unfolding curve; error bars represent SD of at least six repeated samples. (D) The free energy of unfolding was determined at different urea concentrations using equation ΔG = −RT ln([unfolded]/[folded]) and data from C; extrapolation to zero urea gives ΔGUH2O = +2.5 ± 0.1 kcal⋅mol−1 for 0.8:0.2 DOPC:DOPG and ΔGUH2O = +3.8 ± 0.2 kcal⋅mol−1 for 0.5:0.5 DOPC:DOPG. All data shown are a sum of at least six repeats, each based upon at least three different protein preparations.
Fig. 5.
Fig. 5.
Thermodynamic stability of LeuT correlates with nonbilayer PE or charged PG content. Phospholipid compositions composed of DOPC:DOPG shown as black circles and binary phospholipid compositions DOPC:DOPE shown in white circles. In both cases, the unfolding free energy decreases as the amount of DOPE or DOPG is reduced along the x axis. ΔGUH2O values were derived from unfolding curves shown in Figs. 3 and 4 and SI Appendix, Figs. S7 and S8 at molar ratios of 0.80:0.20, 0.75:0.25, 0.67:0.33, 0.60:0.40, and 0.50:0.50 of DOPC:DOPG or DOPC:DOPE, respectively. Error bars describe the SE of the fitted ΔGUH2O values.
Fig. 6.
Fig. 6.
Values of calculated ΔGUH2O values for membrane proteins extrapolated from unfolding curves; the first notable examples have been annotated on the figure; all values are summarized in SI Appendix, Table S1. Circles indicate α-helix proteins, whereas squares indicate β-barrels. Additionally, color indicates the membrane mimetic used either detergent (white), bicelles (green), or lipid bilayer (blue). Vertical strikethrough indicates that steric trapping was used to generate the ΔGUH2O; diagonal strikethrough indicates mechanical unfolding was used. For α-helical proteins: DGK is a trimer but the value obtained was for the monomer (14), KcsA is a tetramer and the value obtained refers to tetramer-to-monomer transition (62), bR structure is stabilized by a cofactor (23), DsbB (70) and GlpG (60) area single-domain α-helical protein, GalP (11), LacY (12), and LeuT are multidomain α-helical proteins. For β-barrels: OmpA was the first ΔGUH2O generated for a protein in a bilayer (52, 53), followed by PagP* measured with an N-terminal his tag (74), followed with the release of OmpLA (74), OmpW (74), and PagP (74). ΔGUH2O of GlpG have also been calculated using novel methods such as steric trapping (with the ΔGUH2O for 95/172N-BtnPyr2 variant shown) (71) and mechanical unfolding (72).

References

    1. Bowie JU. Solving the membrane protein folding problem. Nature. 2005;438:581–589. - PubMed
    1. Cymer F, von Heijne G, White SH. Mechanisms of integral membrane protein insertion and folding. J Mol Biol. 2015;427:999–1022. - PMC - PubMed
    1. Booth PJ. Sane in the membrane: Designing systems to modulate membrane proteins. Curr Opin Struct Biol. 2005;15:435–440. - PubMed
    1. Popot JL, Engelman DM. Helical membrane protein folding, stability, and evolution. Annu Rev Biochem. 2000;69:881–922. - PubMed
    1. Engelman DM, et al. Membrane protein folding: Beyond the two stage model. FEBS Lett. 2003;555:122–125. - PubMed

Publication types