

Identification of genetic risk factors in the Chinese population implicates a role of immune system in Alzheimer's disease pathogenesis
- PMID: 29432188
- PMCID: PMC5828602
- DOI: 10.1073/pnas.1715554115
Identification of genetic risk factors in the Chinese population implicates a role of immune system in Alzheimer's disease pathogenesis
Abstract
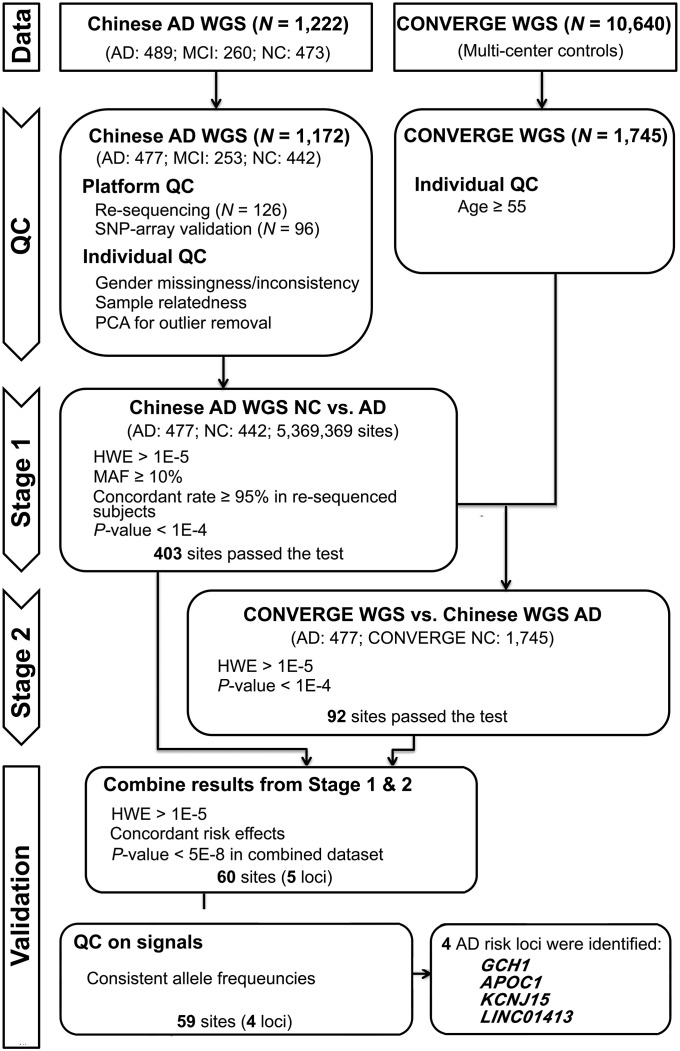
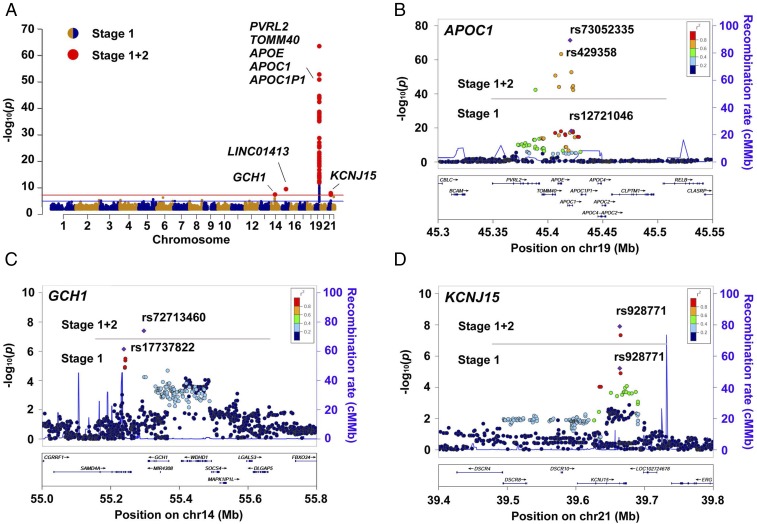
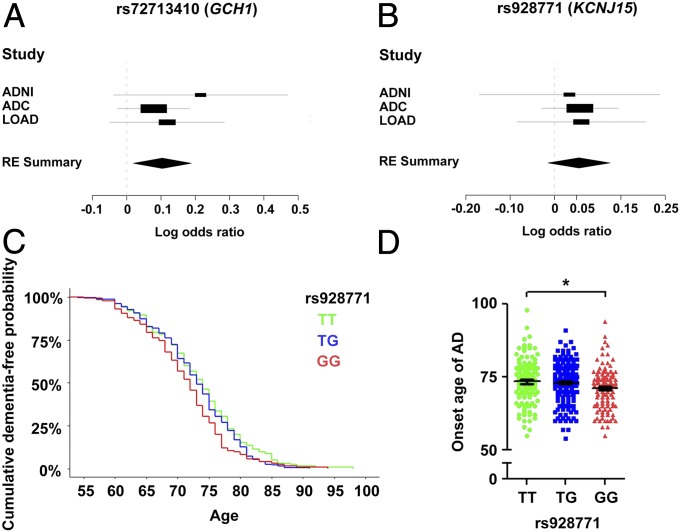
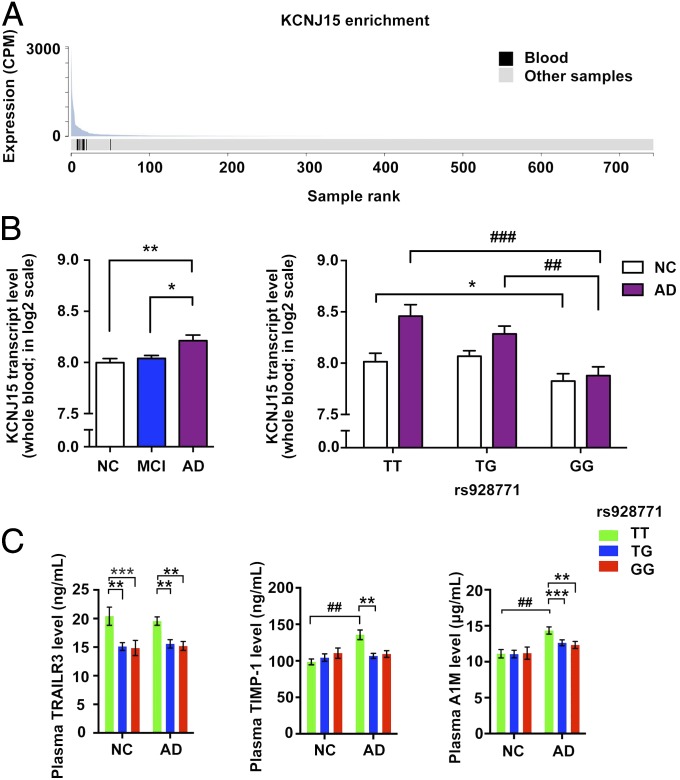
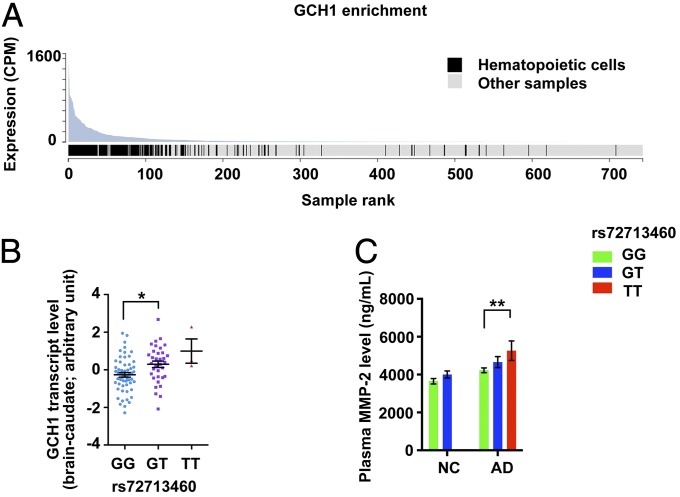
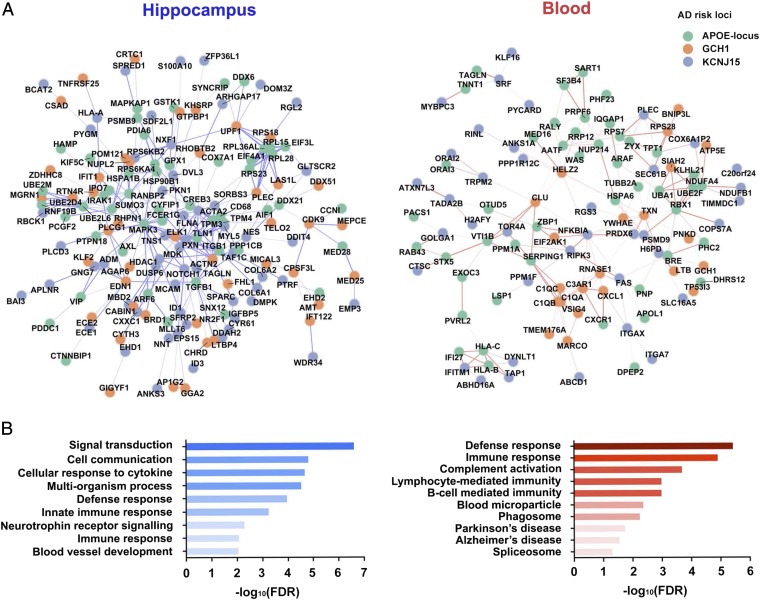
Alzheimer's disease (AD) is a leading cause of mortality among the elderly. We performed a whole-genome sequencing study of AD in the Chinese population. In addition to the variants identified in or around the APOE locus (sentinel variant rs73052335, P = 1.44 × 10⁻¹⁴), two common variants, GCH1 (rs72713460, P = 4.36 × 10⁻⁵) and KCNJ15 (rs928771, P = 3.60 × 10⁻⁶), were identified and further verified for their possible risk effects for AD in three small non-Asian AD cohorts. Genotype-phenotype analysis showed that KCNJ15 variant rs928771 affects the onset age of AD, with earlier disease onset in minor allele carriers. In addition, altered expression level of the KCNJ15 transcript can be observed in the blood of AD subjects. Moreover, the risk variants of GCH1 and KCNJ15 are associated with changes in their transcript levels in specific tissues, as well as changes of plasma biomarkers levels in AD subjects. Importantly, network analysis of hippocampus and blood transcriptome datasets suggests that the risk variants in the APOE, GCH1, and KCNJ15 loci might exert their functions through their regulatory effects on immune-related pathways. Taking these data together, we identified common variants of GCH1 and KCNJ15 in the Chinese population that contribute to AD risk. These variants may exert their functional effects through the immune system.
Keywords: Alzheimer’s disease; GWAS; immune; risk variant; whole-genome sequencing.
Copyright © 2018 the Author(s). Published by PNAS.
Conflict of interest statement
The authors declare no conflict of interest.
Figures
Similar articles
-
The Genetics of Alzheimer's Disease in the Chinese Population.Int J Mol Sci. 2020 Mar 30;21(7):2381. doi: 10.3390/ijms21072381. Int J Mol Sci. 2020. PMID: 32235595 Free PMC article. Review.
-
A high-density whole-genome association study reveals that APOE is the major susceptibility gene for sporadic late-onset Alzheimer's disease.J Clin Psychiatry. 2007 Apr;68(4):613-8. doi: 10.4088/jcp.v68n0419. J Clin Psychiatry. 2007. PMID: 17474819
-
No association of the LRRK2 genetic variants with Alzheimer's disease in Han Chinese individuals.Neurobiol Aging. 2014 Feb;35(2):444.e5-9. doi: 10.1016/j.neurobiolaging.2013.08.013. Epub 2013 Sep 27. Neurobiol Aging. 2014. PMID: 24080176
-
Genome-wide association study identifies four novel loci associated with Alzheimer's endophenotypes and disease modifiers.Acta Neuropathol. 2017 May;133(5):839-856. doi: 10.1007/s00401-017-1685-y. Epub 2017 Feb 28. Acta Neuropathol. 2017. PMID: 28247064 Free PMC article.
-
Genome-wide significant, replicated and functional risk variants for Alzheimer's disease.J Neural Transm (Vienna). 2017 Nov;124(11):1455-1471. doi: 10.1007/s00702-017-1773-0. Epub 2017 Aug 2. J Neural Transm (Vienna). 2017. PMID: 28770390 Free PMC article. Review.
Cited by
-
A comparative study of structural variant calling in WGS from Alzheimer's disease families.Life Sci Alliance. 2024 Feb 28;7(5):e202302181. doi: 10.26508/lsa.202302181. Print 2024 May. Life Sci Alliance. 2024. PMID: 38418088 Free PMC article.
-
Network-based analysis on genetic variants reveals the immunological mechanism underlying Alzheimer's disease.J Neural Transm (Vienna). 2021 Jun;128(6):803-816. doi: 10.1007/s00702-021-02337-9. Epub 2021 Apr 28. J Neural Transm (Vienna). 2021. PMID: 33909139
-
Genetic architecture of Alzheimer's disease.Neurobiol Dis. 2020 Sep;143:104976. doi: 10.1016/j.nbd.2020.104976. Epub 2020 Jun 18. Neurobiol Dis. 2020. PMID: 32565066 Free PMC article. Review.
-
Identification of a Goat Intersexuality-Associated Novel Variant Through Genome-Wide Resequencing and Hi-C.Front Genet. 2021 Feb 9;11:616743. doi: 10.3389/fgene.2020.616743. eCollection 2020. Front Genet. 2021. PMID: 33633772 Free PMC article.
-
Polygenic Score Models for Alzheimer's Disease: From Research to Clinical Applications.Front Neurosci. 2021 Mar 29;15:650220. doi: 10.3389/fnins.2021.650220. eCollection 2021. Front Neurosci. 2021. PMID: 33854414 Free PMC article. Review.
References
-
- Chan KY, et al. Global Health Epidemiology Reference Group (GHERG) Epidemiology of Alzheimer’s disease and other forms of dementia in China, 1990-2010: A systematic review and analysis. Lancet. 2013;381:2016–2023. - PubMed
Publication types
MeSH terms
Substances
Grants and funding
LinkOut - more resources
Full Text Sources
Other Literature Sources
Medical
Miscellaneous
