. 2018 Feb 12;14(2):e1006862.
doi: 10.1371/journal.ppat.1006862. eCollection 2018 Feb.

GM1 ganglioside-independent intoxication by Cholera toxin

Affiliations

GM1 ganglioside-independent intoxication by Cholera toxin

Jakob Cervin et al. PLoS Pathog. .

Abstract

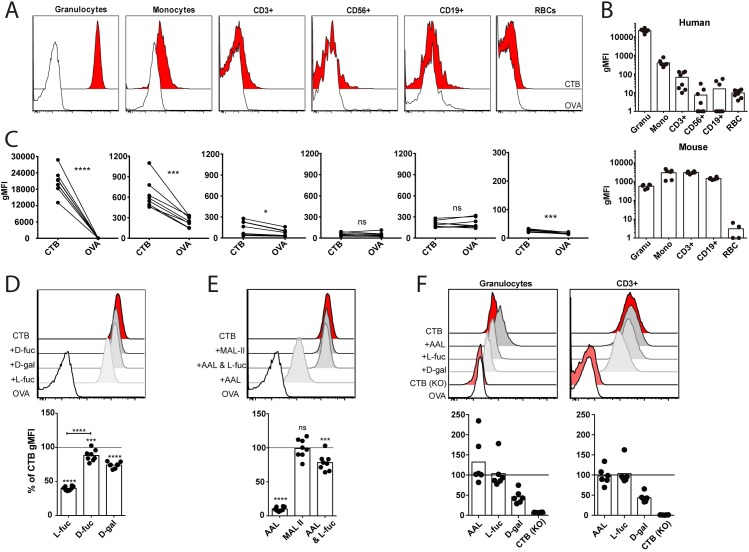
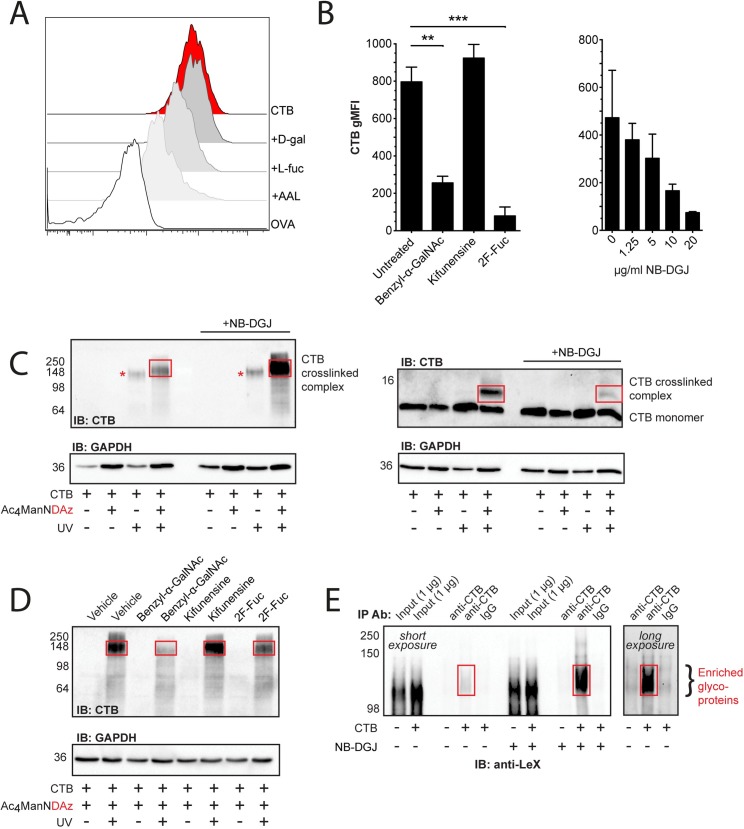
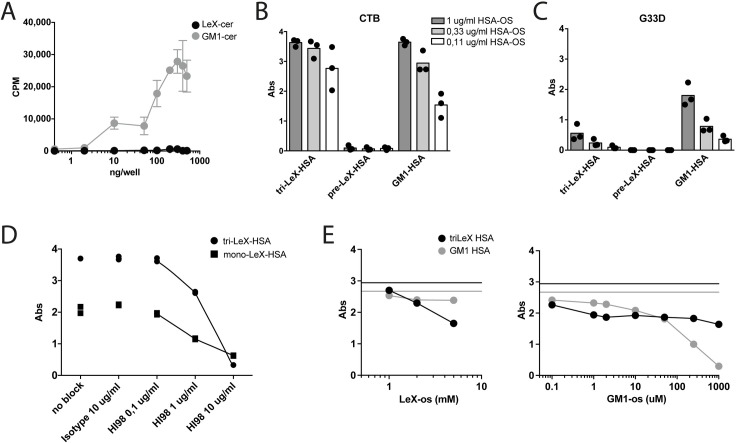
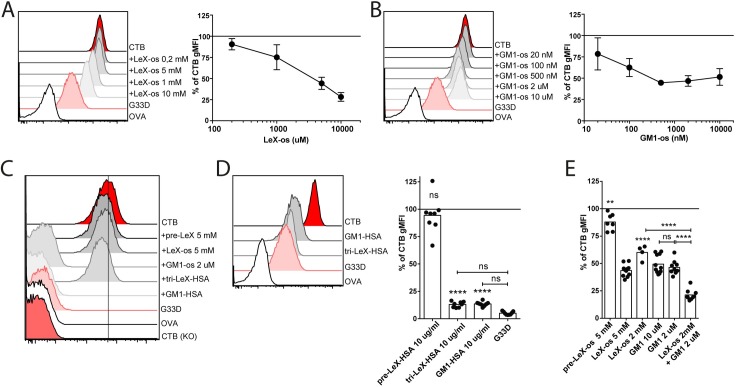
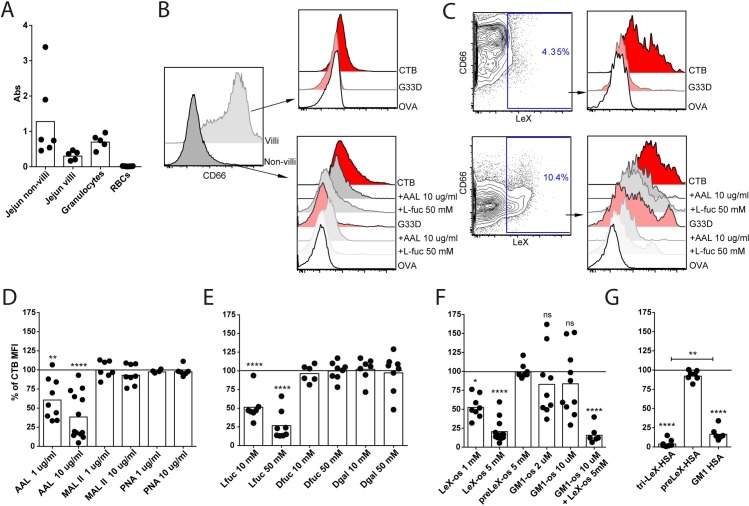
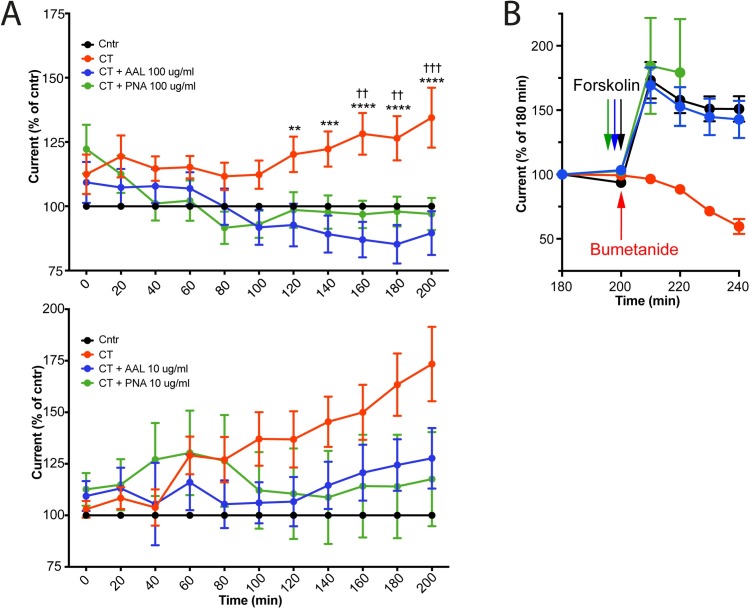
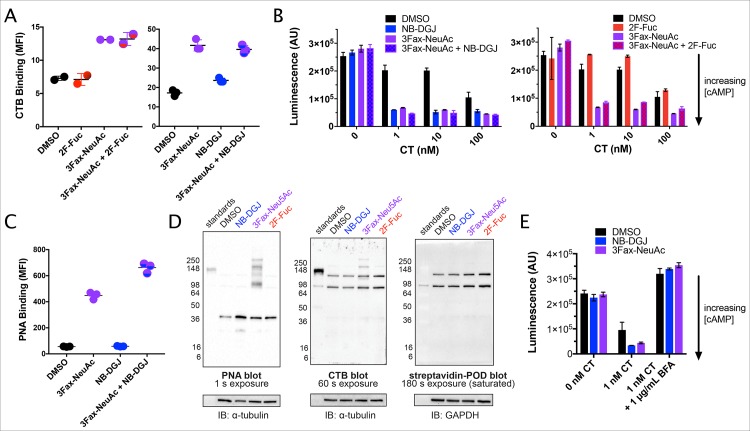
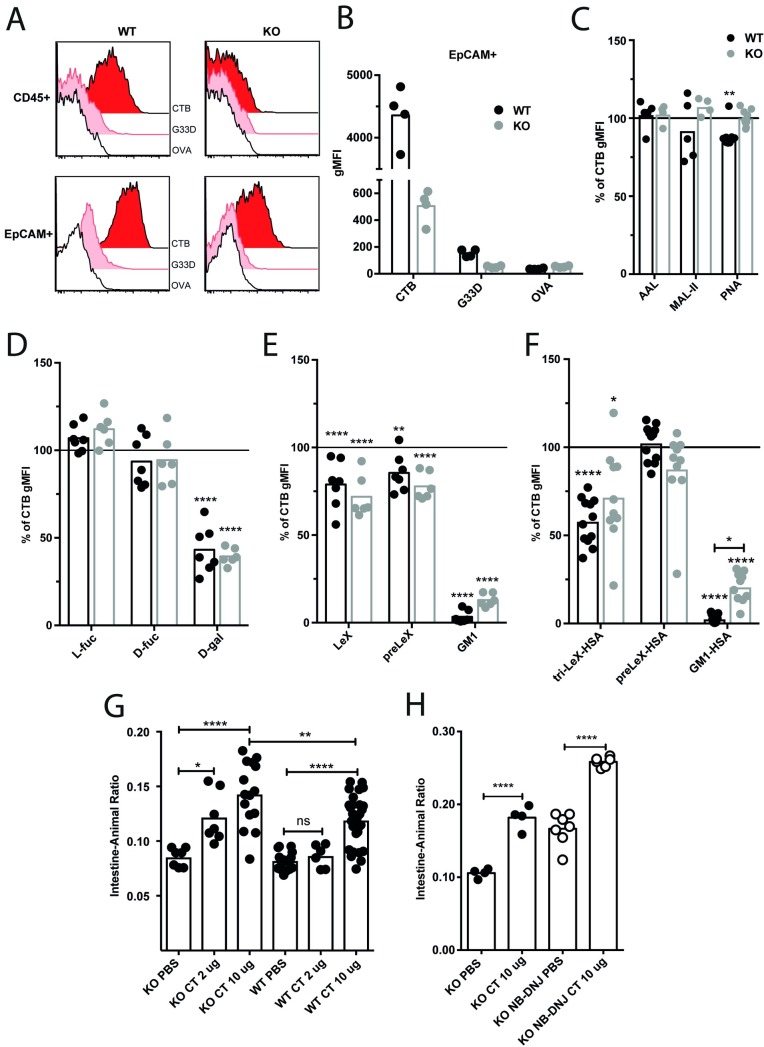
Cholera toxin (CT) enters and intoxicates host cells after binding cell surface receptors via its B subunit (CTB). We have recently shown that in addition to the previously described binding partner ganglioside GM1, CTB binds to fucosylated proteins. Using flow cytometric analysis of primary human jejunal epithelial cells and granulocytes, we now show that CTB binding correlates with expression of the fucosylated Lewis X (LeX) glycan. This binding is competitively blocked by fucosylated oligosaccharides and fucose-binding lectins. CTB binds the LeX glycan in vitro when this moiety is linked to proteins but not to ceramides, and this binding can be blocked by mAb to LeX. Inhibition of glycosphingolipid synthesis or sialylation in GM1-deficient C6 rat glioma cells results in sensitization to CT-mediated intoxication. Finally, CT gavage produces an intact diarrheal response in knockout mice lacking GM1 even after additional reduction of glycosphingolipids. Hence our results show that CT can induce toxicity in the absence of GM1 and support a role for host glycoproteins in CT intoxication. These findings open up new avenues for therapies to block CT action and for design of detoxified enterotoxin-based adjuvants.


Conflict of interest statement

The authors have declared that no competing interests exist.

Figures

Fig 1
Fig 1. CTB binds to fucosylated structures expressed on human granulocytes.
(A) Representative histograms from flow cytometry analysis of CTB- (red) and OVA- (white) binding to cell types in human peripheral blood. (B) Bar graphs show the geometric mean fluorescent index (gMFI) of CTB binding (with OVA gMFI subtracted) to human whole blood (n = 8) and murine splenocytes (n = 4–6). Each dot represents one donor/mouse. (C) gMFI of CTB and OVA binding to the different cell types from human whole blood. Each pair of dots represents one donor. (D-E) Histogram and bar graph (n = 8) showing blocking of CTB binding to human granulocytes by pre-treating CTB with (D) L-, D-fucose and D-galactose or (E) with the lectins AAL or MAL-II. (F) Histograms and bar graphs (n = 6) showing the blocking of CTB binding to murine (wt or KO) cells by either pre-treating the cells with lectins or pre-treating CTB with sugars. For panel (C) significance was calculated using paired t-test and for (D-E) one-way-ANOVA was used with Tukey correction (*** = p<0,005, **** = p<0,0001).
Fig 2
Fig 2. CTB binds to LeX-carrying proteins in HL-60 cells.
(A) Histogram from flow cytometry analysis of CTB-binding to HL-60 cells following pre-treatment of the cells with AAL (10 μg/ml) or pre-treatment of CTB with sugars (50 mM). (B) gMFI of CTB binding to HL-60 cells cultured with the indicated inhibitors (*** = p<0.001 and ** = p<0.01). (C-D) Western blot using anti-CTB of HL-60 cells co-cultured with (C) (NB-DGJ) or (D) (benzyl-α-GalNAc, kifunensine, or 2F-Fuc) and the precursor sugar Ac4ManNDAz to enable UV-crosslinking between CTB and glycosylated structures. Representative of two independent experiments. (E) Western blot using anti-LeX of HL-60 cells after incubation with CTB, lysis and immunoprecipitation with anti-CTB. One representative out of two independent experiments is shown.
Fig 3
Fig 3. CTB binds to LeX linked to proteins but not ceramide.
(A) GM1- or LeX-os (oligosaccharide) linked to ceramide and immobilized to wells were detected with 125I labeled CTB. Relative binding is displayed as counts per minute (CPM). (B-C) ELISA with titrated amounts of os-linked to HSA, immobilized to wells and detected with (B) CTB-HRP and (C) G33D-HRP. Graph shows absorbance values from three independent experiments. (D) ELISA with os-linked to HSA, immobilized in wells and then blocked with indicated concentrations of anti-LeX antibody HI98 or isotype control (IgM), and detected with CTB-HRP. Graph shows absorbance values from one representative out of two independent experiments. (E) ELISA with os-linked to HSA, immobilized in wells and detected with CTB-HRP in the presence of increasing blocking concentrations of tri-LeX-os and GM1-os. Graphs show absorbance values from one representative out of two independent experiments.
Fig 4
Fig 4. LeX blocks binding of CTB to human granulocytes but not murine leukocytes.
(A-B and D-E) Histograms from flow cytometry analyses of CTB-, G33D- and OVA-binding to granulocytes in human peripheral blood. CTB was pretreated or not with titrated amounts of (A) LeX-os, (B) GM1-os, (D) os-HSA (not titrated) and (E) LeX-os and GM1-os. Graphs show the percent of gMFI of CTB binding to the cells where 100% represents CTB staining with no blocking oligosaccharide. (C) Histograms from flow cytometry analyses of CTB-, G33D- and OVA-binding to CD3+ T cells gated from murine splenocytes. CTB was pretreated or not with the indicated os or os-HSA. (A-B) n = 3, (C) One representative out of three independent experiments, (D) n = 8, (E) n = 4–9. Error bars show SD. Each dot represents one donor and significance was calculated using a one-way-ANOVA with Tukey correction compared to CTB without block if not indicated otherwise with bars (**** = p<0,0001, *** = p<0,005, ** = p<0,01).
Fig 5
Fig 5. CTB binding to primary human intestinal cells can be blocked by interference with fucosylated structures.
(A) Bar graph showing relative absorbance values from an ELISA with immobilized anti-LeX, and detection with CTB-HRP. Samples as indicated from lysates of isolated human cells (2 μg protein/ml). Each dot represents a human donor (n = 5–8). (B) CD66 or (C) CD66 and LeX expression by jejunal epithelial cells that were isolated using EDTA medium (villi) or enzymatic degradation after EDTA treatment (non-villi or crypt). Histograms from flow cytometry analyses of CTB-, G33D- and OVA-binding to the differentially enriched epithelial cells. (B) EpCAM+ cells and (C) EpCAM+LeX+ cells. (D-G) Bar graph showing percent of gMFI of CTB binding to jejunal epithelial cells by pretreatment of the cells with (D) lectins, (E) sugars, (F) oligosaccharides and (G) HSA-linked oligosaccharides. Graphs show the percent of gMFI of CTB binding to the cells where 100% represents CTB staining with no blocking oligosaccharide. Each dot represents a donor in (D) n = 4–12, (E) n = 6–8, (F) n = 6–12, (G) n = 6–7. Significance was calculated using a one-way-ANOVA with Tukey correction compared to CTB without block if not indicated otherwise with bars (**** = p<0,0001, *** = p<0,005, ** = p<0,01 and * = p<0,05).
Fig 6
Fig 6. CT induced ion secretion can be inhibited by pretreating the tissue with AAL and PNA.
Human jejunal mucosae were pre-incubated with or without AAL or PNA at the indicated concentrations, mounted in an Ussing chamber and exposed to CT. (A) Dot plot showing percent difference in Iep to control tissue for jejunal mucosae over time. Each dot represents a mean of 4–7 donors (each treatment for each donor was tested in duplicates) with SEM error bars. Significance was calculated using a two-way-ANOVA with Tukey correction (compared to the CT). * represent CT to CT+AAL comparison and † represent CT to CT+PNA comparison (**** = p<0.0001 and ** = p<0.01). (B) Dot plot showing percent of start Iep for jejunal mucosae at 180 min. AAL, PNA-treated or untreated tissue were treated with forskolin (or forskolin analog NKH477) bilaterally at 200 min. CT treated tissue were treated with bumetanide at 200 min. Each dot represents a mean of 2–3 donors (each treatment for each donor was tested in duplicates). Error bars show SEM.
Fig 7
Fig 7. GM1-deficient C6 cells are sensitized to CT by inhibition of sialylation or GSL biosynthesis.
(A-E) C6 cells were cultured with the indicated inhibitors for 72 h followed by: (A) Staining was then performed with biotin-CTB, followed by DTAF-streptavidin. Fluorescence was measured by flow cytometry, represented here by MFI. (B) 1 h exposure to CT after which accumulated cAMP was measured by the cAMP-Glo™ luminescence assay. Luminescence signal is inversely proportional to cAMP levels. (C) As in panel A, but stained with biotin-PNA, followed by DTAF-streptavidin (D) Cell lysates were separated by PAGE and probed with biotin-PNA, biotin-CTB, or no biotinylated reagent, followed by streptavidin-peroxidase conjugate and development with chemiluminescent substrate. Equivalent amounts of protein were loaded in each lane and blots were probed with an anti-α-tubulin or anti-GAPDH antibody to confirm equivalent loading. (E) As in panel B, but brefeldin A (BFA) was added 1 h prior to CT addition and was also present during CT induction.
Fig 8
Fig 8. CT induces an intact diarrheal response in mice lacking GM1 and GM1 related GSLs.
(A) Representative histograms from flow cytometry analyses of CTB-, G33D- and OVA-binding to WT and KO jejunal cells (non-villi epithelial and CD45+ cells). (B) Bar graph showing CTB, G33D and OVA gMFI of non-villi jejunal epithelial cells from wt (black) and KO (gray). (C-F) Bar graphs showing percent of gMFI of non-blocked CTB binding to non-villi jejunal epithelial cells (wt black and KO gray) following pretreatment of the cells with (C) lectins or CTB with (D) sugars, (E) oligosaccharides and (F) HSA-linked oligosaccharides. Graphs show the percent of gMFI of CTB binding to the cells where 100% represents CTB staining with no blocking. (G-H) Bar graph showing intestine-animal ratio (by weight) for WT and KO mice gavaged with PBS with or without CT. (H) KO mice were fed chow with (open circles) or without (full circles) NB-DNJ for 4 weeks prior to gavage. The graphs are from pooled experiments where each dot represents one animal (n = 4–30). Significance was calculated using a one-way-ANOVA with Tukey correction (**** = p<0,0001, *** = p<0,005, ** = p<0,01 and * = p<0,05).

References

    1. Clemens JD, Nair GB, Ahmed T, Qadri F, Holmgren J. Cholera. Lancet. 2017;390: 1539–1549. doi: 10.1016/S0140-6736(17)30559-7 - DOI - PubMed
    1. Chin C- S, Sorenson J, Harris JB, Robins WP, Charles RC, Jean-Charles RR, et al. The Origin of the Haitian Cholera Outbreak Strain. N Engl J Med. 2011;364: 33–42. doi: 10.1056/NEJMoa1012928 - DOI - PMC - PubMed
    1. Fullner KJ, Lencer WI, Mekalanos JJ. Vibrio cholerae-Induced Cellular Responses of Polarized T84 Intestinal Epithelial Cells Are Dependent on Production of Cholera Toxin and the RTX Toxin. Infection and Immunity. 2001;69: 6310–6317. doi: 10.1128/IAI.69.10.6310-6317.2001 - DOI - PMC - PubMed
    1. Wernick NLB, Chinnapen DJF, Cho JA, Lencer WI. Cholera Toxin: An Intracellular Journey into the Cytosol by Way of the Endoplasmic Reticulum. Toxins. 2010;2: 310–325. doi: 10.3390/toxins2030310 - DOI - PMC - PubMed
    1. Saslowsky DE, Welscher te YM, Chinnapen DJF, Wagner JS, Wan J, Kern E, et al. Ganglioside GM1-mediated transcytosis of cholera toxin bypasses the retrograde pathway and depends on the structure of the ceramide domain. J Biol Chem. American Society for Biochemistry and Molecular Biology; 2013;288: 25804–25809. doi: 10.1074/jbc.M113.474957 - DOI - PMC - PubMed

Publication types

LinkOut - more resources