. 2018;14(5):845-861.
doi: 10.1080/15548627.2017.1390636. Epub 2018 Feb 21.

Piperlongumine restores the balance of autophagy and apoptosis by increasing BCL2 phosphorylation in rotenone-induced Parkinson disease models

Affiliations

Piperlongumine restores the balance of autophagy and apoptosis by increasing BCL2 phosphorylation in rotenone-induced Parkinson disease models

Jia Liu et al. Autophagy. 2018.

Abstract

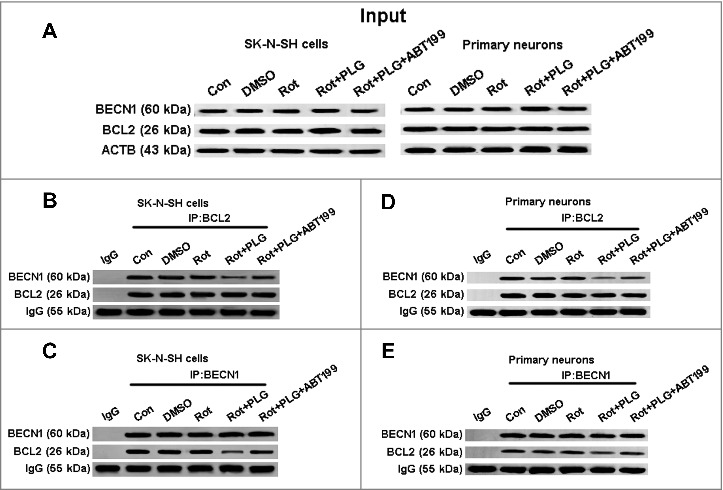
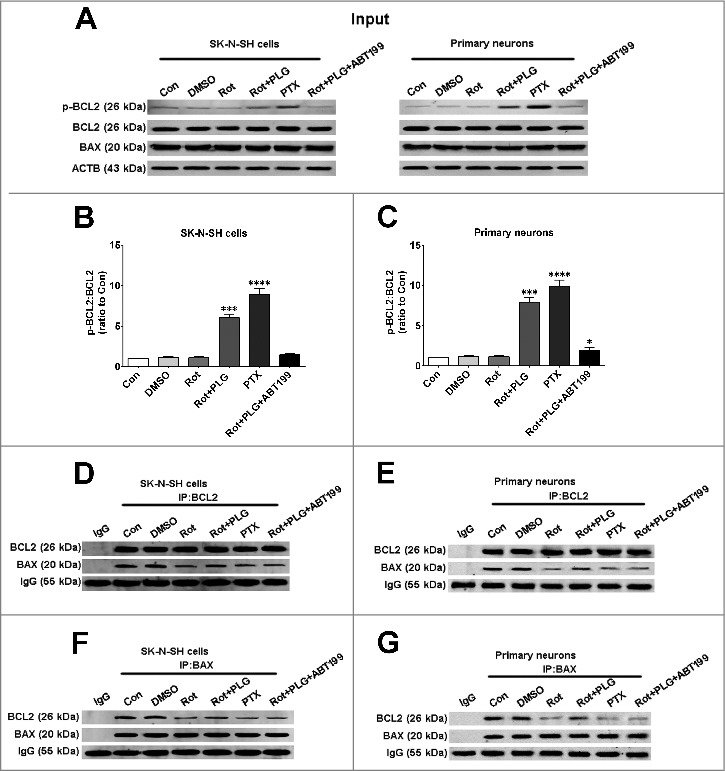
Parkinson disease (PD) is the second most common neurodegenerative disorder after Alzheimer disease and is caused by genetics, environmental factors and aging, with few treatments currently available. Apoptosis and macroautophagy/autophagy play critical roles in PD pathogenesis; as such, modulating their balance is a potential treatment strategy. BCL2 (B cell leukemia/lymphoma 2) is a key molecule regulating this balance. Piperlongumine (PLG) is an alkaloid extracted from Piper longum L. that has antiinflammatory and anticancer effects. The present study investigated the protective effects of PLG in rotenone-induced PD cell and mouse models. We found that PLG administration (2 and 4 mg/kg) for 4 wk attenuated motor deficits in mice and prevented the loss of dopaminergic neurons in the substantia nigra induced by oral administration of rotenone (10 mg/kg) for 6 wk. PLG improved cell viability and enhanced mitochondrial function in primary neurons and SK-N-SH cells. These protective effects were exerted via inhibition of apoptosis and induction of autophagy through enhancement of BCL2 phosphorylation at Ser70. These results demonstrate that PLG exerts therapeutic effects in a rotenone-induced PD models by restoring the balance between apoptosis and autophagy.

Abbreviations: 6-OHDA, 6-hydroxydopamine; ACTB, actin, beta; BafA1, bafilomycin A1; BAK1, BCL2-antagonist/killer 1; BAX, BCL2-associated X protein; BCL2, B cell leukemia/lymphoma2; BECN1, Beclin 1, autophagy related; CoQ10, coenzyme Q10; COX4I1/COX IV, cytochrome c oxidase subunit 4I1; CsA, cyclosporine A; ED50, 50% effective dose; FITC, fluorescein isothiocyanate; GFP, green fluorescent protein; HPLC, high-performance liquid chromatography; JC-1, tetraethylbenz-imidazolylcarbocyanine iodide; LC3, microtubule-associated protein 1 light chain3; LC-MS/MS, liquid chromatography-tandem mass spectrometry; LDH, lactate dehydrogenase; l-dopa, 3, 4-dihydroxyphenyl-l-alanine; MAPK8/JNK1, mitogen-activated protein kinase 8; MMP, mitochondrial membrane potential; mPTP, mitochondrial permeability transition pore; mRFP, monomeric red fluorescent protein; MPTP, 1-methyl-4-phenyl-1,2,3,6-tetrahydropyridine; MTT, 3-(4,5-dimethylthiazol-2-yl)-2,5-diphenyltetrazolium bromide; NFE2L2/NRF2, nuclear factor, erythroid derived 2, like 2; PD, Parkinson disease; PLG, piperlongumine; pNA, p-nitroanilide; PI, propidium iodide; PtdIns3K, phosphatidylinositol 3-kinase; PtdIns3P, phosphatidylinositol-3-phosphate; PTX, paclitaxel; Rap, rapamycin; SQSTM1/p62, sequestosome 1; TH, tyrosine hydroxylase; TUNEL, terminal deoxynucleotidyl transferase dUTP nick end labeling; WIPI2, WD repeat domain, phosphoinositide interacting 2; ZFYVE1/DFCP1, zinc finger, FYVE domain containing 1.

Keywords: BCL2; Parkinson disease; autophagy; piperlongumine; treatment.


Figures

Figure 1.
Figure 1.
PLG is distributed in mouse brain and reverses motor deficits induced by rotenone. (A) C57BL male mice (3 mo old) were orally administered PLG (4 mg/kg) and sacrificed at 15 min, 30 min, or 1, 2, 4, 8, or 24 h. PLG levels in brain tissue and blood samples were determined by LC-MS/MS. (B) Plasma protein binding ratio was measured by equilibrium dialysis. PLG concentrations were 1 and 10 μM; phaenacetin (1 μM) and warfarin (1 μM) were used as controls.(C) Male C57BL mice were orally treated with rotenone (10 mg/kg) for 6 wk followed by PLG (2 or 4 mg/kg) or l-dopa (20 mg/kg) for 4 wk. (D, E) Rotarod (D) and pole (E) tests were used to assess motor function. Data are expressed as the mean ± SD (one-way analysis of variance). ###P<0.001 vs. control (Con); **P<0.01 vs. rotenone (Rot) (n = 10).
Figure 2.
Figure 2.
PLG restores TH expression in a mouse model of rotenone-induced PD. C57BL mice were treated with rotenone (10 mg/kg) for 6 wk followed by PLG (2 or 4 mg/kg) or l-dopa (20 mg/kg) for 4 wk. (A) TH (tyrosine hydroxylase) expression in the midbrain and striatum was assessed by immunohistochemistry. Scale bar: 500 μm. (B, C) Quantitative analysis of TH-positive neurons in the striatum (B) and midbrain (C). (D) TH expression in the midbrain and striatum was determined by western blotting. (E, F) Quantitative analysis of TH expression in the striatum (E) and midbrain (F). (G) Dopamine (DA) content in the striatum was assessed by HPLC. (H) Activity of mitochondrial complex I in the midbrain. Data are expressed as the mean ± SD (one-way analysis of variance). ###P<0.001 vs. control (Con); **P<0.01 vs. rotenone (Rot) (n = 5).
Figure 3.
Figure 3.
PLG enhances cell viability and reduces cytotoxicity induced by rotenone. (A, B) SK-N-SH cells were cotreated with rotenone and PLG at concentrations of 0.1, 0.5, and 2.5 μM, and cell viability and cytotoxicity were evaluated with the MTT and LDH assays, respectively, to determine optical PLG concentration. Cells were also treated with PLG alone at 0.1, 0.5, and 2.5 μM and the side effects were evaluated. (C, D) SK-N-SH cells were treated with rotenone and PLG was added 0, 1, 2, 4, and 6 h later for 24 h; cell viability and cytotoxicity were evaluated with the MTT and LDH assays to determine optical PLG treatment time. (E, F) Cell viability and cytotoxicity were detected in primary neurons with the MTT (E) and LDH (F) assays. (G, I) Cell death in SK-N-SH cells (G) and primary neurons (I) was detected by PI (red) and Hoechst 33342 (blue) staining. CoQ10 (10 μM for 12 h), a component of the mitochondrial respiratory chain, served as a positive control. (H, J) Cell death rates were quantified in SK-N-SH cells (H) and primary neurons (J). Bar: 100 μm. Data are expressed as the mean ± SD (one-way analysis of variance). ###P<0.001 vs. control (Con); **P<0.01 vs. rotenone (Rot) (n = 3).
Figure 4.
Figure 4.
PLG reverses the decreases in mitochondrial complex I activity and MMP and blocks mPTP opening induced by rotenone. SK-N-SH cells and rat primary neurons were treated with rotenone; 2 h later, PLG was added at a concentration of 0.1 μM for 24 h. (A, C) MMP was assessed using JC-1 staining in SK-N-SH cells (A) and primary neurons (C). Coenzyme Q10 (CoQ10, 10 μM for 12 h), a component of the mitochondrial respiratory chain, served as a positive control. (B, D) Quantitative analysis of fluorescence intensity in SK-N-SH cells (B) and primary neurons (D). (E, G) mPTP opening was assessed by calcein-AM staining in SK-N-SH cells (E) and primary neurons (G). Cyclosporine A (CsA, 100 nM for 24 h), an mPTP inhibitor, served as a positive control. (F, H) Quantitative analysis of fluorescence intensity in SK-N-SH cells (F) and primary neurons (H). (I, J) Mitochondrial complex I activity was detected in SK-N-SH cells (I) and primary neurons (J). (K, L) ED50 of PLG in primary neurons. Primary neurons were treated with rotenone followed by different concentration of PLG (10−11 to 10−3 mol) for 24 h. The ED50 of PLG was calculated based on MMP. Bar: 100 μm. Data are expressed as the mean ± SD (one-way analysis of variance). ###P<0.001 vs. control (Con); **P<0.01 vs. rotenone (Rot) (n = 3).
Figure 5.
Figure 5.
PLG stimulates autophagy in cells treated with rotenone. SK-N-SH cells and rat primary neurons were treated with rotenone; after 2 h, PLG was added at a concentration of 0.1 μM for 24 h. Rapamycin (Rap; 40 nM for 6 h), an autophagy agonist, served as a positive control. (A) Western blot analysis of LC3B-II and SQSTM1 levels as measures of autophagy induction in the presence of functional or dysfunctional lysosomes (bafilomycin A1[BafA1, 100nM for 6h])in SK-N-SH cells. (B, C) Quantification of LC3B-II (B) and SQSTM1 (C) in SK-N-SH cells. (D) Western blot analysis of LC3B-II and SQSTM1 levels as measures of autophagy induction in the presence of functional or dysfunctional lysosomes (BafA1, 100 nM for 6 h) in primary neurons (D). (E, F) Quantification of LC3B-II (E) and SQSTM1 (F) in primary neurons. Data are expressed as the mean ± SD (one-way analysis of variance). ##P<0.01 vs. control (Con); **P<0.01 vs. rotenone (Rot) or rotenone co-treated with BafA1 (Rot+BafA1)(n = 3).
Figure 6.
Figure 6.
PLG induces autophagy by increasing PtdIns3K complex activity. SK-N-SH cells and rat primary neurons were treated with rotenone. PLG was added 2 h later at 0.1 μM for 24 h. Rapamycin (Rap; 40 nM for 6 h), an autophagy agonist, served as a positive control. (A, B) Autophagy evaluated by counting fluorescent LC3 puncta in SK-N-SH cells (A) and primary neurons (B). (C)Immunofluorescence analysis of SQSTM1 to evaluate autophagy in primary neurons. Nuclei were counterstained with DAPI. (D) Transfection of GFP-ZFYVE1 plasmid and immunofluorescence detection of WIPI2 to evaluate PtdIns3K complex activity in primary neurons. Nuclei were counterstained with DAPI. (E, F) Quantification of LC3 puncta in SK-N-SH cells (E) and primary neurons (F). (G) Quantification of SQSTM1 puncta in primary neurons. (H, I) Quantification of WIPI2 (H) and ZFYVE1 (I) puncte in primary neurons. Bar: 25 μm (A, B) and 10μm (C, D). Data are expressed as the mean ± SD (one-way analysis of variance). ###P<0.001 vs. control (Con), ***P<0.001 vs. rotenone (Rot) (n = 3).
Figure 7.
Figure 7.
PLG promotes the clearance of damaged mitochondria by inducing autophagy. SK-N-SH cells were treated with rotenone; 2 h later, PLG (0.1 μM) was added for 24 h. Rapamycin (Rap; 40 nM for 6 h), an autophagy agonist, served as a positive control. (A) Mitochondria were labeled with MitoTracker Red, and LC3B was detected by immunofluorescence (green). Nuclei were detected by Hoechst staining (blue) to observe the colocalization of mitochondria and LC3. (B) The clearance of mitochondria-LC3 puncta was observed by live cell imaging. White arrows are colocalization of mitochondria and LC3. (C) The expression level of the mitochondrial protein COX4I1 in SK-N-SH cells was detected by western blotting. (D) Quantification of COX4I1 level in SK-N-SH cells. Bar: 25 μm (A) and 10 μm (B); control (Con); rotenone (Rot) (n = 3).
Figure 8.
Figure 8.
PLG promotes the dissociation of BCL2 and BECN1. SK-N-SH cells and rat primary neurons were treated with rotenone; 2 h later, PLG was added at a concentration of 0.1 μM for 24 h. ABT199 (100 nM for 24 h), a BCL2 inhibitor, abolished the effects of PLG on BCL2 and BECN1 dissociation. (A) Protein samples from SK-N-SH cells and primary cultured neurons used as input in the experiment described in panels (B–E). (B–E) Interaction of BCL2 and BECN1 detected by immunoprecipitation with antibodies against BECN1 (C, E) and BCL2 (B, D) in SK-N-SH cell (B, C) and primary neurons (D, E). Control (Con); rotenone (Rot) (n = 3).
Figure 9.
Figure 9.
PLG promotes BCL2 phosphorylation at Ser70 and the interaction between BCL2 and BAX. SK-N-SH cells and rat primary neurons were treated with rotenone; after 2 h, PLG (0.1 μM) was added for 24 h. ABT199 (100 nM for 24 h), an inhibitor of BCL2, abolished the effects of PLG on the dissociation of BCL2 and BECN1. Paclitaxel (PTX, 25 mM for 16 h) was used as a positive control for BCL2 phosphorylation at Ser70. (A) Protein samples from SK-N-SH cells and primary cultured neurons used for immunoprecipitation and western blot analysis of phospho-BCL2 (Ser70). (B, C) Quantification of phospho-BCL2:BCL2 in SK-N-SH cells (B) and primary neurons (C). (D–G) Interaction of BCL2 and BAX detected by immunoprecipitation with antibodies against BCL2 (D, E) and BAX (F, G) in SK-N-SH cells (D, F) and primary neurons (E, G). Data are expressed as mean ± SD (one-way analysis of variance). Control (Con); *P<0.05, ***P<0.001, ****P<0.0001 vs. rotenone (Rot) (n = 3).
Figure 10.
Figure 10.
PLG increases BCL2 phosphorylation by activating MAPK8. SK-N-SH cells and rat primary neurons were treated with rotenone; 2 h later, PLG (0.1 μM) was added for 24 h. Rapamycin (Rap; 40 nM for 6 h), an autophagy agonist, served as a positive control. (A, D) Western blot analysis of phospho-MAPK8 and phospho-BCL2 levels in SK-N-SH cells (A) and rat primary neurons (D). (B, E) Quantification of phospho-BCL2:BCL2 levels in SK-N-SH cells (B) and rat primary neurons (E). (C, F) Quantification of phospho-MAPK8:MAPK8 levels in SK-N-SH cells (C) and rat primary neurons (F). Data are expressed as mean ± SD (one-way analysis of variance). ## P<0.01, ####P<0.0001 vs. control (Con).****P<0.0001 vs. rotenone (Rot) (n = 3).
Figure 11.
Figure 11.
PLG inhibits caspase-dependent apoptosis induced by rotenone. SK-N-SH cells and rat primary neurons were treated with rotenone; 2 h later, PLG (0.1 μM) was added for 24 h. (A–D) CASP3 (A, C) and CASP9 (B, D) activity were detected to assess apoptosis in SK-N-SH cells (A, B) and primary neurons (C, D). (E, F) Apoptotic cells detected with the TUNEL assay; nuclei were counterstained with DAPI. (G) ANXA5 (A)-FITC-PI-stained SK-N-SH cells were detected by flow cytometry to assess apoptosis. (H) Quantification of the apoptosis ratio in SK-N-SH cells. Bar: 50 μm. Data are expressed as mean ± SD (one-way analysis of variance). ###P<0.001, ####P<0.0001 vs. control (Con); **P<0.01, ***P<0.001 vs. rotenone (Rot) (n = 3).
Figure 12.
Figure 12.
PLG induces autophagy and inhibits apoptosis by phosphorylating BCL2 at Ser70via MAPK8 activation. C57BL mice were treated with rotenone (10 mg/kg) for 6 wk followed by PLG (2 or 4 mg/kg) or l-dopa (20 mg/kg) for 4 wk. (A) Protein samples from the midbrain were used for immunoprecipitation and western blot analyses of phospho-BCL2 (Ser70) level, phospho-MAPK8 and LC3. (B, C) Quantification of LC3B-I to LC3B-II conversion (B), phospho-BCL2:BCL2 level (C) and phospho-MAPK8:MAPK8 level (D) in the midbrain. (E, F) Interaction of BCL2 and BECN1 detected by immunoprecipitation with antibodies against BECN1 (E) and BCL2 (F). (G, H) Interaction of BCL2 and BAX detected by immunoprecipitation with antibodies against BCL2 (G) and BAX (H). (I, J) CASP3 (I) and CASP9 (J) activities. Data are expressed as the mean ± SD (one-way analysis of variance). ###P<0.001 vs. control (Con); **P<0.01, ***P<0.001 vs. rotenone (Rot) (n = 3).
Figure 13.
Figure 13.
PLG restores the balance between apoptosis and autophagy by promoting BCL2 phosphorylation at Ser70. Rotenone induces mitochondrial damage by promoting the opening of mPTP, leading to CYCS/cytochrome C release, caspase activation, and apoptosis. PLG treatment promotes BCL2 phosphorylation at Ser70, which induces autophagy by blocking the interaction between BECN1 and BCL2 and also inhibit apoptosis by enhancing the interaction between BCL2 and BAX.

References

    1. Kalia LV, Lang AE. Parkinson's disease. Lancet. 2015;386:896−912. doi:10.1016/S0140-6736(14)61393-3. - DOI - PubMed
    1. Michel PP, Hirsch EC, Hunot S. Understanding Dopaminergic Cell Death Pathways in Parkinson Disease. Neuron. 2016;90:675−91. doi:10.1016/j.neuron.2016.03.038. - DOI - PubMed
    1. Franco-Iborra S, Vila M, Perier C. The Parkinson Disease Mitochondrial Hypothesis: Where Are We at? Neuroscientist. 2016;22:266−77. doi:10.1177/1073858415574600. - DOI - PubMed
    1. Perier C, Bove J, Vila M. Mitochondria and programmed cell death in Parkinson's disease: apoptosis and beyond. Antioxid Redox Signal. 2012;16:883−95. doi:10.1089/ars.2011.4074. - DOI - PubMed
    1. Youle RJ, Narendra DP. Mechanisms of mitophagy. Nat Rev Mol Cell Biol. 2011;12:9−14. doi:10.1038/nrm3028. - DOI - PMC - PubMed

Publication types

MeSH terms