. 2018 Feb 12;9(2):213.
doi: 10.1038/s41419-017-0242-x.

Autophagy mediates glucose starvation-induced glioblastoma cell quiescence and chemoresistance through coordinating cell metabolism, cell cycle, and survival

Affiliations

Autophagy mediates glucose starvation-induced glioblastoma cell quiescence and chemoresistance through coordinating cell metabolism, cell cycle, and survival

Lian Wang et al. Cell Death Dis. .

Abstract

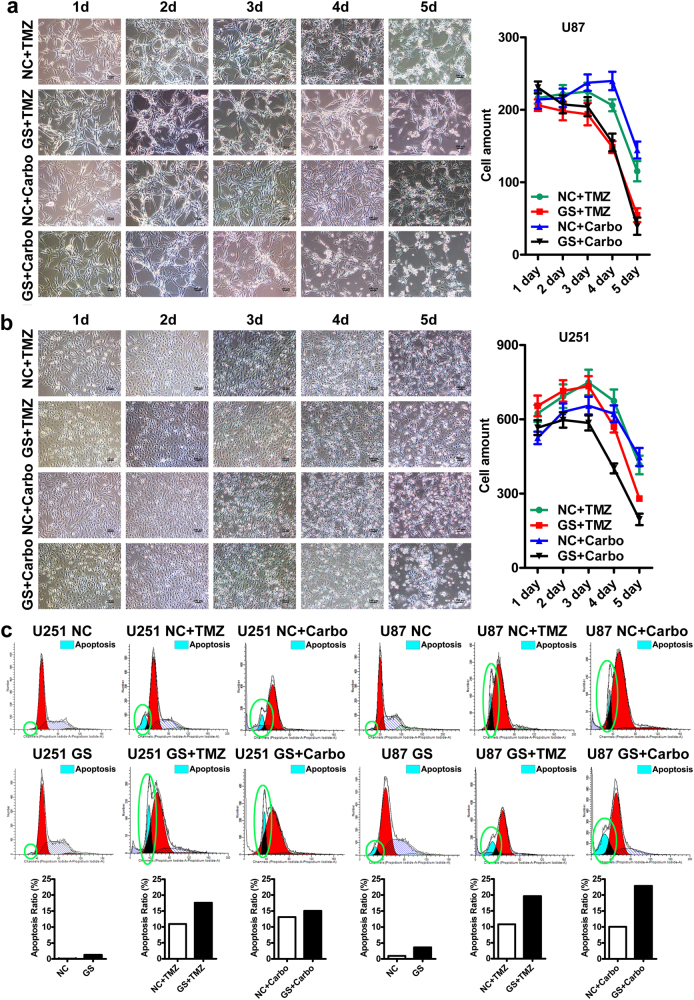
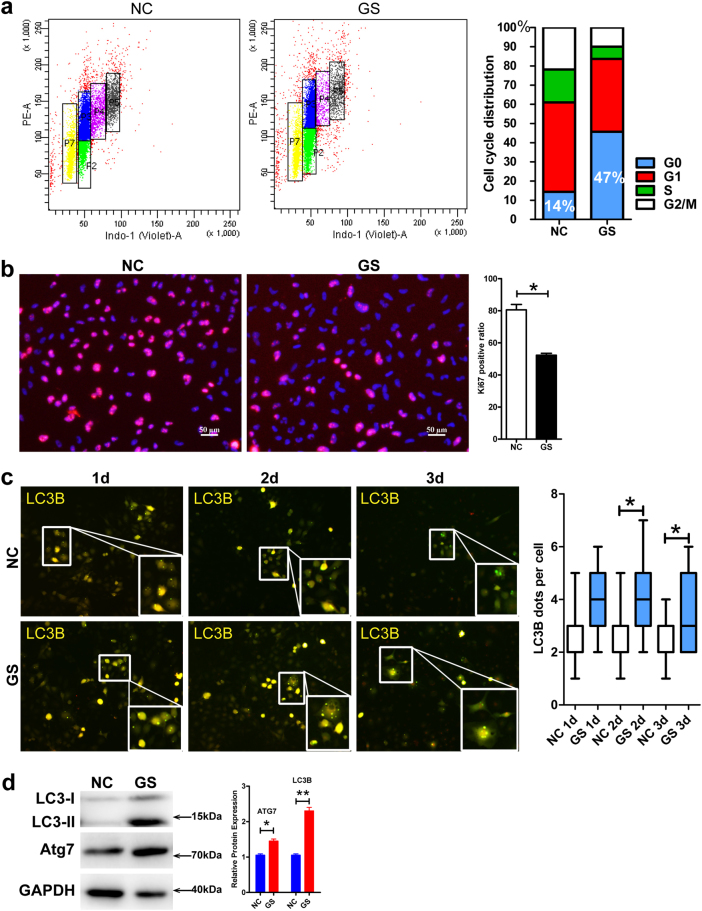
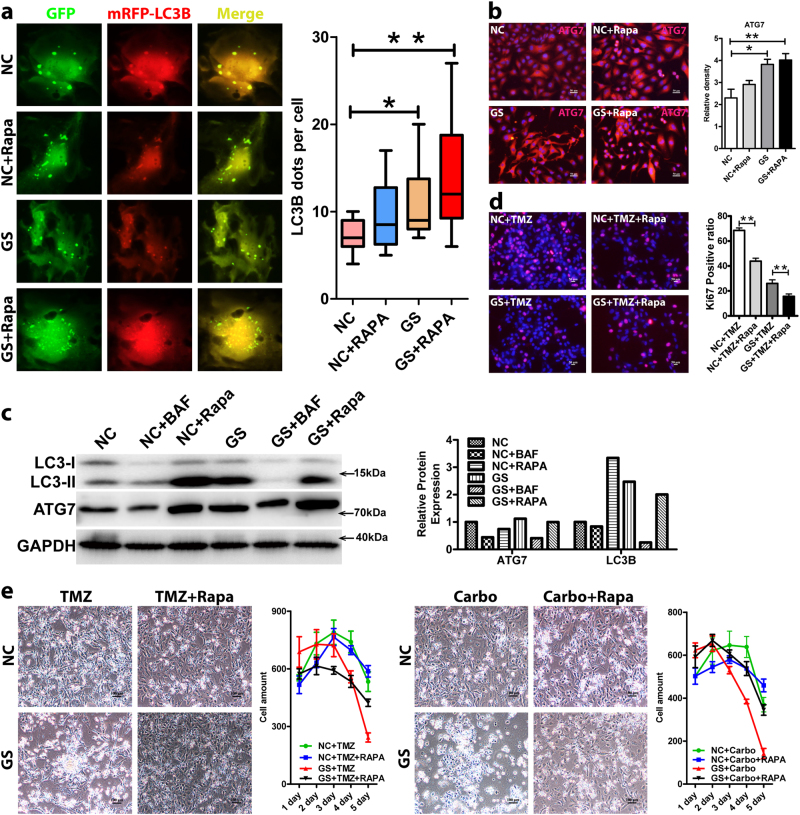
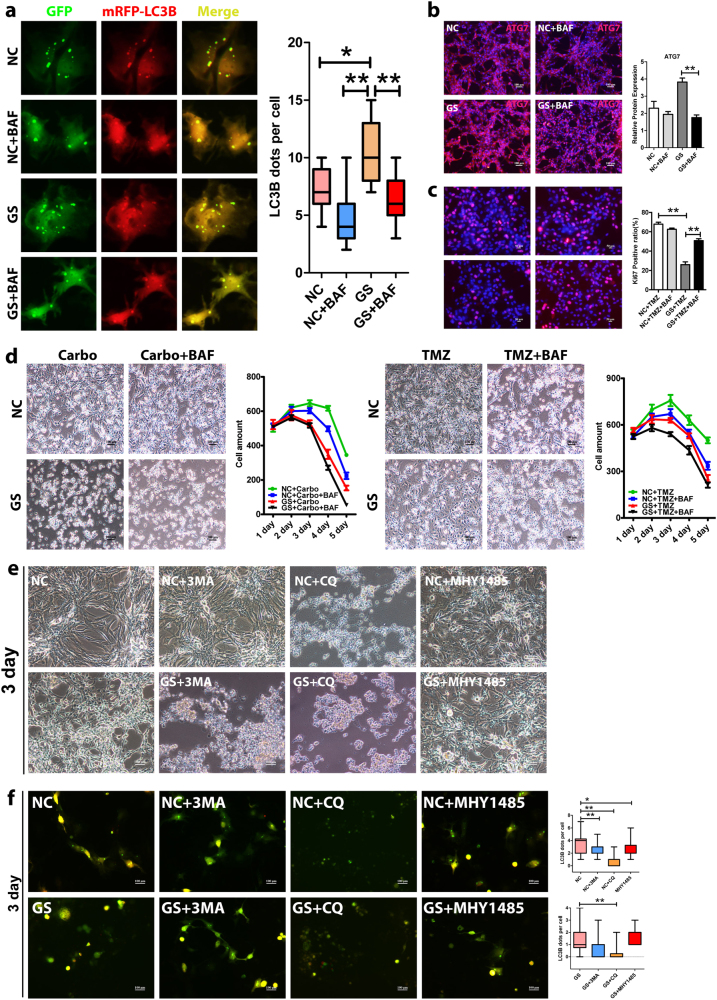
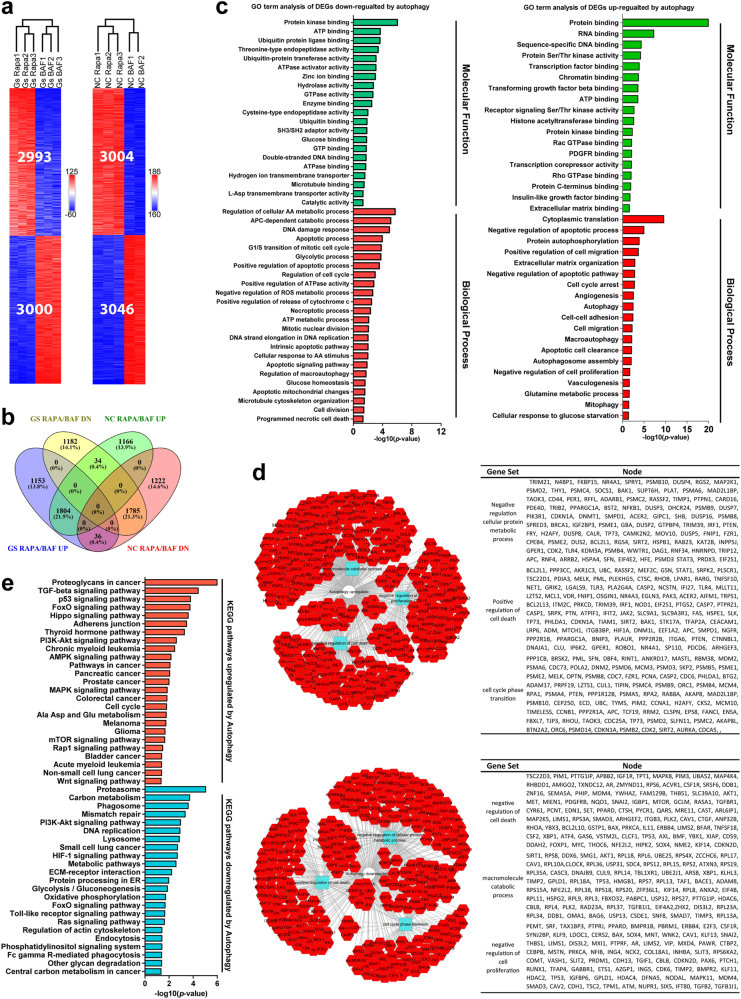
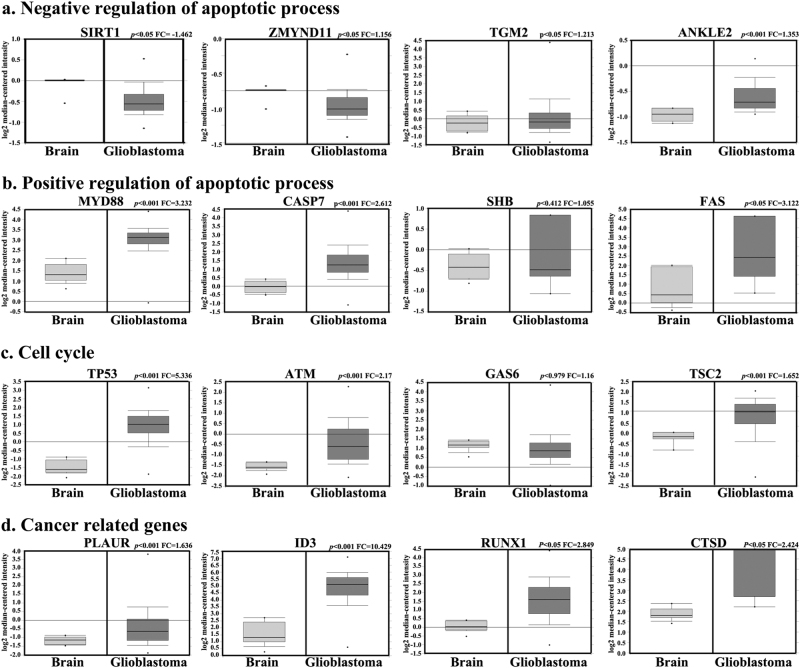
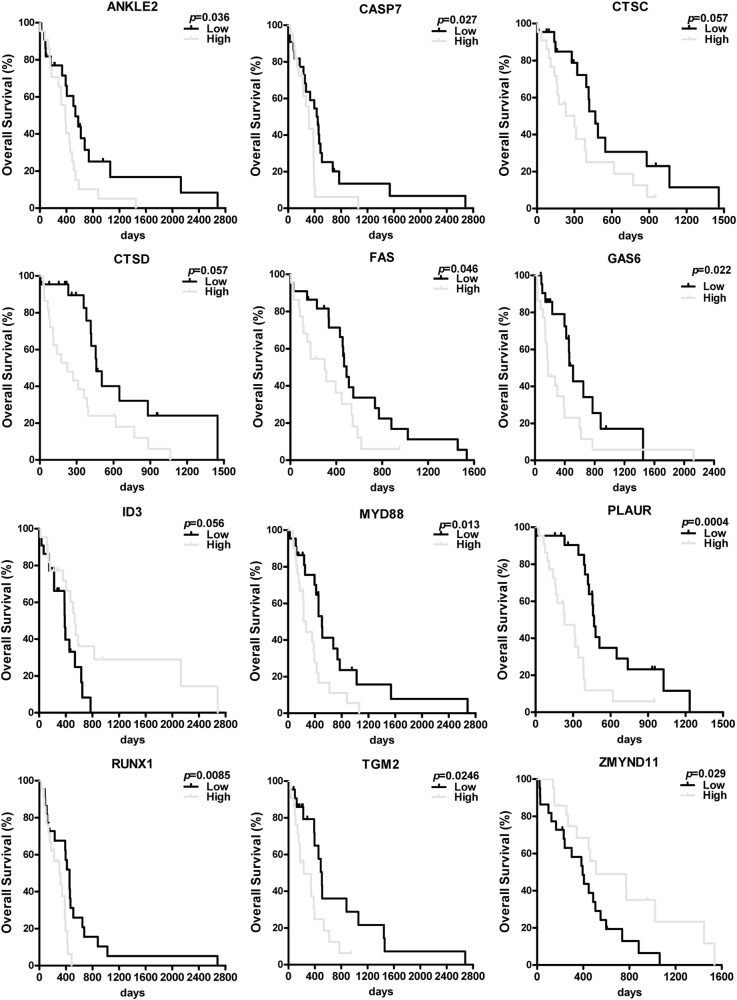
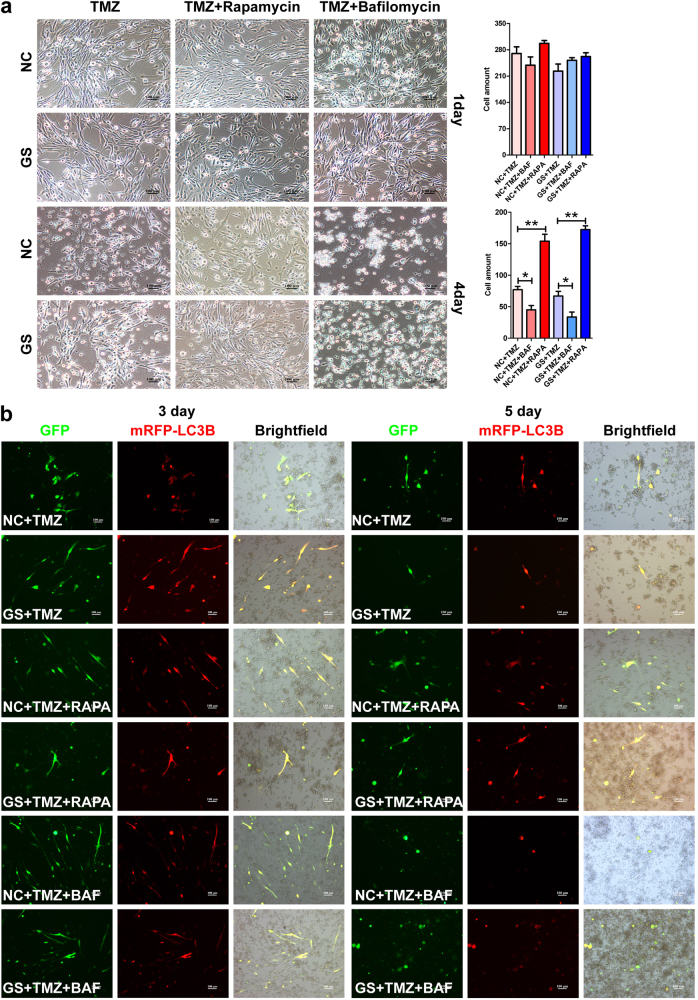
Metabolic reprogramming is pivotal to sustain cancer growth and progression. As such dietary restriction therapy represents a promising approach to starve and treat cancers. Nonetheless, tumors are dynamic and heterogeneous populations of cells with metabolic activities modulated by spatial and temporal contexts. Autophagy is a major pathway controlling cell metabolism. It can downregulate cell metabolism, leading to cancer cell quiescence, survival, and chemoresistance. To understand treatment dynamics and provide rationales for better future therapeutic strategies, we investigated whether and how autophagy is involved in the chemo-cytotoxicity and -resistance using two commonly used human glioblastoma (GBM) cell lines U87 and U251 together with primary cancer cells from the GBM patients. Our results suggest that autophagy mediates chemoresistance through reprogramming cancer cell metabolism and promoting quiescence and survival. Further unbiased transcriptome profiling identified a number of clinically relevant pathways and genes, strongly correlated with TCGA data. Our analyses have not only reported many well-known tumor players, but also uncovered a number of genes that were not previously implicated in cancers and/or GBM. The known functions of these genes are highly suggestive. It would be of high interest to investigate their potential involvement in GBM tumorigenesis, progression, and/or drug resistance. Taken together, our results suggest that autophagy inhibition could be a viable approach to aid GBM chemotherapy and combat drug resistance.


Conflict of interest statement

The authors declare that they have no conflict of interest.

Figures

Fig. 1
Fig. 1. Glucose starvation sensitizes glioblastoma cells to chemotherapies.
ab Glucose starvation (1.0 g/L) rendered both U87 (a) and U251 (b) cells more sensitive to chemotherapeutic drugs. By day 5, 40–50% cell death was induced by temozolomide (TMZ, 200 μM) or carboplatin (Carbo, 50 μM) treatment in U87 (a) and U251 cells (b) under normal glucose condition (4.5 g/L). The cell death rate was nearly doubled to 70–90% under glucose starvation condition. c Flow cytometry analysis by PI staining confirmed the synergetic cytotoxic effects between chemotherapies and glucose starvation. Dying cells were identified as the hypodiploids as denoted by the green circles. As depicted, the cell death rates in the lower panels were higher than that of the upper panels. In particular, when chemotherapeutic drugs were combined with glucose starvation as in lower panels (GS + TMZ, GS + Carbo), there were much more hypodiploid cells
Fig. 2
Fig. 2. Glucose starvation induces glioblastoma cells to exit cell cycle, enter quiescence, and upregulate autophagy.
a Under normal glucose condition, more than 80% GBM cells were cycling with only about 15% cells in G0 phase with low RNA content as denoted by PY staining. In contrast, with glucose starvation, only a little over 50% cells were cycling and 47% cells persisted as quiescent cells in G0 phase. b Consistent with flow cytometry analysis, there was a 30% decrease in Ki67+ proliferating cells with glucose starvation, compared to that with normal condition (*P < 0.05). c Glucose starvation upregulates autophagy as determined by the AAV-mRFP-GFP-LC3B reporter. The formation of autophagosomes representing autophagic activity was identified by yellow puncta containing both GFP and RFP signals. Quantification showed that there were significantly more yellow puncta with glucose starvation (lower panels) than that with normal condition (upper panels, starting from the second day, *P < 0.05). d Western blot analyses showed that the expression and cleavage of LC3B and the expression of ATG7 were significantly increased with glucose starvation. GAPDH served as an internal control (*P < 0.05, **P < 0.01). NC normal glucose condition, GS glucose starvation condition
Fig. 3
Fig. 3. Autophagy promotes glioblastoma cell quiescence, incurring chemoresistance.
a Rapamycin-enhanced autophagy (lower panels) determined by the AAV-mRFP-GFP-LC3B reporter (*P < 0.05, **P < 0.01). Under normal (upper panels) and glucose starvation condition, there were more yellow puncta with rapamycin than that without the treatment. Combination of rapamycin and glucose starvation induced more formation of autophagosomes (**P < 0.01). In particular, there were significantly more cells of high autophagic activity in the combined treatment group than any of the other treatment ones. b Rapamycin induced the expression of ATG7 in GBM cells under normal (upper panels) and glucose starvation condition (lower panels) determined by immunofluorescence staining. c Rapamycin induced the expression/cleavage of ATG7 and LC3B under both normal and glucose starvation conditions determined by western blot analysis, confirming rapamycin-inducing autophagy activity. NC normal glucose condition, GS glucose starvation condition, RAPA rapamycin. d Ki67 staining showed that GBM cell proliferation was significantly inhibited by 2-day rapamycin treatment under both normal and glucose starvation conditions (**P < 0.01). e Rapamycin desensitized glucose-starved GBM cells to chemotherapeutic drugs and promoted their survival. Treatment with either TMZ (200 μM) or Carbo (50 μM) induced over 50 and 80% GBM cell death with normal and glucose starvation conditions, respectively. Although it had little survival effect under normal condition, rapamycin dramatically reduced the cytotoxicity and rescued cell survival under glucose starvation condition. In the combined group, over 50% GBM cells survived, a twofold increase compared to that with the glucose starvation alone group. TMZ temozolomide, Carbo carboplatin
Fig. 4
Fig. 4. Autophagy inhibition alleviates chemoresistance of glioblastoma cells.
a Bafilomycin A1 (BAF) inhibited autophagy (lower panels) determined by the AAV-mRFP-GFP-LC3B reporter (*P < 0.05, **P < 0.01). Under normal (upper panels) and glucose starvation condition, there were significantly less yellow puncta with bafilomycin A1 than that without the treatment (*P < 0.05, **P < 0.01). b BAF downregulated the expression of ATG7 only slightly with normal (upper panels) but significantly with glucose starvation condition (lower panels) as examined by immunofluorescence staining. In addition, as shown in Fig. 3c, bafilomycin A1 repressed the expression/cleavage of ATG7 and LC3B under both normal and glucose starvation conditions determined by western blot analysis. NC normal glucose condition, GS glucose starvation condition. c Ki67 staining showed that GBM cell proliferation was significantly enhanced by bafilomycin A1 under glucose starvation conditions (**P < 0.01). After 2-day treatment of BAF, the percentage of Ki67-positive cells nearly doubled (26–50%) under glucose starvation condition (*P < 0.05, **P < 0.01). d BAF further sensitized glucose-starved GBM cells to chemotherapeutic drugs. The BAF enhanced the cytotoxicity under both normal and glucose starvation conditions. In particular, it effectively killed the subsets of cells that otherwise would have had entered quiescence, escaping from the chemotherapeutic drugs under the glucose starvation condition. As well, autophagy inhibition rendered the cells die faster and earlier (also refer to Supplementary Figure 3). e The synergistic effect of autophagy inhibition with chemotherapeutic drugs was independently confirmed by two other autophagy inhibitors of 3-MA and CQ. Nonetheless, the autophagy inhibitor MHY1485 failed to produce synergistic effect. 3-MA, 3-methyladenine, CQ hydroxychloroquine sulfate. f As revealed by the AAV-mRFP-GFP-LC3B reporter, both 3-MA and CQ effectively inhibited autophagy but MHY1485 failed to significantly repress autophagy, explaining its failure to produce synergistic effect
Fig. 5
Fig. 5. Key genes and pathways regulated by autophagy in glioblastoma.
a Clustering analyses revealed differentially expressed genes (DEGs) between the experimental groups with different autophagy manipulations. Under normal condition, there were 3004 genes upregulated and 3046 genes downregulated by autophagy. Under glucose starvation condition, there were 2993 genes upregulated and 3000 genes downregulated by autophagy. b A total of 1804 genes were upregulated and 1785 were downregulated significantly by autophagy under both normal and glucose starvation conditions. c Gene ontology analysis of autophagy-regulated genes revealed many important processes related to cell metabolism/autophagy, cell cycle, death and survival etc., consistent with the phenotypical changes. d PPI network analysis revealed that the most upregulated modules were related to macromolecule catabolic process, negative regulation of cell proliferation and negative regulation of cell death and the downregulated modules consisted of those related to negative regulation of cellular protein metabolic process, positive regulation of cell death and cell cycle phase transition. e KEGG pathway analysis revealed that DEGs altered by autophagy were enriched in cell metabolism, DNA replication, cell growth, and cell cycle as well as cancer-related pathways
Fig. 6
Fig. 6. Autophagy-regulated genes differentially expressed between glioblastoma and normal tissues as revealed by TCGA data mining with Oncomine platform.
A high correlation between the TCGA database and our results was evident. A large number of the DEGs from our RNA-seq analysis were differentially expressed between GBM and normal tissues. Representative examples were grouped and presented based on their biological functions a negative regulation of apoptotic process; b positive regulation of apoptotic process; c cell cycle; d cancer-related gene. Most of these genes were well-known molecules associated with cancers while the rest may merit further investigation. One of the genes, Gas6, was differentially regulated in GBM cell lines by autophagy but did not show a significant change between GBM and normal tissues because its expression was highly variable among the GBM patient tissues. However, the patients with high expression of Gas6 had significantly shorter survival time than those with low expression (refer to Fig. 7)
Fig. 7
Fig. 7. Many differentially expressed genes demonstrated strong prognostic value for glioblastoma patients.
Many of the differentially expressed genes demonstrated strong prognostic value for patient survivals. Some of the genes are known associated with tumorigenesis (e.g., Fas and Id3) while others (e.g., Ankle2, Zmynd11, and Tgm2) have not been previously reported in cancers and/or GBM. Nonetheless, the known functions of these genes are highly suggestive for their potential roles in brain tumors. For each DEG, the 152 patients were arbitrarily divided as 76 patients with high expression versus 76 patients with low expression
Fig. 8
Fig. 8. Autophagy modulates the sensitivity of GBM primary cells to chemotherapy.
a The effects of autophagy to chemoresistance were confirmed with primary cells from GBM patients. Similar to what was observed with GBM cell lines, upon 5-day drug treatment, while autophagy inhibition by bafilomycin A1 sensitized the primary cancer cells to death, autophagy induction by rapamycin dramatically attenuated the cytotoxicity of chemotherapy and promoted cancer cell survival. b As determined by the AAV-mRFP-GFP-LC3B reporter assay, for all the groups, most of the surviving cells manifested high level of autophagic activity after 5-day treatment, suggesting that autophagy underlies the chemoresistance of GBM primary cells

References

    1. Altman BJ, Stine ZE, Dang CV. From Krebs to clinic: glutamine metabolism to cancer therapy. Nat. Rev. Cancer. 2016;16:619–634. doi: 10.1038/nrc.2016.71. - DOI - PMC - PubMed
    1. Liberti MV, Locasale JW. The Warburg effect: how does it benefit cancer cells? Trends Biochem. Sci. 2016;41:211–218. doi: 10.1016/j.tibs.2015.12.001. - DOI - PMC - PubMed
    1. Vander Heiden MG, Cantley LC, Thompson CB. Understanding the Warburg effect: the metabolic requirements of cell proliferation. Science. 2009;324:1029–1033. doi: 10.1126/science.1160809. - DOI - PMC - PubMed
    1. Healy ME, et al. Dietary effects on liver tumor burden in mice treated with the hepatocellular carcinogen diethylnitrosamine. J. Hepatol. 2015;62:599–606. doi: 10.1016/j.jhep.2014.10.024. - DOI - PMC - PubMed
    1. Klement RJ. Mimicking caloric restriction: what about macronutrient manipulation? A response to Meynet and Ricci. Trends Mol. Med. 2014;20:471–472. doi: 10.1016/j.molmed.2014.07.001. - DOI - PubMed

Publication types