. 2018 Feb 12;8(1):2851.
doi: 10.1038/s41598-018-21317-w.

Expression and replication of virus-like circular DNA in human cells

Affiliations

Expression and replication of virus-like circular DNA in human cells

Sebastian Eilebrecht et al. Sci Rep. .

Abstract

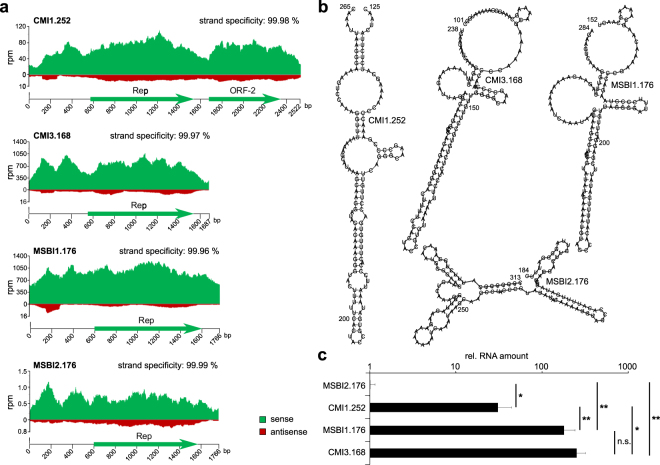
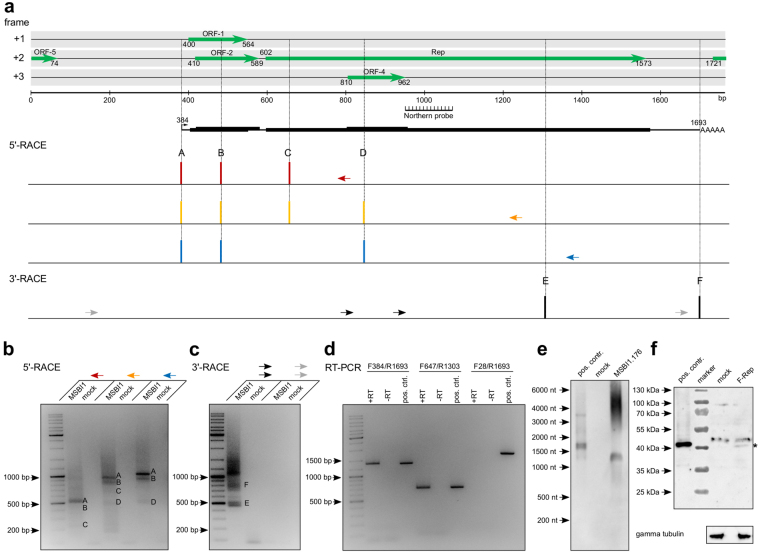
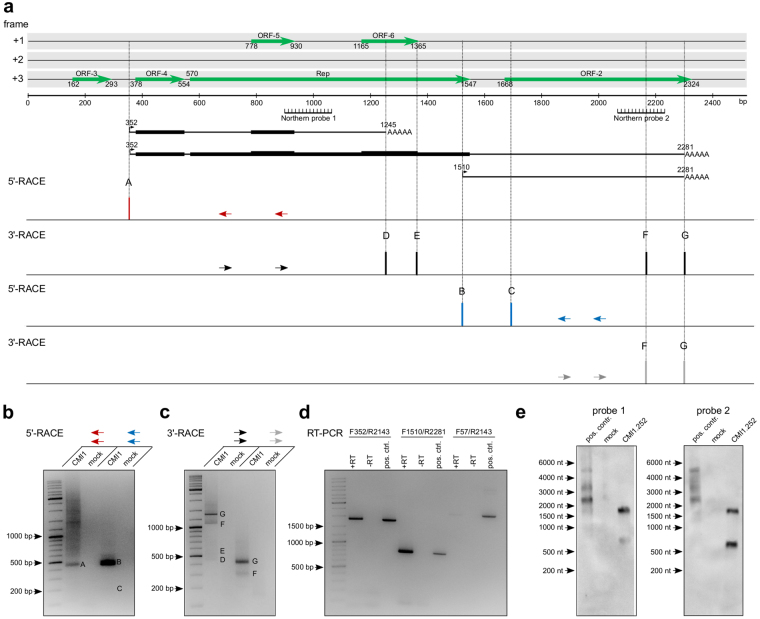
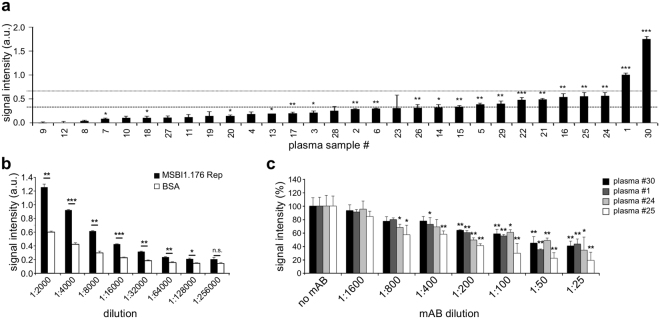
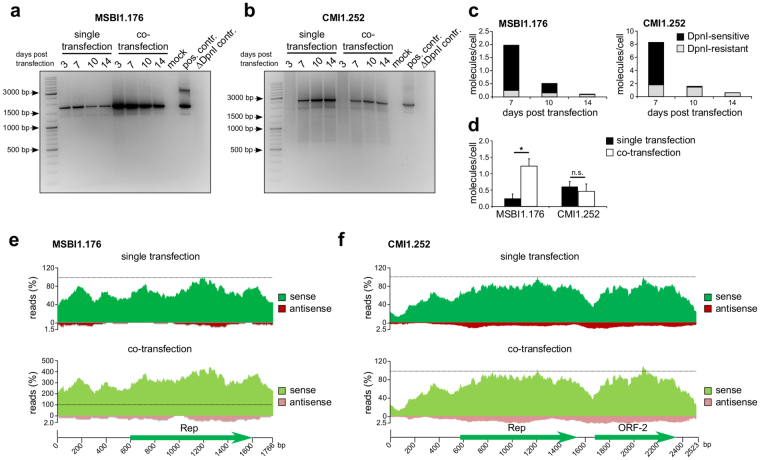
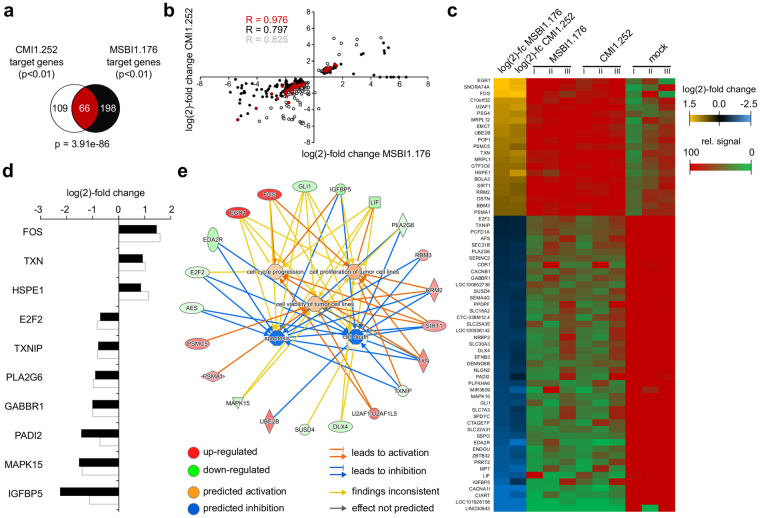
The consumption of bovine milk and meat is considered a risk factor for colon- and breast cancer formation, and milk consumption has also been implicated in an increased risk for developing Multiple Sclerosis (MS). A number of highly related virus-like DNAs have been recently isolated from bovine milk and sera and from a brain sample of a MS patient. As a genetic activity of these Acinetobacter-related bovine milk and meat factors (BMMFs) is unknown in eukaryotes, we analyzed their expression and replication potential in human HEK293TT cells. While all analyzed BMMFs show transcriptional activity, the MS brain isolate MSBI1.176, sharing homology with a transmissible spongiform encephalopathy-associated DNA molecule, is transcribed at highest levels. We show expression of a replication-associated protein (Rep), which is highly conserved among all BMMFs, and serological tests indicate a human anti-Rep immune response. While the cow milk isolate CMI1.252 is replication-competent in HEK293TT cells, replication of MSBI1.176 is complemented by CMI1.252, pointing at an interplay during the establishment of persistence in human cells. Transcriptome profiling upon BMMF expression identified host cellular gene expression changes related to cell cycle progression and cell viability control, indicating potential pathways for a pathogenic involvement of BMMFs.


Conflict of interest statement

These studies were supported by an unrestricted grant of the ORYX company, Munich (provided to H. zur Hausen).

Figures

Figure 1
Figure 1
Transcriptional activity of BMMFs and MS brain isolates in HEK293TT cells. (a) HEK293TT cells were transfected with circular CMI1.252, CMI3.168, MSBI1.176 and MSBI2.176 genomes. Total RNA was isolated 72 hours post transfection and digested with DNaseI before rRNAs were depleted. The resulting RNA samples were used for strand-specific library generation and next generation sequencing (NGS) of RNA. The strand-specificity of each dataset is given in %. RNA-Seq reads were mapped to each strand of each isolate. Mapped read counts were normalized to the number of total read pairs per run in millions (rpm). Reads mapping to the sense strand are colored in green, reads mapping to the antisense strand are colored in red. ORFs larger than 100 amino acids are indicated. (b) Secondary structures of small antisense RNAs generated from the non-coding regions of CMI1.252, CMI3.168, MSBI1.176 and MSBI2.176 as indicated by the RNA-Seq results. Secondary structures have been calculated using RNAfold algorithm. The nucleotide numbers are indicated according to the corresponding full genome sequence. (c) RT-qPCR assessment of the transcription levels of CMI1.252, CMI3.168, MSBI1.176 and MSBI2.176 in HEK293TT cells. Circular CMI1.252, CMI3.168, MSBI1.176 or MSBI2.176 was transfected into HEK293TT cells, total RNA was isolated 72 hours post transfection and subjected to reverse transcription using random hexamer primers followed by qPCR quantification of the resulting cDNA using isolate-specific primers. The resulting RNA amounts for each isolate were normalized to the expression of beta actin as a housekeeping gene, before BMMF RNA amounts were normalized to that of MSBI2.176, whose RNA amount was arbitrarily set to 1. The RT-qPCR results shown have been generated from three biological replicates per condition. Statistical significance was calculated using a paired student’s t-test; *p < 0.05, **p < 0.01, n.s. = not significant.
Figure 2
Figure 2
Definition of messenger RNAs transcribed from MSBI1.176. (a) Linear representation of the MSBI1.176 genome including ORFs larger than 40 amino acids for the sense strand. The position of the RNA probe for northern blot analyses (Fig. 2e) is indicated. For 5′-RACE, primers located in different regions of the Rep-ORF were used (indicated as red, yellow and blue arrows). Each reproducibly detected transcription start site for each primer is plotted against the location within the genome. For 3′-RACE, nested PCRs were performed with the indicated primers (black and grey arrows). Each reproducibly detected polyadenylation site is plotted against the location within the genome. Putative transcripts arising from the combination of the 5′- and 3′-RACE results, whose existence was supported by northern blot, and their coding potentials are shown. (b) Agarose gel image of the MSBI1.176-specific 5′-RACE products obtained by PCR using the primers indicated in panel (a). cDNA of mock-transfected cells was used as a negative control. Specific start sites are indicated by letters according to panel (a). (c) Agarose gel image of the respective 3′-RACE products obtained by nested PCR using the primers indicated in panel (a). Specific polyadenylation sites are indicated as letters according to panel (a). (d) Validation of continuous transcripts using RT-PCR. Total RNA of MSBI1.176-transfected cells was reverse transcribed using oligo-dT primers (+RT) and the resulting cDNA was subjected to PCR reactions using the indicated primer combinations. RT reactions lacking reverse transcriptase served as negative controls (−RT) and PCR reactions using linearized MSBI1.176 DNA as a template served as a positive control.(e) Northern blot validation of MSBI1.176 transcripts in HEK293TT cells using an antisense RNA probe as indicated in (a). Mock-transfected cells served as a negative control circular MSBI1.176 genome served as a positive control. (f) Detection of MSBI1.176 Rep translation in HEK293TT cells transfected with a genome version containing a N-terminal FLAG tag fused to the Rep ORF (F-Rep) using an anti-FLAG antibody. An overexpressed Rep-FLAG fusion protein was used as a positive control and total protein of mock-transfected cells was used as a negative control. Gamma tubulin was used as a loading control.
Figure 3
Figure 3
Definition of messenger RNAs transcribed from CMI1.252. (a) Linear representation of the CMI1.252 genome including ORFs larger than 40 amino acids for the sense strand. The position of the RNA probes for northern blot analyses (Fig. 3e) are indicated. For 5′-RACE, nested PCR was performed using primers located within the Rep-ORF (indicated as red arrows) and within the ORF-2 (blue arrows). Each reproducibly detected transcription start site for each primer is plotted against the location within the genome. For 3′-RACE, nested PCR was performed using the indicated primers (black and grey arrows). Each reproducibly detected polyadenylation site is plotted against the location within the genome. Transcripts arising from the combination of the 5′- and 3′-RACE results, whose existence was supported by northern blots, as well as their coding potentials are shown. (b) Agarose gel image of the CMI1.252-specific 5′-RACE products obtained by PCR using the different primers indicated in panel (a). cDNA of mock-transfected cells was used as a negative control. Specific start sites are indicated by letters according to panel (a). (c) Agarose gel image of the respective 3′-RACE products obtained by nested PCR using the primers indicated in panel (a). Specific polyadenylation sites are indicated as letters according to panel (a). (d) Validation of continuous transcripts using RT-PCR. Total RNA of CMI1.252-transfected cells was reverse transcribed using oligo-dT primers (+RT) and the resulting cDNA was subjected to PCR reactions using the indicated primer combinations. RT reactions lacking reverse transcriptase was used as negative controls (−RT) and PCR reactions using linearized CMI1.252 DNA as a template served as a positive control. (e) Northern blot validation of CMI1.252 transcripts in HEK293TT cells. Antisense RNA probes complementary to nt 883–1051 (probe 1) or nt 2074–2264 (probe 2) of CMI1.252 were used to detect transcripts in CMI1.252-transfected HEK293TT cells. Mock-transfected cells served as a negative control and circular CMI1.252 genome served as a positive control.
Figure 4
Figure 4
Detection of an antibody response to MSBI1.176 Rep protein in human plasma. (a) Thirty human plasma samples were screened for an anti-MSBI1.176 Rep protein antibody response using ELISA assays. The signal intensity is given in arbitrary units (a.u.). Signals are ordered by size and the standard deviation is given based on technical triplicates. The average signal and the sum of average signal and standard deviation of all plasma samples are indicated as dotted lines. Statistical significance as compared to background signal was assessed by student’s t-test from technical triplicates. *p < 0.05; **p < 0.01; ***p < 0.001. (b) Quantification of anti-MSBI1.176 Rep protein antibody titers in human plasma. A dilution series (1:1.000 to 1:128.000) of plasma sample # 30 (see panel (a)) was tested for anti-MSBI1.176 Rep reactivity (black) in ELISA assays as compared to reactivity against BSA (white). Statistical significance was assessed by student’s t-test. *p < 0.05; **p < 0.01; ***p < 0.001; n.s. not significant. (c) Analysis of anti-Rep specificity of human plasma antibodies. The MSBI1.176 Rep protein coated on ELISA plates was pre-incubated with increasing amounts of an anti-Rep mouse monoclonal antibody pool prior to ELISAs with the human plasma samples #30, #1, #24 and #25. ELISAs with Rep protein lacking a pre-incubation were used as a control reaction (no mAB), whose signal was set to 100%. Statistical significance of the difference to this control reaction were calculated using a paired student’s t-test. *p < 0.05; **p < 0.01.
Figure 5
Figure 5
CMI1.252 complements MSBI1.176 during DNA replication in HEK293TT cells. (a) HEK293TT cells were co-transfected with equal molecular amounts of circular CMI1.252 and MSBI1.176 (co-transfection) or each isolate alone (single transfection). Total DNA was isolated at days 3, 7, 10 and 14 post transfection and subsequently subjected to extensive DpnI digestion. DpnI-resistant- full length MSBI1.176 DNA was detected for each time point in each condition by long PCR using MSBI1.176-specific back-to-back primers. DNA of mock transfected cells was used as a negative control. 1ng of the circularized E.coli-generated MSBI1.176 DNA was used as a template for a positive control. DpnI digestion efficiency was tested using the same amount of DpnI-digested circularized E.coli-generated MSBI1.176 DNA (ΔDpnI control). (b) as in (a) but detecting DpnI-resistant CMI1.252 DNA by long PCR using CMI1.252-specific back-to-back primers. (c) Absolute amounts of DpnI-sensitive (black) and DpnI-resistant (replicated, grey) DNA at days 7, 10 and 14 post transfection of MSBI1.176 and CMI1.252 were quantified by qPCR in biological triplicates. (d) Absolute amounts of DpnI-resistant DNA at day 14 post single or co-transfection of MSBI1.176 and CMI1.252 were quantified in biological triplicates by qPCR. Statistical significance was assessed by student’s t-test. *p < 0.05; n.s. not significant. (e) and (f) Effects of CMI1.252 and MSBI1.176 co-transfection on the transcriptional activity of both isolates. RNA samples harvested at day 3 post single or co-transfection of MSBI1.176 and CMI1.252 were used for strand-specific library generation and next generation sequencing (NGS) of RNA. RNA-Seq reads were mapped to each strand of each isolate and normalized to the maximum read count number in the single conditions, which were arbitrarily set to 100%. Reads mapping to the sense strand are colored in dark green for the single conditions and light green for the co-transfection condition, reads mapping to the antisense strand are colored in dark red for the single conditions and light red for the co-transfection condition. ORFs larger than 100 amino acids are indicated.
Figure 6
Figure 6
Human gene expression changes upon MSBI1.176 and CMI1.252 expression in HEK293TT cells. (a)Venn diagram of the gene sets statistically significantly (p < 0.01) regulated upon MSBI1.176 expression (black) as well as upon CMI1.252 expression (white). The common subset is highlighted in red and the corresponding hypergeometric distribution p-value is given below. Gene numbers for each set are indicated. (b) Scatter plot of the genes shown in panel (a) using the same colors. The log(2)-fold change in expression upon MSBI1.176 expression is plotted on the x-axis and the log(2)-fold expression change upon CMI1.252 expression is plotted on the y-axis. The Pearson correlation coefficients (R) for the common subset as well as for the remaining genes of each single target gene set are indicated. (c) Heatmap of the common subset of MSBI1.176- and CMI1.252-regulated human genes. The log(2)-fold change in gene expression in both conditions (MSBI1.176 and CMI1.252 expression) is indicated as a color code for the common subset of 66 genes. Up-regulated genes are colored in yellow, down-regulated genes are colored in blue. For each gene, the relative, normalized signal for three biological replicates is indicated as a color code. (d) Representative genes co-regulated upon MSBI1.176 and CMI1.252 expression. Expression changes upon MSBI1.176 expression are colored in black, those upon CMI1.252 expression are colored in white. (e) Representation of genes involved in regulation of cell cycle progression, proliferation and viability of tumor cell lines, cell death and apoptosis as identified by canonical pathway enrichment analyses of the common subset shown in panels (a) and (c). Genes, whose expression is up-regulated upon BMMF expression are colored in red, those whose expression is down-regulated are colored in green.

References

    1. WCRF World Cancer Research Fund, Food, nutrition, physical activity, and the prevention of cancer: a global perspective. AICR, (2007).
    1. Chan DS, et al. Red and processed meat and colorectal cancer incidence: meta-analysis of prospective studies. Plos One. 2011;8:e20456. doi: 10.1371/journal.pone.0020456. - DOI - PMC - PubMed
    1. Corpet DE. Red meat and colon cancer: should we become vegetarians, or can we make meat safer? Meat. Sci. 2011;89:310–316. doi: 10.1016/j.meatsci.2011.04.009. - DOI - PubMed
    1. Huxley RR, et al. The impact of dietary and lifestyle risk factors on risk of colorectal cancer: a quantitative overview of the epidemiological evidence. Int. J. Cancer. 2009;125:171–180. doi: 10.1002/ijc.24343. - DOI - PubMed
    1. Egeberg R, et al. Meat consumption, N-acetyl transferase 1 and 2 polymorphism and risk of breast cancer in Danish postmenopausal women. Eur. J. Cancer Prev. 2008;17:3939–3947. doi: 10.1097/CEJ.0b013e32809b4cdd. - DOI - PubMed

Publication types

MeSH terms