. 2018 Mar;25(3):279-288.
doi: 10.1038/s41594-018-0029-5. Epub 2018 Feb 12.

Cotranslational protein assembly imposes evolutionary constraints on homomeric proteins

Affiliations

Cotranslational protein assembly imposes evolutionary constraints on homomeric proteins

Eviatar Natan et al. Nat Struct Mol Biol. 2018 Mar.

Abstract

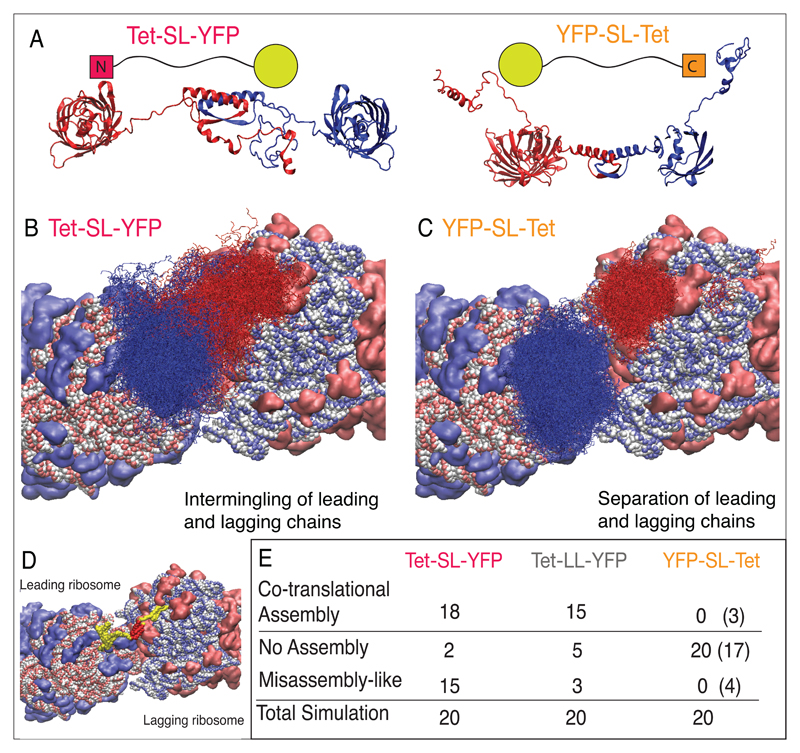
Cotranslational protein folding can facilitate rapid formation of functional structures. However, it can also cause premature assembly of protein complexes, if two interacting nascent chains are in close proximity. By analyzing known protein structures, we show that homomeric protein contacts are enriched toward the C termini of polypeptide chains across diverse proteomes. We hypothesize that this is the result of evolutionary constraints for folding to occur before assembly. Using high-throughput imaging of protein homomers in Escherichia coli and engineered protein constructs with N- and C-terminal oligomerization domains, we show that, indeed, proteins with C-terminal homomeric interface residues consistently assemble more efficiently than those with N-terminal interface residues. Using in vivo, in vitro and in silico experiments, we identify features that govern successful assembly of homomers, which have implications for protein design and expression optimization.


Conflict of interest statement

Conflict of interest

The authors declare that they have no competing financial interests.

Figures

Figure 1
Figure 1. Illustration of the possible cotranslational assembly of homomeric proteins.
The translation milieu, i.e. the immediate environment surrounding the translating mRNA, is enriched in nascent chains and proteins. For homomers, this increases the chance of oligomerization. Oligomerization of homomers can occur co-translationally, between nascent chains transcribed from the same mRNA (top left) or between nascent chains of two identical mRNAs copies (bottom left). Alternatively, oligomerization can occur between a nascent chain and a fully-translated protein (right). In either scenario, premature assembly or misassembly of partially folded proteins can occur.
Figure 2
Figure 2. Interface residues of native homomers are C-terminally enriched, correlating with stability of the protein.
(A-B) Distribution of interface residues in the N- vs. C-terminal halves of homomeric proteins. (A) Relative enrichment of interface residues in protein structures across all evolutionary groups. Residues are binned according to their position along the protein (N-terminus is 0, C-terminus is 1). Error bars represent standard error calculated from 106 bootstrapping replicates; p-value is calculated as the frequency in which N- vs. C-terminal enrichment was greater than observed in the actual dataset. (B) Relative enrichment in interface residues for all species with >100 (exact number in parentheses) non-redundant homomer structures in our dataset. Error bars represent standard error calculated from 104 bootstrapping replicates per species. The non-redundant sets of homomeric and heteromeric complexes are provided in Supplementary Data Set 5. (C) Image-based high-throughput screen reveals N-terminal enrichment of interface residues in aggregating homomers. The relative enrichment of interface-forming residues is shown in green and grey for ‘Green’ and ‘Dark’ cells, respectively. Error bars represent s.d. **p-value <0.01, *p-value <0.05, calculated as in panel (A). C-terminal enrichment is 11.8% for ‘Green’ cells and -12.1% for ‘Dark’ cells. (D) Fluorescence level distribution of ‘Dark’ and ‘Green’ cells with the median represented by the solid horizontal bar, first and third quartile by edges of box, and maximum and minimum by the whiskers, with values in above the 98th centile shown as individual dots. Fluorescence of 0 is equal to the mean fluorescence of E. coli cells not expressing GFP. p-value for fluorescence difference = 2.2e-16, Mann-Whitney U-test. (E) Normalized expression level of ‘Dark’ homomers and ‘Green’ homomers based on Western Blot analysis (p-value = 0.265, Mann-Whitney U-test) as presented in Supplementary Data Set 2. Medians represented by solid horizontal bars, first and third quartile by edges of box, and maximum and minimum by the whiskers, with values in above the 98th centile shown as individual black circles.
Figure 3
Figure 3. Position of the oligomerization domain is crucial for protein solubility.
(A) Confocal microscopy images of E. coli cells expressing Tet-SL-YFP and YFP-SL-Tet. (B) Western blot using an anti-HA tag located at the C-terminus of the construct. Uncropped blot image is shown in Suppl. Figure 4D. (C) FACS analyses of Tet-SL-YFP (left) and YFP-SL-Tet (right)-expressing E. coli strains. (D) Mean relative fluorescence intensity of YFP-SL-Tet fluorescence relative to Tet-SL-YFP fluorescence as measured in (C). Error bars representing s.d. from 5 independent cell culture replicates. (E) Mean ratio of tetrameric-to-monomeric variants, without (left) and with (right) co-expression of Tet-peptide. Error bars represent s.d of 5 independent cell culture replicates, **p-value <0.01, *p-value <0.05, double sided t-test.
Figure 4
Figure 4. Extending the linker decreases misassembly rates.
(A) Scheme depicting different constructs used in the study. All constructs have an oligomerization domain at the N-terminus, which differs by a single amino leading to tetrameric versus monomeric variants. (B) Fluorescence ratio from flow cytometry of cells expressing the constructs shown in (A), with tetrameric/monomeric Tet domain variants at the N-terminus, followed by three linker lengths, and YFP at the C-terminus. (C) Confocal microscopy images of E. coli cells expressing fast folding (fGFP, left) or slow folding GFP (right) reporter genes (no saturation was allowed). (D) Flow cytometry analysis of the mean ratio of tetrameric-to-monomeric variants for the reporter gene constructs similar to those shown in (B). Values in panel (B) and (D) are mean and s.d. of 5 independent cell culture replicates, **p-value <0.01, *p-value <0.05, double sided t-test. Error bars represent s.d. Flow cytometry data underlying panels (B) and (D) are available in Suppl. Figure S5.
Figure 5
Figure 5. Misassembly as a function of oligomerization, folding-rate and ribosome density, using PURE in vitro translation system.
(A) Mean fluorescence spectrometric ratio of tetrameric versus monomeric variants of fast folding (fGFP) and slow folding GFP (3 replicates). Error bars represent s.d. (B) Cartoon defining polysomic versus monosomic conditions used in the experiment (left). Mean fluorescence spectrometric ratio of tetrameric versus monomeric variants of fGFP and GFP constructs under polysomic and monosomic conditions (3 replicates) (right). Error bars represent s.d. (C) Mean fluorescence spectrometric values divided by Western blot quantification (WB) of 3 replicates, for fast and slow GFP folding reporters tested using three chaperone groups, KJE-mix, GroE-mix, and Trigger Factor. (D) Average relative protein solubility as measured by fluorescence or luminescence ratio (divided by Western blot quantification for total protein) for 3 replicates with and without the different chaperones for GFP, fGFP and Luc sub-libraries (see Supplementary Methods). p-value *< 0.05, ** < 0.01, NS = Not Significant, double sided t-test.
Figure 6
Figure 6. In silico simulation of the translation of different constructs.
(A) Schematic of constructs (top) and simulation snapshots (bottom) of cotranslational folding of two neighboring nascent chains of Tet-SL-YFP and YFP-SL-Tet (B-C) Cotranslational events as captured by simulations of polysomic translation. The relative positioning of the two ribosomes as observed previously. Composite plots showing regions typically sampled by two nascent chains up to the point at which translation of the first chain is completed. (D) Simulation snapshot showing the cotranslational assembly of two neighboring nascent chains. Tet is in red and YFP in yellow. (E) Number of co- or post-translational (in brackets) assembly events, misassembly-like events and total number of simulations.
Figure 7
Figure 7. Cotranslational (mis)assembly as a function of sequence-intrinsic features.
(A) Assembly requires generation of a sufficiently folded interface. Depending on the frequency and nature of encounters between interfaces, successful assembly (right) or misassembly (left) occurs. The position of the oligomerization domain, the length of the linker and the folding rate of the reporter-domain are some of the determining factors in this balance (Red circle signifies the mature protein). (B) Factors explored in this work that determine successful assembly. (C) Successful cotranslational assembly depends on the balance between the kinetics of translation, folding and assembly.

Similar articles

Cited by

References

    1. Elcock AH. Molecular simulations of cotranslational protein folding: fragment stabilities, folding cooperativity, and trapping in the ribosome. PLoS Comput Biol. 2006;2:e98. - PMC - PubMed
    1. Sander IM, Chaney JL, Clark PL. Expanding Anfinsen's principle: contributions of synonymous codon selection to rational protein design. J Am Chem Soc. 2014;136:858–61. - PMC - PubMed
    1. Pechmann S, Frydman J. Evolutionary conservation of codon optimality reveals hidden signatures of cotranslational folding. Nat Struct Mol Biol. 2013;20:237–43. - PMC - PubMed
    1. Levy ED, Teichmann S. Structural, evolutionary, and assembly principles of protein oligomerization. Prog Mol Biol Transl Sci. 2013;117:25–51. - PubMed
    1. Goodsell DS, Olson AJ. Structural symmetry and protein function. Annu Rev Biophys Biomol Struct. 2000;29:105–53. - PubMed

Publication types