. 2017 Dec 18;9(4):4833-4850.
doi: 10.18632/oncotarget.23373. eCollection 2018 Jan 12.

TNF-α inhibits SATB2 expression and osteoblast differentiation through NF-κB and MAPK pathways

Affiliations

TNF-α inhibits SATB2 expression and osteoblast differentiation through NF-κB and MAPK pathways

Chijian Zuo et al. Oncotarget. .

Abstract

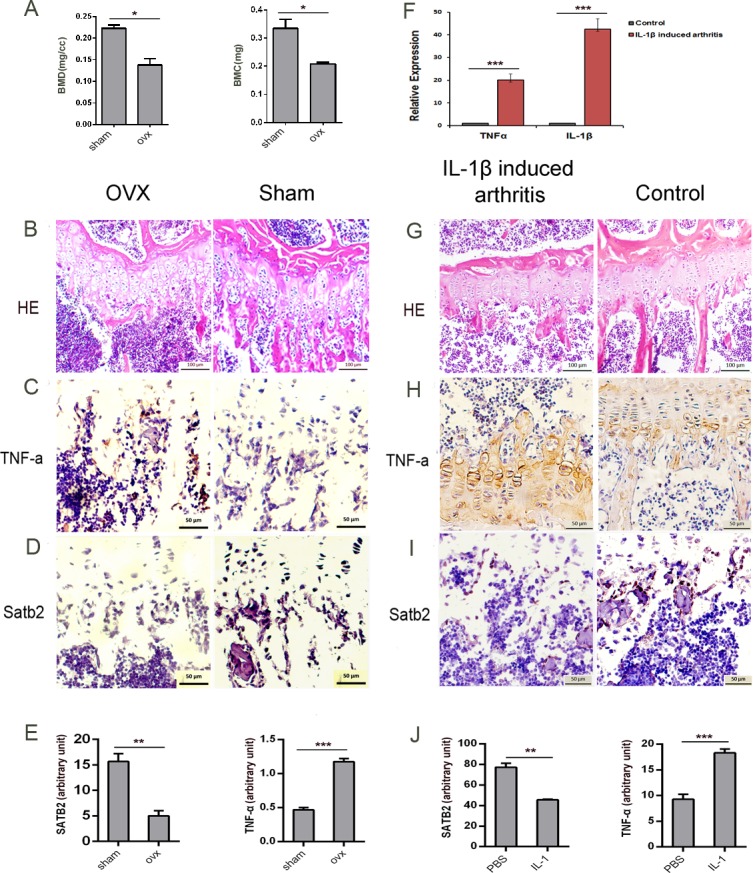
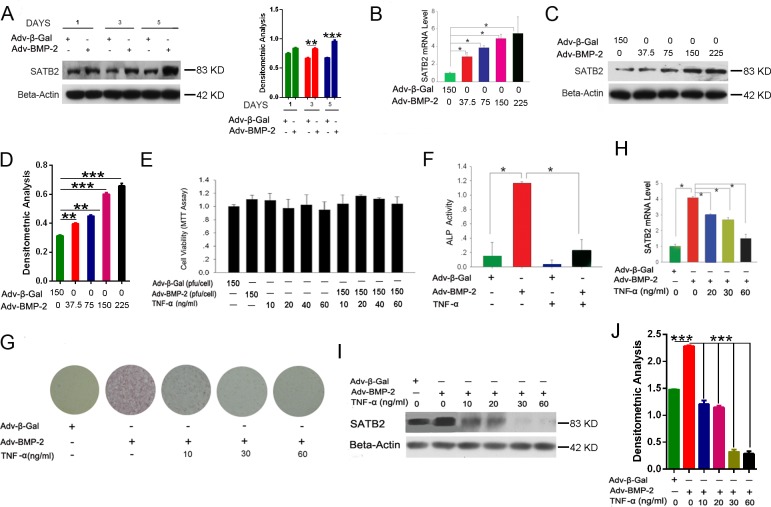
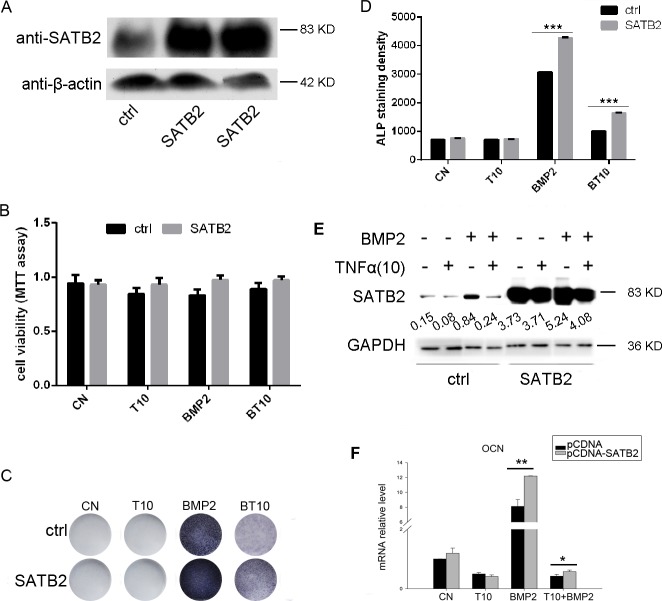
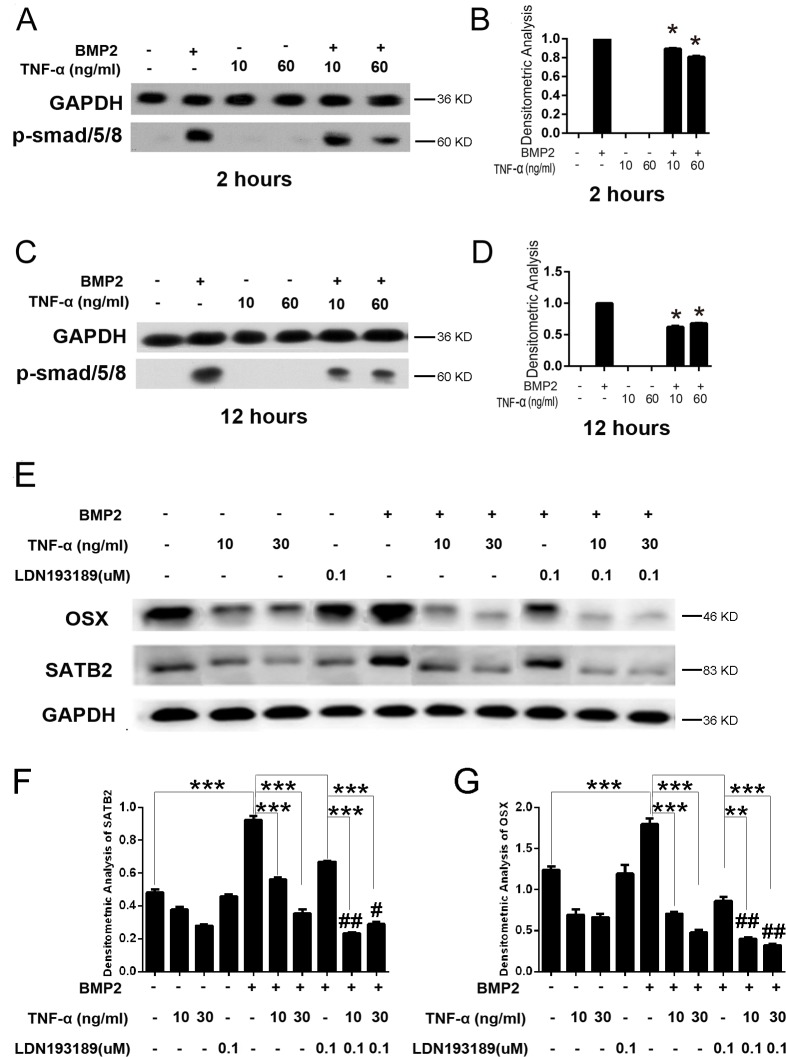
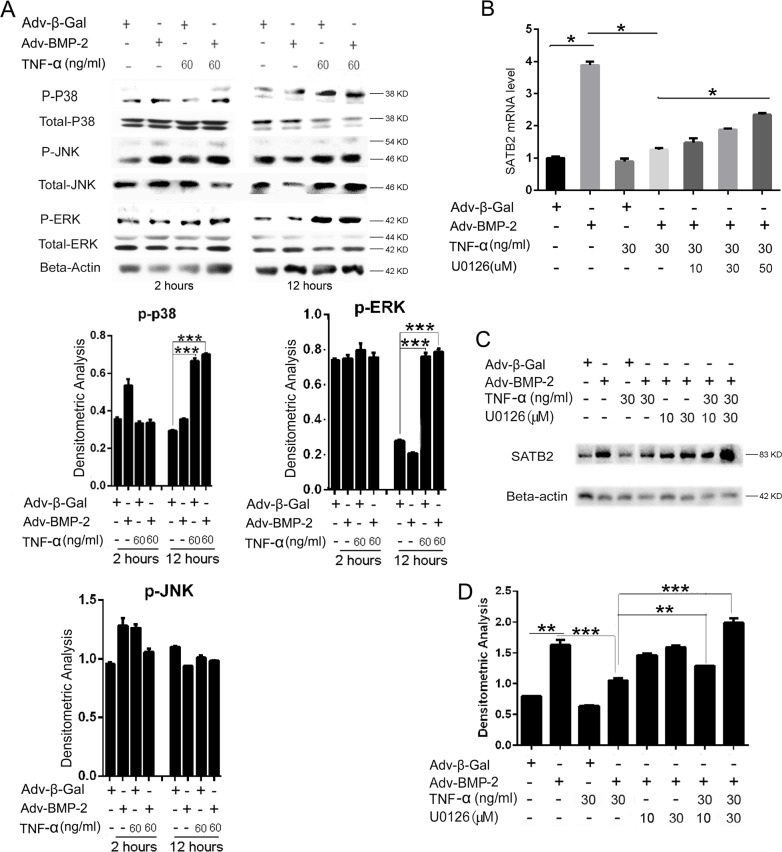
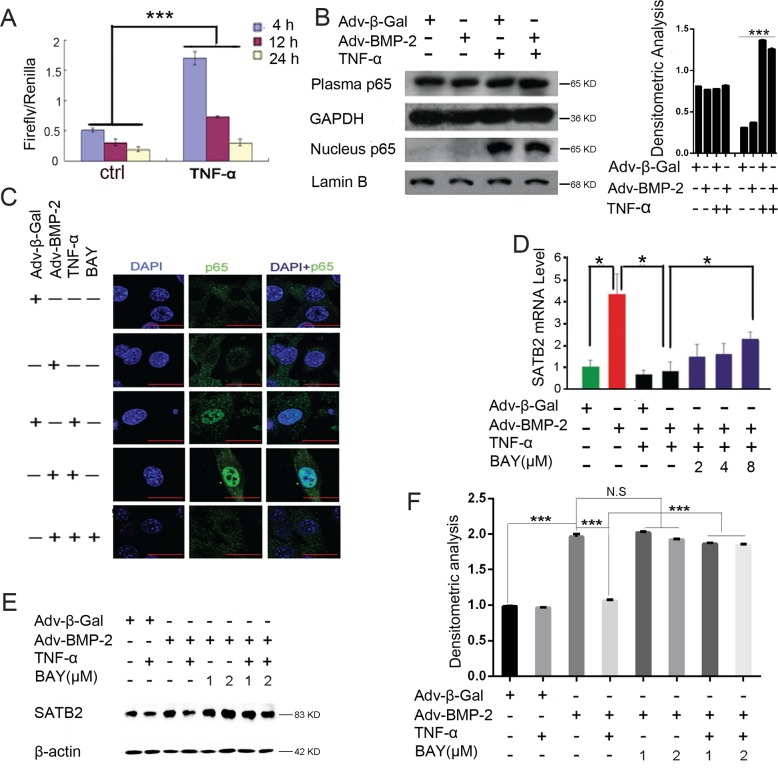
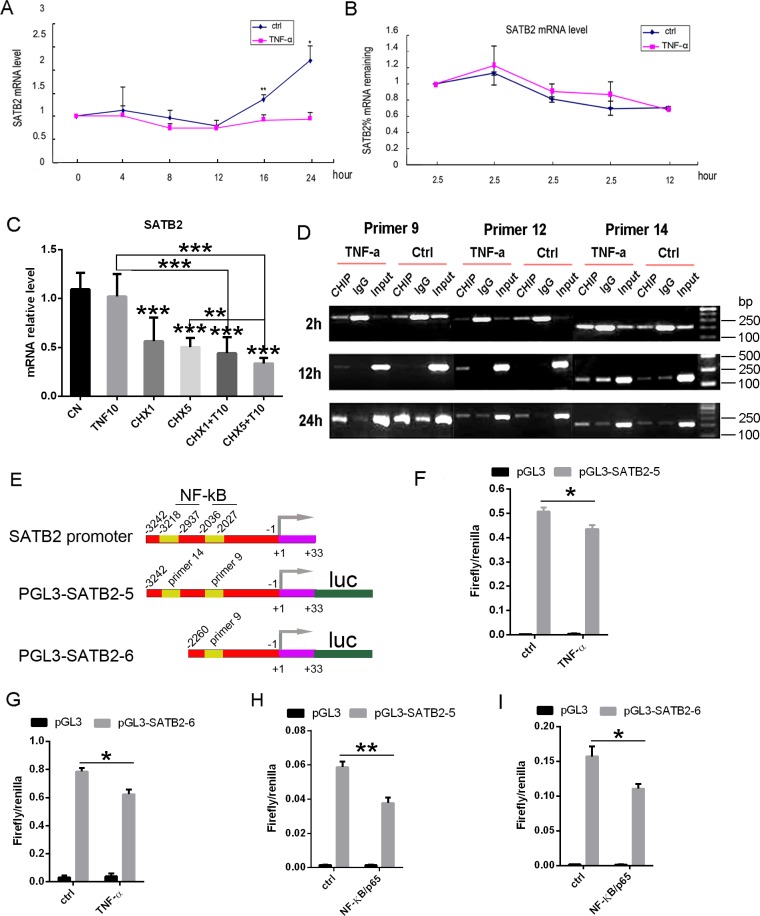
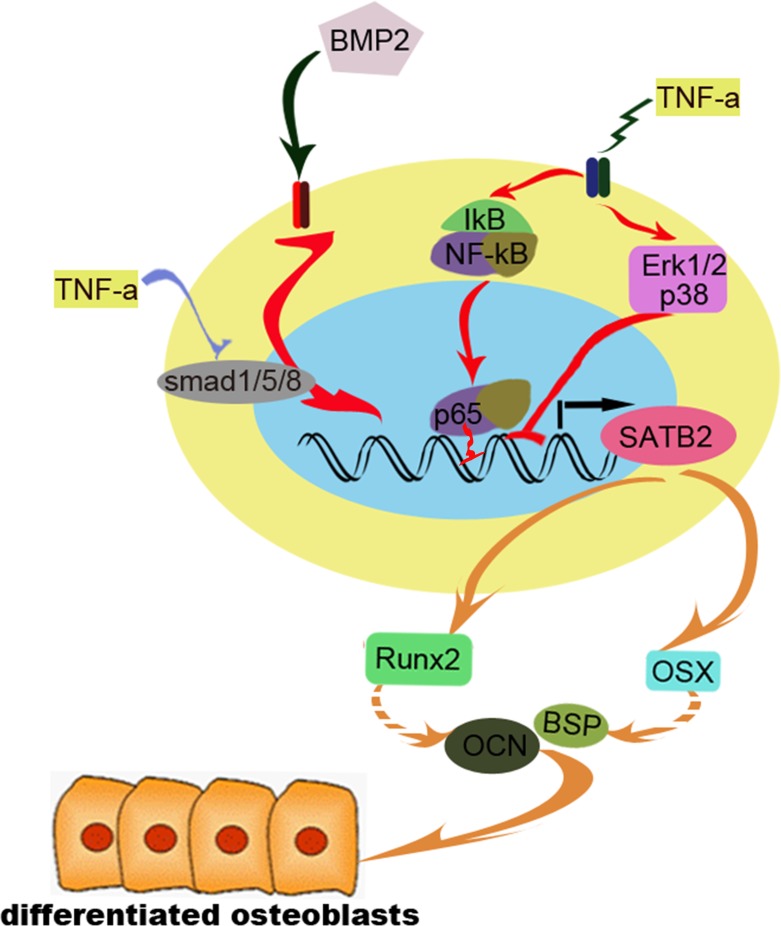
Although the mechanisms of Tumor necrosis factor alpha (TNF-α) on facilitating osteoclast differentiation and bone resorption is well known, the mechanisms behind the suppression of the osteoblast differentiation from mesenchymal stem cells (MSCs) are still poorly understood. In this study, we observed a negative correlation between TNF-α levels and the expression of special AT-rich sequence-binding protein 2 (SATB2), a critical osteoblastogenesis transcription factor, in ovariectomy (OVX)-induced bone loss and IL-1-induced arthritis animal model. We found that TNF-α treatment inhibited mesenchymal cell line C2C12 osteoblast differentiation and sharply decreased BMP2-induced SATB2 expression. Upon TNF-α treatment, the activity of smad1/5/8 was inhibited, by contrast, extracellular signal-regulated kinase-1/2 (ERK1/2) and P38 was increased in C2C12 cells, the inhibitor of ERK1/2 (U0126) was found to abrogate the TNF-α inhibition of SATB2 expression. Furthermore, the NF-κB signaling pathway in C2C12 cells was significantly activated by the treatment of TNF-α, and TNF-α induced NF-κB directly binds to SATB2 promoter to suppress its expression. These results suggest that TNF-α suppresses SATB2 expression through activating NF-κB and MAPK signaling and depressing smad1/5/8 signaling, which contributes to the inhibition of osteoblast differentiation and might be potential therapeutic targets for inflammation-induced bone loss.

Keywords: SATB2 inhibition; TNF-α; inflammation-induced bone loss; osteoblast differentiation.


Conflict of interest statement

CONFLICTS OF INTEREST The authors have declared that no conflicts of interest exists.

Figures

Figure 1
Figure 1. The expression level of SATB2 is negatively correlated with TNF-α level
(A) Bone Mineral Density (BMD), Bone Mass Index (BMI) of femurs from OVX and sham-operated mice (n = 9) were assessed. (B-D, G-I) Femurs from OVX (B, C, D left) and sham-operated (B, C, D right) mice, IL-1β- induced arthritis mice (G, H, I left) and saline-induced control mice (G, H, I right) are embedded and sectioned to undergo H&E staining (B, G) and immunohistochemistry with TNF-α (C, H) and SATB2 (D, I) antibodies. (E) Density analysis of C and D. (F) TNF-α and IL-1β were detected by ELISA from IL-1β- induced arthritis mice and saline-induced control mice synovia. (J) Density analysis of H and I. The data are presented as mean ± S.D. (n = 9; *p < 0.05; **p < 0.01; ***p < 0.001).
Figure 2
Figure 2. TNF-α inhibits osteoblastogenesis and SATB2 expression
(A) The C2C12 cells were treated with Adv-BMP2 (150 pfu/cell) or Adv-β-Gal (150 pfu/cell) for one, three, and five days and SATB2 expression was examined by western blot and then underwent densitometric analysis. (B, C, D) The C2C12 cells were treated with Adv-β-Gal (150 pfu/cell) or various concentrations of Adv-BMP2 for three days. The SATB2 relative mRNA levels (B) and protein levels (C) were assessed and densitometric analysis of C (D) was graphed. (E) The C2C12 cells were treated with Adv-β-Gal (150 pfu/cell), Adv-BMP2 (150 pfu/cell), or 10 ng/mL to 60 ng/mL of TNF-α for 72 h, then followed by MTT assay. (F) The C2C12 cells were treated with Adv-β-Gal (150 pfu/cell), Adv-BMP2 (150 pfu/cell), or 60 ng/mL of TNF-α for five days. ALP activity were measured. (G) The C2C12 cells were treated with Adv-β-Gal (150 pfu/cell), Adv-BMP2 (150 pfu/cell), or 10 ng/mL to 60 ng/mL of TNF-α for five days and ALP staining was performed. (H_J) The C2C12 cells were treated with Adv-β-Gal (150 pfu/cell), Adv-BMP2 (150 pfu/cell), or 10 ng/mL to 60 ng/mL of TNF-α for 72 h. The SATB2 gene expressions were assessed by real-time PCR (H) and western blot (I) and densitometric analysis (J). The data are presented as mean ± S.D. (n = 3; *p < 0.05; **p < 0.01; ***p < 0.001), these western blot images were uncropped.
Figure 3
Figure 3. Over-expression of SATB2 rescues TNF-α inhibition of osteoblastogenesis
(A) SATB2 over-expression lentivirus and control lentivirus were transfected into C2C12 cells to construct cell lines that over-express SATB2 constantly, two cell lines were chosen and uncropped western blot images were shown. (B_E) Control cell lines and SATB2 over-expression cell lines from (A) were treated with or without 250 ng/ml BMP2 and TNF-α as indicated for 3 days, followed by MTT assay (B) and ALP staining (C). The ALP staining density in figure B were analyzed with image J software (D) and the SATB2 expression levels were detected using western blotting and uncropped western blot images were shown (E). (D) C2C12 cells were transfected with pCDNA3.1+ vector or pCDNA3.1+-SATB2 vector and then treated with TNF-α or BMP2 (250ng/ml) as indicated for 5 days, the OCN mRNA levels were measured with real time RT-PCR. The data are presented as mean ± S.D. (n=3, *p < 0.05; **p < 0.01; ***p < 0.001, T10 means 10 ng/ml TNF-α, BT10 means 250 ng/ml BMP2 and 10 ng/ml TNF-α).
Figure 4
Figure 4. TNF-α inhibits SATB2 expression by inhibiting the smad1/5/8 signaling pathway
(A, C) The C2C12 cells were treated with Adv-β-Gal (150 pfu/cell), Adv-BMP2 (150 pfu/cell), 10 ng/mL or 60 ng/mL of TNF-α for 2 or 12 h. Cell lysates were used to analyze p-smad1/5/8 activation. The GAPDH were used as loading controls. (B, D) Densitometric analysis of A and C respectively. (E) The C2C12 cells were treated with Adv-β-Gal (150 pfu/cell), Adv-BMP2 (150 pfu/cell), 10 ng/mL or 30 ng/mL of TNF-α, 0.1μM of LDN193189 for 72 h. The SATB2 and OSX expression levels were detected by western blotting. (F, G) Densitometric analysis of E. The data are presented as mean ± S.D. (n = 3; *p < 0.05; **p < 0.01; ***p < 0.001; #p < 0.01; ##p < 0.001 compared with the related same treatment without LDN193189 administration). Uncropped western blot images corresponding to Figure 4(A, C and E) were shown in Supplementary Figure 2 (A, B and C respectively).
Figure 5
Figure 5. TNF-α inhibits SATB2 expression by activating the MAPK-ERK signaling pathway
(A) The C2C12 cells were treated with Adv-β-Gal (150 pfu/cell), Adv-BMP2 (150 pfu/cell), or 60 ng/mL of TNF-α for 2 or 12 h. Cell lysates were used to analyze p-ERK, p-p38, and p-JNK activation. The total-ERK, total-p38, and total-JNK were used as loading controls, respectively. The relative densitometric analysis of p-p38, p-ERK and p-JNK were shown. These western blot images were uncropped. (B, C) The C2C12 cells were treated with Adv-β-Gal (150 pfu/cell), Adv-BMP2 (150 pfu/cell), 30 ng/mL of TNF-α or 10 μM to 50 μM of U0126 for 72 h. The SATB2 expression level was detected by real-time PCR (B) and western blotting (C). (D) Densitometric analysis of C. The data are presented as mean ± S.D. (n = 3; *p < 0.05; **p < 0.01; ***p < 0.001). Uncropped western blot images corresponding to Figure 5C was shown in Supplementary Figure 3.
Figure 6
Figure 6. TNF-α inhibits SATB2 expression by activating NF-κB
(A) The C2C12 cells were cotransfected with the pGL4.32[luc2P/NF-κB-RE/Hygro] vector and Rluc control reporter vector. 24 hours after transfection, the cells were treated with 40 ng/mL of TNF-α or PBS for 4h, 12h, 24h. Cell lysates were used to assess the luciferase activity. (B) The C2C12 cells were treated with Adv-β-Gal (150 pfu/cell), Adv-BMP2 (150 pfu/cell), or 60 ng/mL of TNF-α for 2 h. The cytoplasmic and nuclear proteins were isolated to assess the p65 level, uncropped western blot images and densitometric analysis of p65 were shown. (C) C2C12 cells were treated with Adv-β-Gal (150 pfu/cell), Adv-BMP2 (150 pfu/cell), 60 ng/mL of TNF-α or 8 μM of BAY11-7082 for 2 h and assayed to detect p65 protein (green) nuclear localization via a confocal microscopic method. DAPI (blue) was used for nuclear dyeing. (Bar=25μm) (D, E, F) The C2C12 cells were treated with Adv-β-Gal (150 pfu/cell), Adv-BMP2 (150 pfu/cell), 30 ng/mL of TNF-α, BAY11-7082 for 72 h. The SATB2 RNA expression levels (D) and protein levels (E, F) were examined. (F) The densitometric analysis for (E). The data are presented as mean ± S.D. (n = 3; *p < 0.05; **p < 0.01; ***p < 0.001; N.S means no significant difference). Uncropped western blot images corresponding to Figure 6E was shown in Supplementary Figure 4.
Figure 7
Figure 7. TNF-α induced NF-κB directly interacts with SATB2 gene promoter to inhibit its expression
(A) Time course of TNF-α action. C2C12 cells were treated with BMP2 and with or without TNF-a (10ng/ml) for indicated times, SATB2 mRNA was measured by real time RT-PCR. (B) SATB2 mRNA stability was not changed by TNF-α. C2C12 cells were treated with BMP2 (150ng/ml) for one day and then treated with actinomycin D (0.5ug/ml) 2 hours before TNF-a (10ng/ml) were added, followed by detecting SATB2 mRNA relative levels at indicated time. (C) New protein synthesis is not required for TNF-α inhibition of SATB2 expression. Cycloheximide (CHX) (1 ug/ml, 5 ug/ml) was added 2 h prior to TNF-α (10 ng/ml, 20 ng/ml). SATB2 mRNA was measured 24 h after the addition of TNF-α. (D) C2C12 cells were treated with Adv-BMP2 and 10ng/ml TNF-α for indicated times and CHIP assay were performed with NF-kB/P65 antibody, followed by PCR with indicated primers. The gels have been run under the same experimental conditions. Uncropped images corresponding to Figure 7D were shown in Supplementary Figure 5. (E) NF-κB associate sites on SATB2 promoter and the schema of luciferase reporter gene plasmids construction. (F, G, H, I) Luciferase assay. Luciferase assay with plasmid pGL3-SATB2-5 (F) or pGL3-SATB2-6 (G) and treated with TNF-α. Luciferase assay with plasmid pGL3-SATB2-5 (H) or pGL3-SATB2-6 (I) and combined with NF-κB/p65 over-expression. The data are presented as mean ± S.D. (n =3; *p < 0.05. **p < 0.001, ***p < 0.0001).
Figure 8
Figure 8. The diagram of our proposed working model
BMP2 stimulates SATB2 expression and this up-regulation could be significantly inhibited by TNF-α, TNF-α inhibits BMP2 induced smad1/5/8 signaling, activates pERK1/2 and p38 signaling, in addition, TNF-α stimulates NF-κB signaling which results in translocation of p65 into nuclear and binds to SATB2 promoter to suppress SATB2 expression. Furthermore, the expression of osteoblast differentiation marker genes and osteoblastogenesis were inhibited.

Similar articles

Cited by

References

    1. Zaidi M. Skeletal remodeling in health and disease. Nat Med. 2007;13:791–801. - PubMed
    1. Xu J, Wu HF, Ang ES, Yip K, Woloszyn M, Zheng MH, Tan RX. NF-κB modulators in osteolytic bone diseases. Cytokine Growth Factor Rev. 2009;20:7–17. - PubMed
    1. Baum R, Gravallese EM. Impact of inflammation on the osteoblast in rheumatic diseases. Curr Osteoporos Rep. 2014;12:9–16. - PMC - PubMed
    1. Gilbert L, He X, Farmer P, Rubin J, Drissi H, Van Wijnen AJ, Lian JB, Stein GS, Nanes MS. Expression of the osteoblast differentiation factor RUNX2 (Cbfa1/AML3/Pebp2αA) is inhibited by tumor necrosis factor-α. J Biol Chem. 2002;277:2695–2701. - PubMed
    1. Kaneki H, Guo R, Chen D, Yao Z, Schwarz EM, Zhang YE, Boyce BF, Xing L. Tumor necrosis factor promotes Runx2 degradation through up-regulation of Smurf1 and Smurf2 in osteoblasts. J Biol Chem. 2006;281:4326–4333. - PMC - PubMed

LinkOut - more resources