. 2017 Dec 21;9(4):4897-4914.
doi: 10.18632/oncotarget.23527. eCollection 2018 Jan 12.

Blood-brain barrier disruption induced by diagnostic ultrasound combined with microbubbles in mice

Affiliations

Blood-brain barrier disruption induced by diagnostic ultrasound combined with microbubbles in mice

Bingxia Zhao et al. Oncotarget. .

Abstract

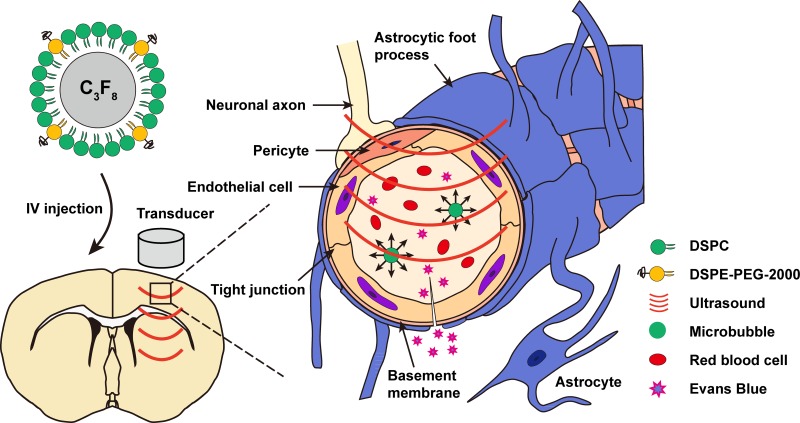
Objective: To investigate the effects of the microbubble (MB) dose, mechanism index (MI) and sonication duration on blood-brain barrier (BBB) disruption induced by diagnostic ultrasound combined with MBs as well as to investigate the potential molecular mechanism.

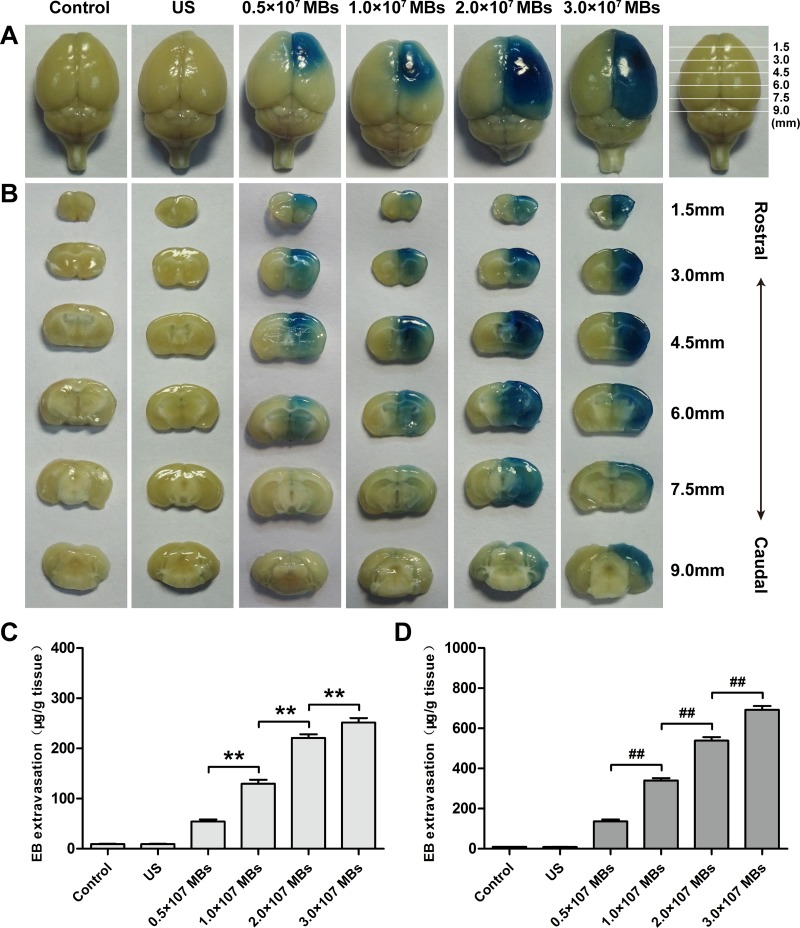
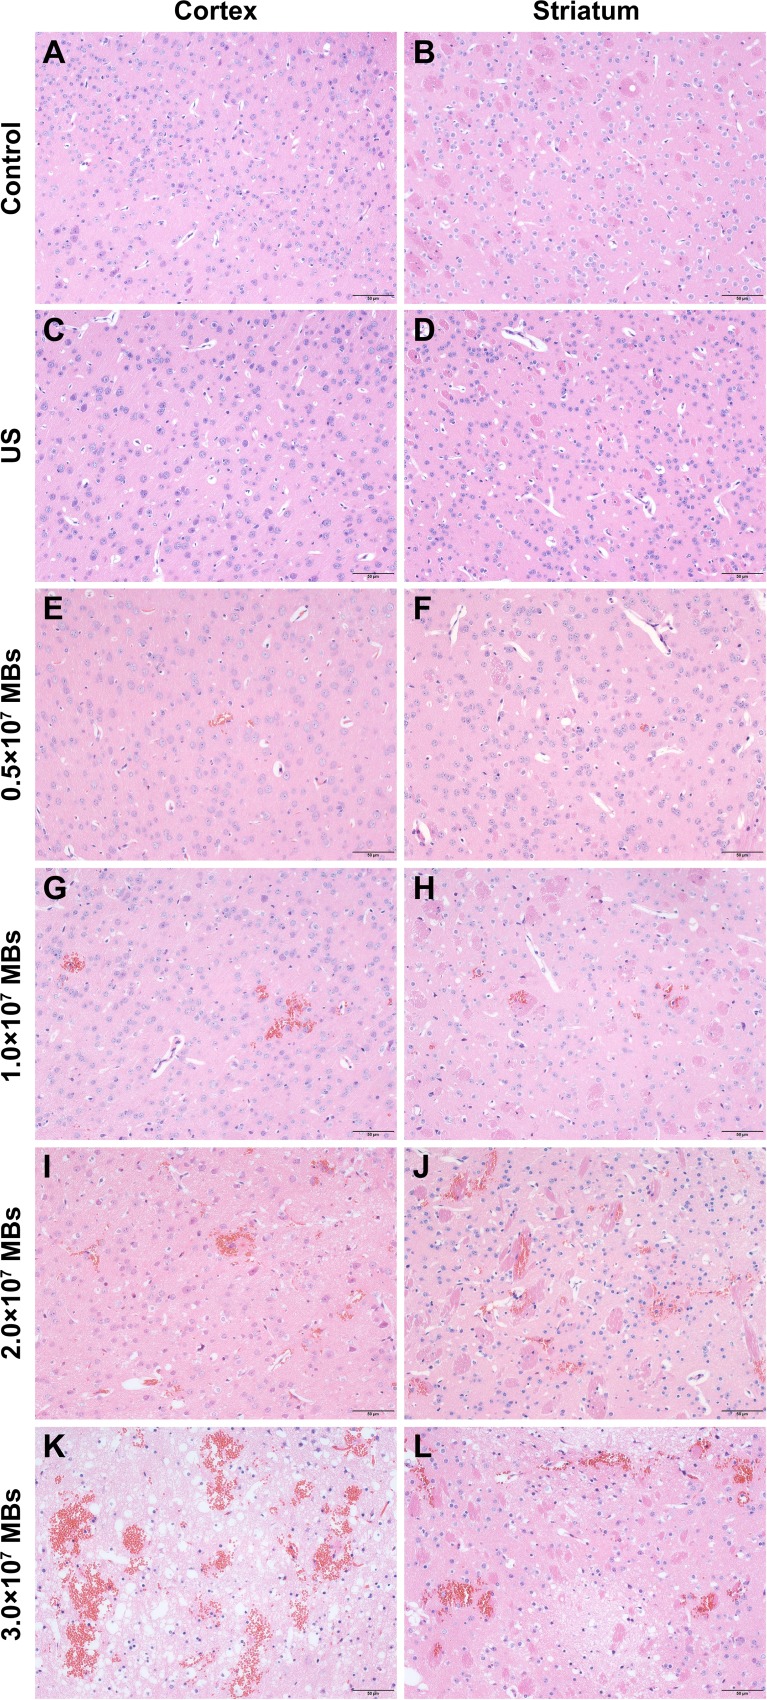
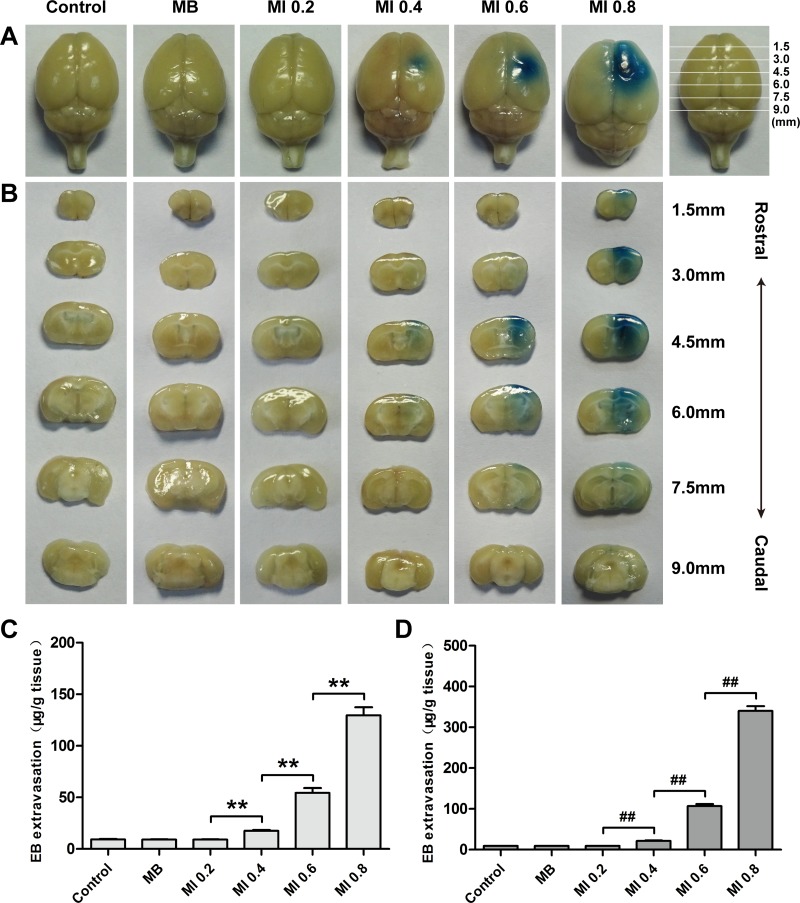
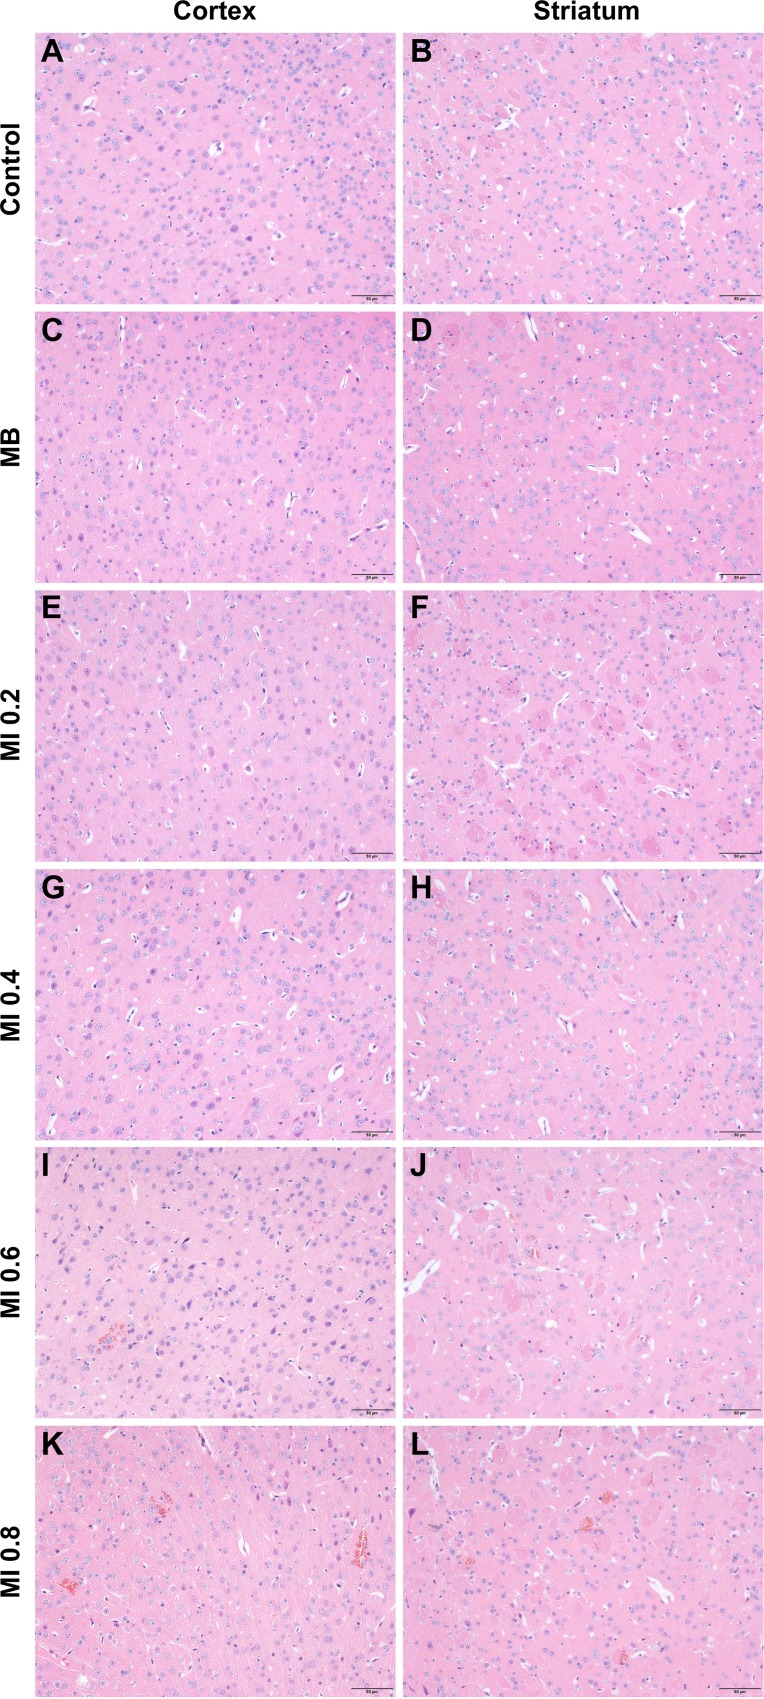
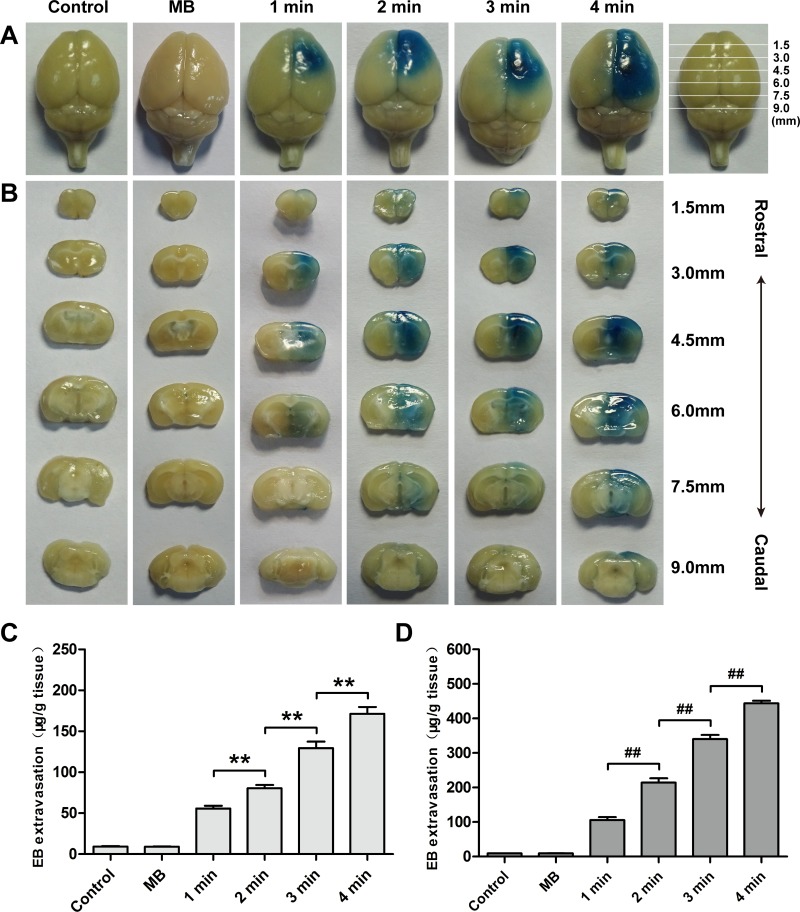
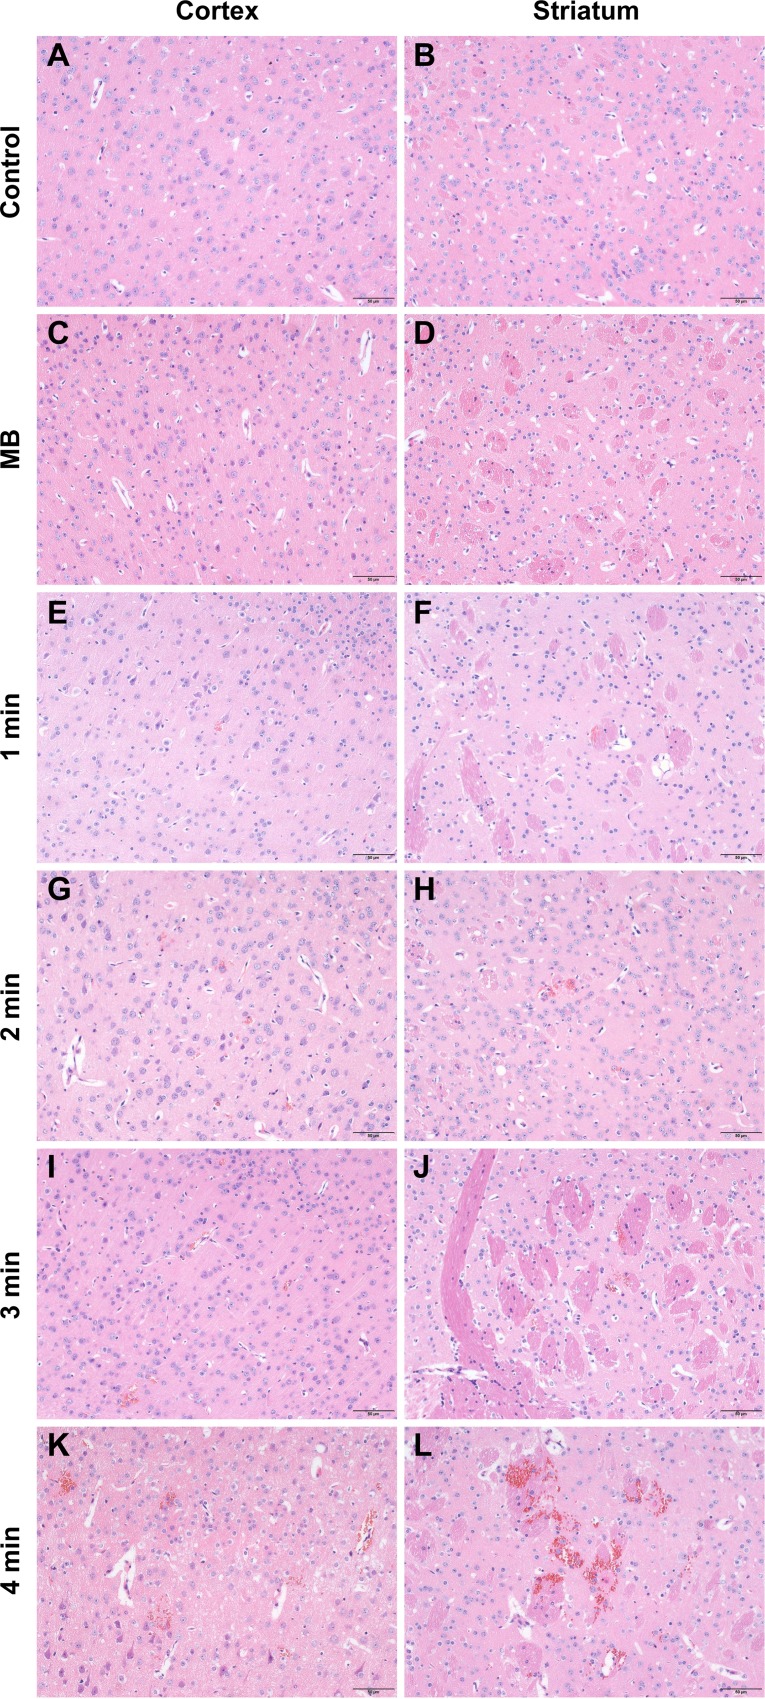
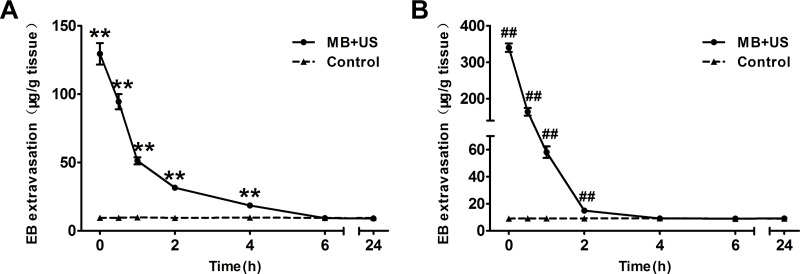
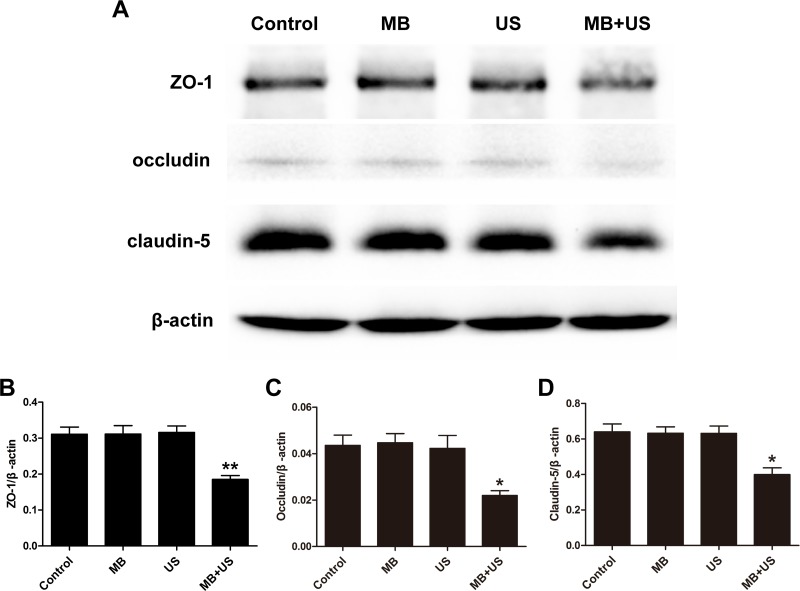
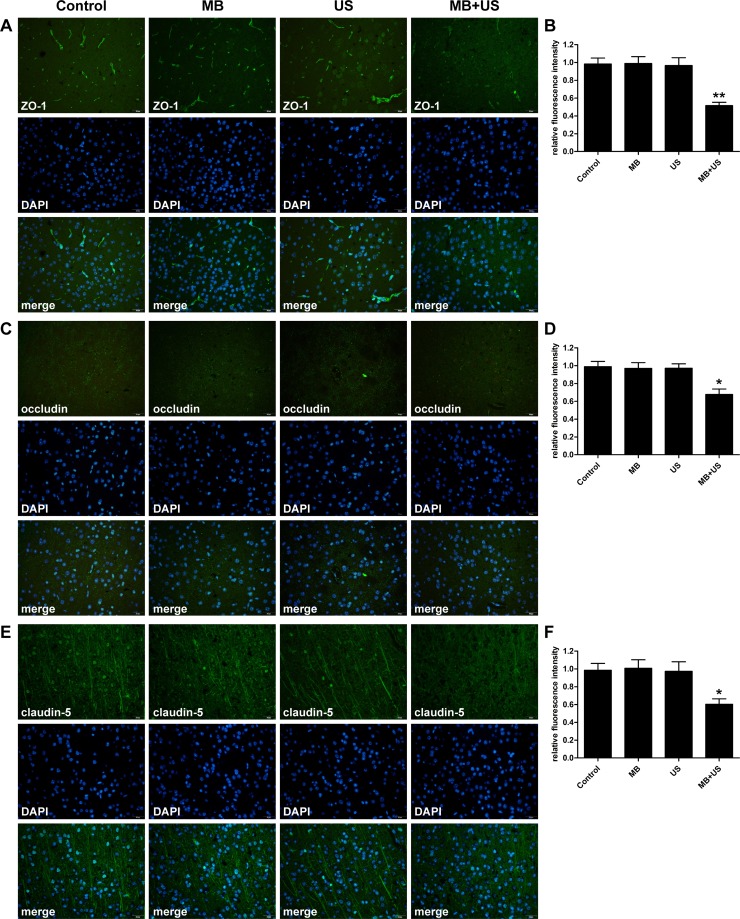
Results: The extent of BBB disruption increased with MB dose, MI and sonication duration. A relatively larger extent of BBB disruption associated with minimal tissue damage was achieved by an appropriate MB dose and ultrasound exposure parameters with diagnostic ultrasound. Decreased expression of ZO-1, occludin and claudin-5 were correlated with disruption of the BBB, as confirmed by paracellular passage of the tracer lanthanum nitrate into the brain parenchyma after BBB disruption.

Conclusions: These findings indicated that this technique is a promising tool for promoting brain delivery of diagnostic and therapeutic agents in the diagnosis and treatment of brain diseases.

Methods: The extent of BBB disruption was qualitatively assessed by Evans blue (EB) staining and quantitatively analyzed by an EB extravasation measurement. A histological examination was performed to evaluate tissue damage. Expression of tight junction (TJ) related proteins ZO-1, occludin and claudin-5 was determined by western blotting analysis and immunohistofluorescence. Transmission electron microscopy was performed to observe ultrastructure changes of TJs after BBB disruption.

Keywords: blood-brain barrier; diagnostic ultrasound; drug delivery; microbubble.


Conflict of interest statement

CONFLICTS OF INTEREST The authors declare no conflicts of interest.

Figures

Figure 1
Figure 1. Physical property of MBs
(A) Fluorescence image. (B) Bright field image of MBs. (C) Size distribution of MBs measured by a dynamic light-scattering system. Scale bar = 20 μm.
Figure 2
Figure 2
Distribution of EB extravasation in the surface view (A) and coronal sections (B) of mice brains after treatment of different MB doses at a fixed MI and sonication duration. Relationship between EB extravasation and MB doses in the cortex (C) and striatum (D) of mice at a fixed MI and sonication duration. Data were presented as the mean ± SEM, n = 4. ** and ##P < 0.01. Control, without sonication or MB injections; US, only sonication and without MB injections.
Figure 3
Figure 3. Representative coronal hematoxylin and eosin (H&E) stained sections of the cortex and striatum obtained at different MB doses
(A, B) H&E stained sections of the cortex and striatum of control group. (C, D) H&E stained sections of the cortex and striatum of US group. (E, F) H&E stained sections of the cortex and striatum of 0.5 × 10⁷ MBs group. (G, H) H&E stained sections of the cortex and striatum of 1.0 × 10⁷ MBs group. (I, J) H&E stained sections of the cortex and striatum of 2.0 × 10⁷ MBs group. (K, L) H&E stained sections of the cortex and striatum of 3.0 × 10⁷ MBs group. Control, without sonication or MB injections; US, only sonication and without MB injections. Scale bar = 50 μm.
Figure 4
Figure 4
Distribution of EB extravasation in the surface view (A) and coronal sections (B) of mice brains sonicated with different MIs at a fixed MB dose and sonication duration. Relationship between EB extravasation and MI in the cortex (C) and striatum (D) of mice at a fixed MB dose and sonication duration. Data were presented as the mean ± SEM, n = 4. ** and ##P < 0.01. Control, without sonication or MB injections; MB, only MB injections and without sonication.
Figure 5
Figure 5. Representative coronal hematoxylin and eosin (H&E) stained sections of the cortex and striatum obtained at different MIs
(A, B) H&E stained sections of the cortex and striatum of control group. (C, D) H&E stained sections of the cortex and striatum of US group. (E, F) H&E stained sections of the cortex and striatum of MI 0.2 group. (G, H) H&E stained sections of the cortex and striatum of MI 0.4 group. (I, J) H&E stained sections of the cortex and striatum of MI 0.6 group. (K, L) H&E stained sections of the cortex and striatum of MI 0.8 group. Control, without sonication or MB injections; MB, only MB injections and without sonication. Scale bar = 50 μm.
Figure 6
Figure 6
Distribution of EB extravasation in the surface view (A) and coronal sections (B) of mice brains sonicated with different sonication durations at a fixed MB dose and MI. Relationship between EB extravasation and sonication duration in the cortex (C) and striatum (D) of mice at a fixed MB dose and MI. Data were presented as the mean ± SEM, n = 4. ** and ##P < 0.01. Control, without sonication or MB injections; MB, only MB injections and without sonication.
Figure 7
Figure 7. Representative coronal hematoxylin and eosin (H&E) stained sections of the cortex and striatum of mice obtained at different sonication durations
(A, B) H&E stained sections of the cortex and striatum of control group. (C, D) H&E stained sections of the cortex and striatum of US group. (E, F) H&E stained sections of the cortex and striatum of 1 min group. (G, H) H&E stained sections of the cortex and striatum of 2 min group. (I, J) H&E stained sections of the cortex and striatum of 3 min group. (K, L) H&E stained sections of the cortex and striatum of 4 min group. Control, without sonication or MB injections; MB, only MB injections and without sonication. Scale bar = 50 μm.
Figure 8
Figure 8
EB extravasation in the cortex (A) and striatum (B) of mice at each time point after sonication (0 h, 0.5 h, 1 h, 2 h, 4 h, 6 h and 24 h). Data were presented as the mean ± SEM, n = 4. ** and ##P < 0.01. Control, without sonication or MB injections.
Figure 9
Figure 9
Representative blots (A) and relative quantitative analysis (B, C, D) of TJ related proteins ZO-1, occludin and claudin-5 expression in each group. Data were shown as the mean ± SEM, *P < 0.05, **P < 0.01 vs. control group, MBs only group and ultrasound only group. Control, without sonication or MB injections; MB, only MB injections and without sonication; US, only sonication and without MB injections.
Figure 10
Figure 10
Distribution and expression level of TJ related proteins ZO-1 (A), occludin (C) and claudin-5 (E) observed via immunohistofluorescence staining in each group. Relative fluorescence intensity of ZO-1 (B), occludin (D) and claudin-5 (F) compare with the control group. Data were shown as the mean ± SEM, *P < 0.05, **P < 0.01 vs. control group. Control, without sonication or MB injections; MB, only MB injections and without sonication; US, only sonication and without MB injections. Scale bar = 20 μm.
Figure 11
Figure 11. Transmission electrical microscopic observation of ultrastructure changes of TJs after BBB disruption
(A) The control group. The tracer could only be seen on the luminal surface of endothelial cells (ECs), and ECs and basement membranes were free of lanthanum nitrate. (BD) The group treated with MBs combined with ultrasound. The tracer passed through the entire interendothelial clefts (B, long arrow), deposited on the basement membrane (B), and penetrated deeply into the interstitial space of the surrounding neuropil (C, D, short arrow). Control, without sonication or MB injections. L, lumen; B, basement membrane; long arrow, tight junction; short arrow, lanthanum nitrate. Scale bar = 500 nm.
Figure 12
Figure 12. Schematic representation of BBB disruption induced by diagnostic ultrasound in combination with intravenous MB injections
IV, intravenous.

References

    1. Lin C, Hsieh H, Chen C, Wu S, Tsai C, Huang C, Hua M, Wei K, Yeh C, Liu H. Non-invasive, neuron-specific gene therapy by focused ultrasound-induced blood-brain barrier opening in Parkinson's disease mouse model. J Control Release. 2016;235:72–81. - PubMed
    1. Prados MD, Byron SA, Tran NL, Phillips JJ, Molinaro AM, Ligon KL, Wen PY, Kuhn JG, Mellinghoff IK, de Groot JF, Colman H, Cloughesy TF, Chang SM, et al. Toward precision medicine in glioblastoma: the promise and the challenges. Neuro-Oncology. 2015;17:1051–1063. - PMC - PubMed
    1. Pardridge WM. Blood–brain barrier delivery. Drug Discov Today. 2007;12:54–61. - PubMed
    1. Daneman R, Prat A. The Blood–Brain Barrier. Cold Spring Harb Perspect Biol. 2015;7:a20412. - PMC - PubMed
    1. Sheikov N, McDannold N, Sharma S, Hynynen K. Effect of focused ultrasound applied with an ultrasound contrast agent on the tight junctional integrity of the brain microvascular endothelium. Ultrasound Med Biol. 2008;34:1093–1104. - PMC - PubMed