

Ecological drivers of song evolution in birds: Disentangling the effects of habitat and morphology
- PMID: 29435262
- PMCID: PMC5792612
- DOI: 10.1002/ece3.3760
Ecological drivers of song evolution in birds: Disentangling the effects of habitat and morphology
Abstract
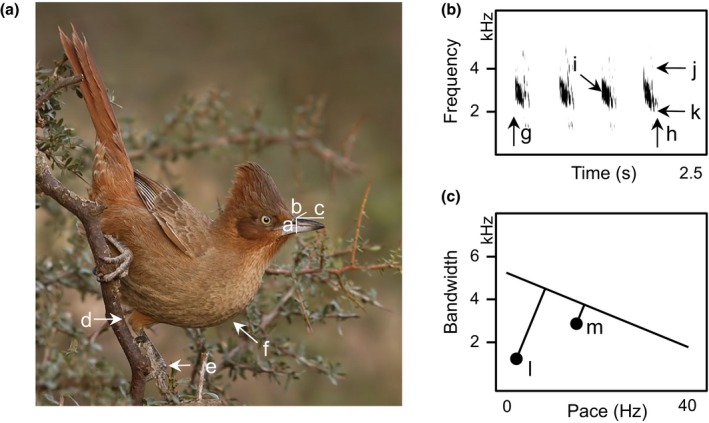
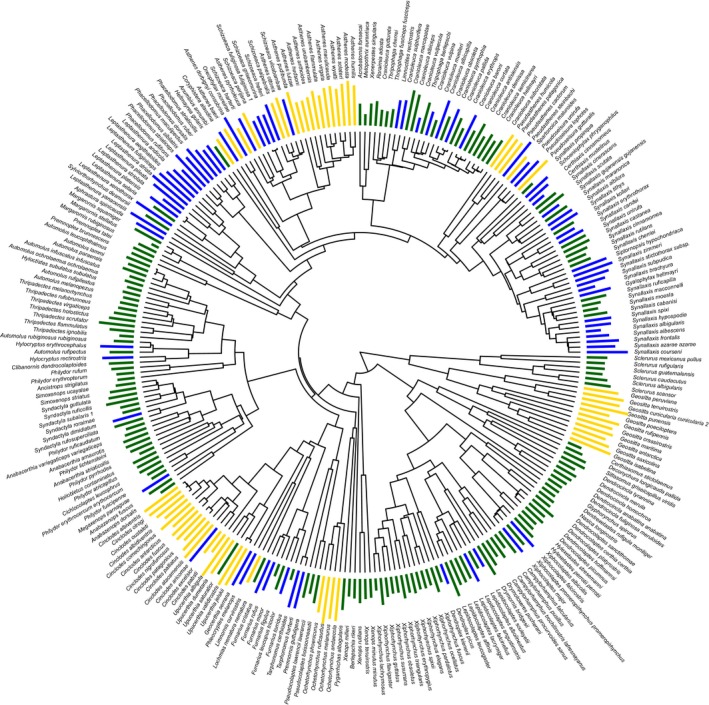
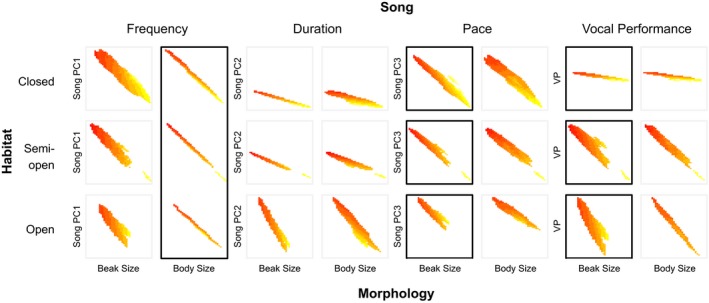
Environmental differences influence the evolutionary divergence of mating signals through selection acting either directly on signal transmission ("sensory drive") or because morphological adaptation to different foraging niches causes divergence in "magic traits" associated with signal production, thus indirectly driving signal evolution. Sensory drive and magic traits both contribute to variation in signal structure, yet we have limited understanding of the relative role of these direct and indirect processes during signal evolution. Using phylogenetic analyses across 276 species of ovenbirds (Aves: Furnariidae), we compared the extent to which song evolution was related to the direct influence of habitat characteristics and the indirect effect of body size and beak size, two potential magic traits in birds. We find that indirect ecological selection, via diversification in putative magic traits, explains variation in temporal, spectral, and performance features of song. Body size influences song frequency, whereas beak size limits temporal and performance components of song. In comparison, direct ecological selection has weaker and more limited effects on song structure. Our results illustrate the importance of considering multiple deterministic processes in the evolution of mating signals.
Keywords: Furnariidae; acoustic adaptation; biomechanical constraints; bird song; speciation; stochasticity; trade‐offs.
Figures
References
-
- Akaike, H. (1973). Information theory and an extension of the maximum likelihood principle In Petrov B. N., & Csáki F. (Eds.), Second international symposium on information theory: Tsahkadsor, Armenia, USSR (pp. 267–281). Budapest, Hungary: Akadémiai Kiadó.
-
- Anderson, D. R. , & Burnham, K. P. (2002). Avoiding pitfalls when using information‐theoretic methods. Journal of Wildlife Management, 66, 912–918. https://doi.org/10.2307/3803155 - DOI
-
- Andersson, M. (1994). Sexual selection. Princeton, NJ: Princeton University Press.
-
- Arnold, T. W. (2010). Uninformative parameters and model selection using Akaike's Information Criterion. Journal of Wildlife Management, 74, 1175–1178. https://doi.org/10.1111/j.1937-2817.2010.tb01236.x - DOI
-
- Badyaev, A. V. , Young, R. L. , Oh, K. P. , & Addison, C. (2008). Evolution on a local scale: Developmental, functional, and genetic bases of divergence in bill form and associated changes in song structure between adjacent habitats. Evolution, 62, 1951–1964. https://doi.org/10.1111/j.1558-5646.2008.00428.x - DOI - PubMed
LinkOut - more resources
Full Text Sources
Other Literature Sources
