Review
. 2017 Dec 7;7(2):118-130.
doi: 10.1002/open.201700159. eCollection 2018 Feb.

Wearable Chemosensors: A Review of Recent Progress

Affiliations
Review

Wearable Chemosensors: A Review of Recent Progress

Ruo-Can Qian et al. ChemistryOpen. .

Abstract

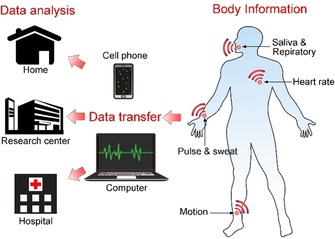
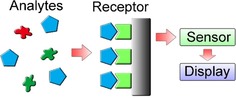
In recent years, there has been growing demand for wearable chemosensors for their important potential applications in mobile and electronic healthcare, patient self-assessment, human motion monitoring, and so on. Innovations in wearable chemosensors are revolutionizing the modern lifestyle, especially the involvement of both doctors and patients in the modern healthcare system. The facile interaction of wearable chemosensors with the human body makes them favorable and convenient tools for the detection and long-term monitoring of the chemical, biological, and physical status of the human body at a low cost with high performance. In this Minireview, we give a brief overview of the recent advances and developments in the field of wearable chemosensors, summarize the basic types of wearable chemosensors, and discuss their main functions and fabrication methods. At the end of this paper, the future development direction of wearable chemosensors is prospected. With continued interest and attention to this field, new exciting progress is expected in the development of innovative wearable chemosensors.

Keywords: analytical methods; biosensors; electronic healthcare; sensors; wearable chemosensors.


Figures

Figure 1
Figure 1
Acquisition of body information with wearable chemosensors. Health‐related body information is obtained by wireless wearable chemosensors and is converted into readable data by a mobile phone or a computer for further analysis.
Figure 2
Figure 2
Schematic illustration of a chemosensor.
Figure 3
Figure 3
Illustration of a flexible wireless electronic sensor with a fully functional microcontroller developed by Interuniversity Microelectronics Centre (Courtesy of IMEC, the Netherlands). Reproduced from Ref. 2 with permission of the BioMed Central.
Figure 4
Figure 4
Schematic drawing of different prestretched structures and analysis of the relevant strain distribution by a full 3D finite element modeling (FEM) analysis method. a) Wrinkled structure, b) suspending structure, and c) tripod PDMS bending structure. Reproduced from Ref. 31 with permission of Wiley‐VCH.
Figure 5
Figure 5
Steps involved in screen printing electrochemical sensors and biosensors on textile substrates. Reproduced from Ref. 37 with permission of Wiley‐VCH.
Figure 6
Figure 6
a) Fabric electrode array. b) Flexible printed circuit board (PCB) array from Fatronik–Tecnalia. c) Monitoring system for a fabric electrode array (FEA) based on hand movements. Reproduced from Ref. 39 with permission of Elsevier.
Figure 7
Figure 7
a) Electrode array, multiplexor hardware, and stimulator. b) Electrode array, data glove, and electrogoniometer. Reproduced from Ref. 40 with permission of Elsevier.
Figure 8
Figure 8
Schematic depiction of the creation of a multilayer material through drop‐on‐demand printing. Individual ink drops coalesce to form wet layers. Solvent from the wet layer evaporates to form dry layers. These dry layers may serve as substrates for deposition of the next material. After all layers are deposited, postprinting treatment may be used to remove residual solvent or additives or to cross‐link polymers. Reproduced from Ref. 41 with permission of Wiley‐VCH.
Figure 9
Figure 9
Schematic of the aerosol jet deposition process. In the atomizer, the carrier gas (here depicted as N2) flows rapidly above a nozzle immersed in the ink reservoir. The rapidly flowing gas creates a region of low pressure that results in the formation of aerosol droplets. Small droplets are entrained in the carrier gas, whereas larger droplets return to the ink reservoir. As the stream of entrained droplets progresses toward the nozzle, it is concentrated through the removal of excess carrier gas. In the nozzle, a flowing sheath gas (here depicted as N2) focuses the concentrated aerosol. Reproduced from Ref. 41 with permission of Wiley‐VCH.
Figure 10
Figure 10
Electromigration‐induced radially symmetric flow. a) Schematic illustration of the experimental setup for passing an electric current through a thin Cr film deposited on a substrate. b) An optical image showing formation of a typical electromigration ring around the cathode probe (solid black parts are needle probes). The ring is created on a 20 nm Cr film deposited on a SiO2‐Si substrate. Reproduced from Ref. 48 with permission of Nature Publication Group.
Figure 11
Figure 11
Important steps in the standard electrolithography process. a) Electromigration‐driven metal etching by a traversing probe. As the negatively biased tip moves, the Cr compound formed below the cathode melts and flows away from the path, which creates a groove along the path traversed. The dashed arrow shows the direction in which the tip is traversed. b) Process flow of the standard electrolithography technique. The process starts with a substrate spin coated with a polymer followed by deposition of a Cr thin‐film top layer. 1) In the first step, the top Cr layer is etched in the desired pattern by using electromigration. 2) Next, the polymer is etched in the patterned region by dipping it in an appropriate solvent. The inset shows the zoomed view of the trench made in the polymer. 3) Subsequently, the desired material is deposited. 4) Lift off is used to transfer the final pattern onto the desired material. Reproduced from Ref. 48 with permission of Nature Publication Group.
Figure 12
Figure 12
Schematic illustration of scanning‐probe‐based lithography.
Figure 13
Figure 13
Different kinds of textile/fabric manufacturing. a) Embroidery, b) sewing, c) weaving, d) nonwoven, e) knitting, f) spinning, g) braiding, h) coating/laminating, i) printing, and j) chemical treatment. Reproduced from Ref. 55 with permission of MDPI.
Figure 14
Figure 14
Flexible glove biosensor: fabrication, design, and performance. a) Image of the serpentine stencil design employed for printing the glove‐based stretchable device. b) Schematic of (left) the biosensing scan finger (index finger) containing a smiling face shape carbon‐based counter (CE), working electrode (WE), and Ag/AgCl‐based reference electrode (RE), and (right) collecting thumb with its printed carbon pad; scale bar: 10 mm. c) Photographs of the biosensing index finger under 0 % (left) and 50 % (right) linear stretch; scale bar: 10 mm. d) On‐glove swiping protocol for sampling chemical threat residues from tomato and stainless‐steel surfaces. e) On‐glove sensing procedure by joining the index finger (scan) and thumb (collector) to complete the electrochemical cell. f, g) Photographs of the wearable glove biosensor consisting of a sensing finger containing the immobilized organophosphorus hydrolase (OPH) enzyme layer and the collector/sampling finger. The electrodes are connected by an adjustable ring bandage to the portable potentiostat (attached to the back of the hand) for on‐site detection with wireless communication to a smart phone for rapid presentation of the voltammetric results. The inset shows a schematic of the interface between potentiostat and glove sensor. The connections consist of a Velcro fabric (iii) containing the aluminum‐tape based pins (ii) that are adjusted as a ring with the glove sensing connectors and the wiring (i) with the potentiostat. Reproduced from Ref. 56 with permission of the American Chemical Society.
Figure 15
Figure 15
Fabrication of printable tattoo‐based electrochemical devices. Reproduced from Ref. 60 with permission of Wiley.
Figure 16
Figure 16
Photographs showing standard steps of a) removing the transparent protective sheet and b) gently sliding the tattoo‐based paper after dabbing it with water to apply a tattoo device to human skin. Images showing extent of mechanical stress experienced by a tattoo applied to a human subject during c) stretching and d) twisting of the underlying skin. Reproduced from Ref. 60 with permission of Royal Society of Chemistry.
Figure 17
Figure 17
Fabrication process of a GET. a, b) Graphene is grown on copper foil by using atmospheric pressure chemical vapor deposition (CVD). c) A layer of poly(methyl methacrylate) (PMMA) less than 500 nm thick is spin coated on graphene. d) Copper is etched away. e) Graphene/PMMA (Gr/PMMA) is transferred onto tattoo paper with PMMA touching the paper and graphene facing up. f) Gr/PMMA is cut by a mechanical cutter plotter. g) Extraneous Gr/PMMA is peeled off from the tattoo paper. h) Mounting GET on skin like a temporary transfer tattoo. i) GET on skin. Reproduced from Ref. 61 with permission of the American Chemical Society.
Figure 18
Figure 18
Potentiometric sensor. a) A potentiometric sensor measures the potential between the reference and test solutions. b) The geometry of the salt bridge controls equilibration between the reference and test solutions. c) Schematic illustration of a sensor for parametric studies. d) Sensor for parametric studies. Reproduced from Ref. 66 with permission of the American Chemical Society.
Figure 19
Figure 19
Chloride sensor for on‐body sweat tests. a) Photograph of a sensor. b) Schematic illustration of the sensor with an optimized salt bridge. c) Representative calibration curve (N=13). d) Representative dose–response curve. Reproduced from Ref. 66 with permission of the American Chemical Society.
Figure 20
Figure 20
Images and schematic illustration of the FISA for multiplexed perspiration analysis. a) Photograph of a wearable FISA on a subject's wrist, integrating the multiplexed sweat sensor array and the wireless FPCB. b) Photograph of a flattened FISA. The red dashed box indicates the location of the sensor array, and the white dashed boxes indicate the locations of the integrated circuit components. c) Schematic of the sensor array for multiplexed perspiration analysis. GOx: glucose oxidase, LOx: lactate oxidase. d) System‐level block diagram of the FISA showing the signal transduction (orange) [with potential (V), current (I), and resistance (R) outputs], conditioning (green), processing (purple), and wireless transmission (blue) paths from sensors to the custom‐developed mobile application (numbers in parentheses indicate the corresponding labeled components in panel b). ADC, analogue‐to‐digital converter. The inset images show the home page (left) and real‐time data display page (right) of the mobile application. Reproduced from Ref. 67 with permission of Nature Publication Group.
Figure 21
Figure 21
Illustration of the wireless tattoo‐based resistive sensor for Staphylococcus aureus. Reproduced from Ref. 69 with permission of Nature Publication Group.
Figure 22
Figure 22
A flexible strip‐based glucose sensor and the method for applying the sensor for tear glucose measurements in the eye of a rabbit. Reproduced from Ref. 74 with permission of Springer.
Figure 23
Figure 23
Google smart lens for noninvasive blood‐glucose monitoring by detection of tear fluid. Reproduced from Ref. 78 with permission of Nature Publication Group.

References

    1. Pantelopoulos A., Bourbakis N. G., IEEE Trans. Sys. Man Cybernet. 2010, 40, 1–12.
    1. Patel S., Park H., Bonato P., Chan L., Rodgers M., J. NeuroEng. Rehabil. 2012, 9, 21. - PMC - PubMed
    1. Gatzoulis L., Iakovidis I., IEEE Eng. Med. Biol. Mag. 2007, 26, 51–56. - PubMed
    1. Bonato P., J. NeuroEng. Rehabil. 2005, 2, 2. - PMC - PubMed
    1. Bonato P., IEEE Eng. Med. Biol. Mag. 2003, 22, 18–20. - PubMed

LinkOut - more resources