

Cervical spinal cord atrophy: An early marker of progressive MS onset
- PMID: 29435472
- PMCID: PMC5795903
- DOI: 10.1212/NXI.0000000000000435
Cervical spinal cord atrophy: An early marker of progressive MS onset
Abstract
Objective: To assess whether cervical spinal cord atrophy heralds the onset of progressive MS.
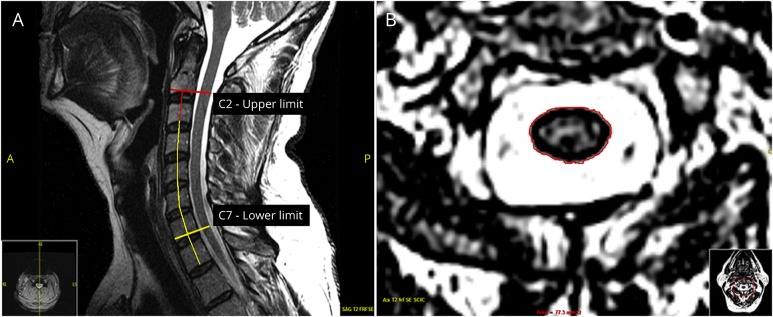
Methods: We studied 34 individuals with radiologically isolated syndrome (RIS) and 31 patients with relapsing-remitting MS (RRMS) age matched to 25 patients within a year of onset of secondary progressive MS (SPMS). Two raters independently measured (twice per rater) the cervical spinal cord average segmental area (CASA) (mm2) of axial T2-weighted images between C2 and C7 landmarks. The midsagittal T2-weighted image from the end of C2 to the end of C7 vertebra was used to measure the cervical spine (c-spine) length (mm). Sex, age at cervical MRI, number and location of cervical spinal cord lesions, c-spine length, and diagnoses were analyzed against the outcome measures of CASA and C2 and C7 slice segmental areas.
Results: Intrarater and interrater agreement was excellent (intraclass correlation coefficient >0.97). The CASA area (p = 0.03) and C7 area (p = 0.002) were smaller in SPMS compared with RRMS. The C2 area (p = 0.027), CASA (p = 0.004), and C7 area (p = 0.003) were smaller in SPMS compared with RIS. The C2 area did not differ between SPMS and RRMS (p = 0.09). The C2 area (p = 0.349), CASA (p = 0.136), and C7 area (p = 0.228) did not differ between RIS and MS (SPMS and RRMS combined). In the multivariable model, ≥2 cervical spinal cord lesions were associated with the C2 area (p = 0.008), CASA (p = 0.009), and C7 area independent of disease course (p = 0.017). Progressive disease course was associated with the C7 area independent of the cervical spinal cord lesion number (p = 0.004).
Conclusion: Cervical spinal cord atrophy is evident at the onset of progressive MS and seems partially independent of the number of cervical spinal cord lesions.
Classification of evidence: This study provides Class III evidence that MRI cervical spinal cord atrophy distinguishes patients at the onset of progressive MS from those with RIS and RRMS.
Figures
References
-
- Rocca MA, Horsfield MA, Sala S, et al. . A multicenter assessment of cervical cord atrophy among MS clinical phenotypes. Neurology 2011;76:2096–2102. - PubMed
-
- Daams M, Weiler F, Steenwijk MD, et al. . Mean upper cervical cord area (MUCCA) measurement in long-standing multiple sclerosis: relation to brain findings and clinical disability. Mult Scler 2014;20:1860–1865. - PubMed
-
- Biberacher V, Boucard CC, Schmidt P, et al. . Atrophy and structural variability of the upper cervical cord in early multiple sclerosis. Mult Scler 2015;21:875–884. - PubMed
-
- Lukas C, Sombekke MH, Bellenberg B, et al. . Relevance of spinal cord abnormalities to clinical disability in multiple sclerosis: MR imaging findings in a large cohort of patients. Radiology 2013;269:542–552. - PubMed
Grants and funding
LinkOut - more resources
Full Text Sources
Other Literature Sources
Research Materials
Miscellaneous