

Tracking random walks
- PMID: 29436509
- PMCID: PMC5832728
- DOI: 10.1098/rsif.2017.0776
Tracking random walks
Abstract
In empirical studies, trajectories of animals or individuals are sampled in space and time. Yet, it is unclear how sampling procedures bias the recorded data. Here, we consider the important case of movements that consist of alternating rests and moves of random durations and study how the estimate of their statistical properties is affected by the way we measure them. We first discuss the ideal case of a constant sampling interval and short-tailed distributions of rest and move durations, and provide an exact analytical calculation of the fraction of correctly sampled trajectories. Further insights are obtained with simulations using more realistic long-tailed rest duration distributions showing that this fraction is dramatically reduced for real cases. We test our results for real human mobility with high-resolution GPS trajectories, where a constant sampling interval allows one to recover at best 18% of the movements, while over-evaluating the average trip length by a factor of 2. Using a sampling interval extracted from real communication data, we recover only 11% of the moves, a value that cannot be increased above 16% even with ideal algorithms. These figures call for a more cautious use of data in quantitative studies of individuals' movements.
Keywords: animal movement; human mobility; renewal theory; statistical physics.
© 2018 The Author(s).
Conflict of interest statement
We declare we have no competing interests.
Figures

 , Δmax = 12 h). See electronic supplementary material, figure S1 for a two-dimensional example. (Online version in colour.)
 fixing
  and
and  = 1 h. The distribution has a maximum when the average rest times exceed the sampling time, and its value is strictly zero for ℓ* > v
 . (b) Dependence of equation (2.6) on
  fixing
  ,
,  . Short sampling times introduce a cut-off in the distribution. Large deviations can be observed when sampling time intervals are long. (Online version in colour.)
 (filled circle), while is overestimated by ≈ 10% for
  (up triangle). The second moment (k = 2) has a deviation of about 10% for both optimal sampling times (empty circle and down triangle). In the inset, we show the ratio of the estimated number of trips n* over the actual number of trips n. With
  (circle), we correctly evaluate the number of moves, while
  (triangle) yields a slightly underestimated value n* ≈ 0.90n. (b) The fraction of good moves follows the curve predicted by equation (2.10) (blue line). The maximum value of 51% is reached for
  (triangle), but at
  (circle) the value is only 1% lower. We choose here
  ,
,  . (Online version in colour.)
 for exponential distributions. We observe that
  in the limit for small
  , and decreases as
  becomes comparable to
  . The upper bound to sampling quality is 51% for the car mobility conditions of figure 3 (orange solid triangle) and 29% for GeoLife trajectories of figure 5 (yellow empty triangle). (b) The sampling rate
  optimizing Fgood has a non-trivial dependence on
  and
and  . We identify a relatively weak dependence on
  , of the form
  , with α ranging between 1.84 and 2 for all values of
  . In particular, for the characteristic values observed for car mobility (orange solid triangle,
  ,
,  ), the curve exhibits a plateau, allowing us to approximate
  . For the GeoLife trajectories (yellow empty triangle), which have significantly shorter rest times (
 h,
h,  ) the deviation from this approximation is only of about 1.5%. (Online version in colour.)
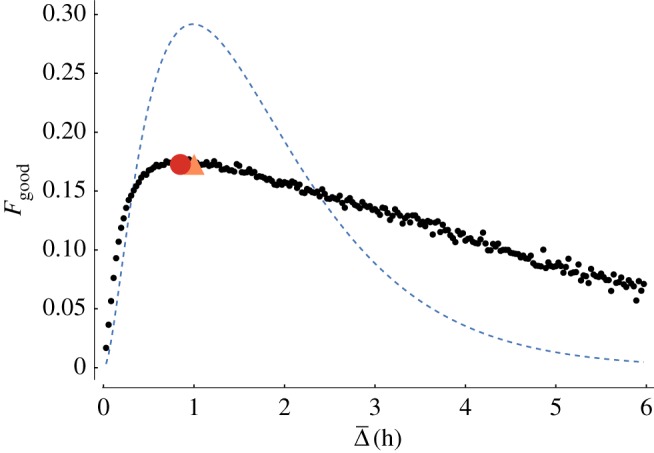
 . The dashed blue line corresponds to the theoretical curve computed for exponential distributions. The red circle corresponds to
  , while orange triangles correspond to the empirical maximum
  h of Fgood. Strikingly, the latter coincides with the theoretical value of
  for exponential distributions. (Online version in colour.)
References
-
- Vespignani A. 2012. Modelling dynamical processes in complex socio-technical systems. Nat. Phys. 8, 32–39. (10.1038/nphys2160) - DOI
-
- Zheng Y. 2015. Trajectory data mining: an overview. ACM. Trans. Intell. Syst. Technol. 6, 29–41.
-
- Song C, Koren T, Wang P, Barabási A-L. 2010. Modelling the scaling properties of human mobility. Nat. Phys. 6, 818–823. (10.1038/nphys1760) - DOI
Publication types
MeSH terms
LinkOut - more resources
Full Text Sources
Other Literature Sources
Miscellaneous