. 2018 May;41(5):2678-2686.
doi: 10.3892/ijmm.2018.3481. Epub 2018 Feb 12.

Iron limitation promotes the atrophy of skeletal myocytes, whereas iron supplementation prevents this process in the hypoxic conditions

Affiliations

Iron limitation promotes the atrophy of skeletal myocytes, whereas iron supplementation prevents this process in the hypoxic conditions

Kamil Kobak et al. Int J Mol Med. 2018 May.

Abstract

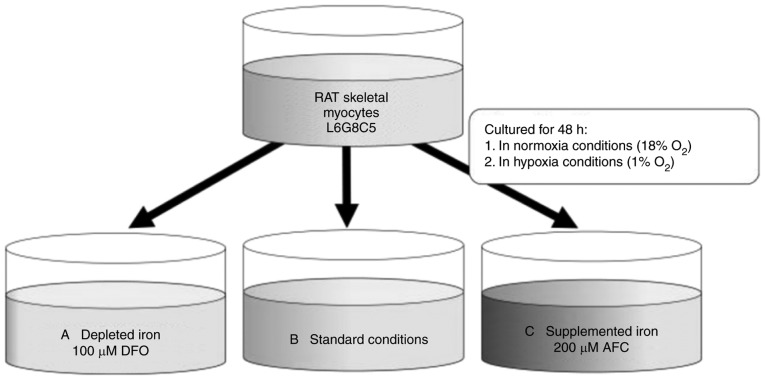
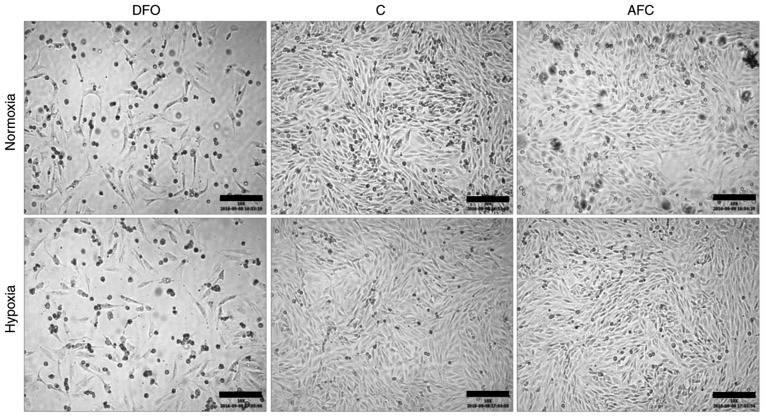
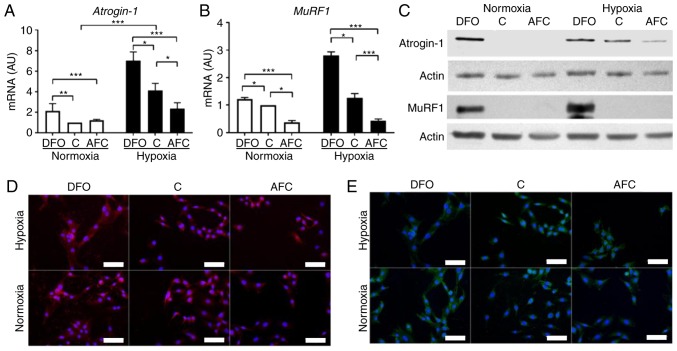
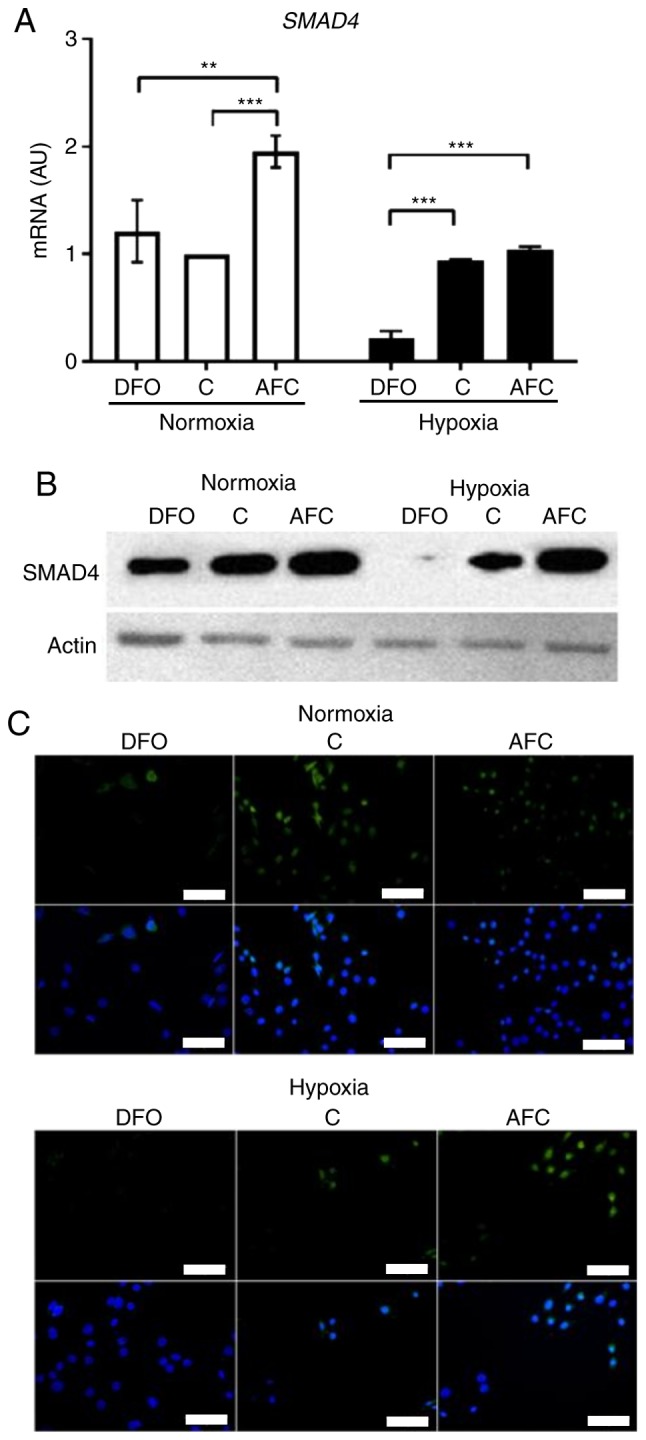
There is clinical evidence that patients with heart failure and concomitant iron deficiency have increased skeletal muscle fatigability and impaired exercise tolerance. It was expected that a skeletal muscle cell line subjected to different degrees of iron availability and/or concomitant hypoxia would demonstrate changes in cell morphology and in the expression of atrophy markers. L6G8C5 rat skeletal myocytes were cultured in normoxia or hypoxia at optimal, reduced or increased iron concentrations. Experiments were performed to evaluate the iron content in cells, cell morphology, and the expression of muscle specific atrophy markers [Atrogin1 and muscle‑specific RING‑finger 1 (MuRF1)], a gene associated with the atrophy/hypertrophy balance [mothers against decapentaplegic homolog 4 (SMAD4)] and a muscle class‑III intermediate filament protein (Desmin) at the mRNA and protein level. Hypoxic treatment caused, as compared to normoxic conditions, an increase in the expression of Atrogin‑1 (P<0.001). Iron‑deficient cells exhibited morphological abnormalities and demonstrated a significant increase in the expression of Atrogin‑1 (P<0.05) and MuRF1 (P<0.05) both in normoxia and hypoxia, which indicated activation of the ubiquitin proteasome pathway associated with protein degradation during muscle atrophy. Depleted iron in cell culture combined with hypoxia also induced a decrease in SMAD4 expression (P<0.001) suggesting modifications leading to atrophy. In contrast, cells cultured in a medium enriched with iron during hypoxia exhibited inverse changes in the expression of atrophy markers (both P<0.05). Desmin was upregulated in cells subjected to both iron depletion and iron excess in normoxia and hypoxia (all P<0.05), but the greatest augmentation of mRNA expression occurred when iron depletion was combined with hypoxia. Notably, in hypoxia, an increased expression of Atrogin‑1 and MuRF1 was associated with an increased expression of transferrin receptor 1, reflecting intracellular iron demand (R=0.76, P<0.01; R=0.86, P<0.01). Hypoxia and iron deficiency when combined exhibited the most detrimental impact on skeletal myocytes, especially in the context of muscle atrophy markers. Conversely, iron supplementation in in vitro conditions acted in a protective manner on these cells.


Conflict of interest statement

Competing interests

Wrocław Medical University received an unrestricted grant from Vifor Pharma outside the submitted work. Monika Kasztura reports financial support from Vifor Pharma for travel and accommodation for scientific meeting. Waldemar Banasiak reports personal fees from Vifor Pharma, outside the submitted work. Piotr Ponikowski reports personal fees from Vifor Pharma and personal fees from AMGEN, outside the submitted work. Ewa A. Jankowska reports personal fees from Vifor Pharma and FRESENIUS, outside the submitted work.

Figures

Figure 1
Figure 1
Different oxygen availability conditions (normoxia and hypoxia) with L6G8C5 myocytes cell culture and iron concentration manipulations. The following conditions are presented: (A) Reduced iron concentration (iron chelation using 100 µM DFO); (B) optimal iron concentration (standard iron concentration in Dulbecco's modified Eagle's medium with 10% fetal bovine serum); and (C) increased iron concentration (iron supplementation with 200 µM AFC). DFO, deferroxamine; AFC, ammonium ferric citrate.
Figure 2
Figure 2
Bright field inverted microscope images of L6G8C5 cells in different iron availability conditions in normoxia and hypoxia. Scalebar length, 200 µm. DFO, reduced iron concentration via deferroxamine; C, control; AFC, increased iron concentration via ammonium ferric citrate.
Figure 3
Figure 3
Expression of atrophy markers in L6G8C5 cells with concomitant optimal, reduced or increased iron availability in normoxia and hypoxia. mRNA expression levels of (A) atrogin-1 and (B) MuRF1 in L6G8C5 cells. (C) Western blot analysis of respective proteins expression in the cell lysates. Representative images of immunocytochemical staining of (D) atrogin-1 and (E) MuRF1 in L6G8C5 cell lines (with DAPI as a nuclei maker). Scalebar length, 25 µm. Data are presented as the mean + standard deviation obtained from three separate experiments. *P<0.05; **P<0.01; ***P<0.001. AU, arbitrary units; MuRF1, muscle-specific RING-finger 1; DFO, reduced iron concentration via deferroxamine; C, control; AFC, increased iron concentration via ammonium ferric citrate.
Figure 4
Figure 4
Expression of SMAD4 in L6G8C5 cells with concomitant optimal, reduced or increased iron availability in normoxia and hypoxia. (A) mRNA expression levels of SMAD4 in L6G8C5 cells. (B) Western blot analysis of respective proteins expression in the cell lysates. (C) Representative images of immunocytochemical staining of SMAD4 and DAPI as a nuclei marker in L6G8C5 cell lines. Scalebar length, 25 µm. Data are presented as the mean + standard deviation obtained from three separate experiments. **P<0.01; ***P<0.001. AU, arbitrary units; DFO, reduced iron concentration via deferroxamine; C, control; AFC, increased iron concentration via ammonium ferric citrate; SMAD4, mothers against decapentaplegic homolog 4.
Figure 5
Figure 5
Expression of Desmin in L6 cells with concomitant optimal, reduced or increased iron availability in normoxia and hypoxia. (A) mRNA expression levels of Desmin in L6G8C5 cells. (B) Western blot analysis of respective proteins expression in the cell lysates. (C) Representative images of immunocytochemical staining of Desmin with DAPI as a nuclei marker in L6G8C5 cell lines. Scalebar length, 25 µm. *P<0.05; ***P<0.001. AU, arbitrary units; DFO, reduced iron concentration via deferroxamine; C, control; AFC, increased iron concentration via ammonium ferric citrate.

References

    1. Cohen S, Nathan JA, Goldberg AL. Muscle wasting in disease: Molecular mechanisms and promising therapies. Nat Rev Drug Discov. 2015;14:58–74. doi: 10.1038/nrd4467. - DOI - PubMed
    1. Jackman RW, Kandarian SC. The molecular basis of skeletal muscle atrophy. Am J Physiol Cell Physiol. 2004;287:C834–C843. doi: 10.1152/ajpcell.00579.2003. - DOI - PubMed
    1. Sillau AH, Banchero N. Effects of hypoxia on capillary density and fiber composition in rat skeletal muscle. Pflugers Arch. 1977;370:227–232. doi: 10.1007/BF00585531. - DOI - PubMed
    1. Zattara-Hartmann MC, Badier M, Guillot C, Tomei C, Jammes Y. Maximal force and endurance to fatigue of respiratory and skeletal muscles in chronic hypoxemic patients: The effects of oxygen breathing. Muscle Nerve. 1995;18:495–502. doi: 10.1002/mus.880180504. - DOI - PubMed
    1. Sanders KJ, Kneppers AE, van de Bool C, Langen RC, Schols AM. Cachexia in chronic obstructive pulmonary disease: New insights and therapeutic perspective. J Cachexia Sarcopenia Muscle. 2016;7:5–22. doi: 10.1002/jcsm.12062. - DOI - PMC - PubMed

MeSH terms