. 2018;13(3):240-250.
doi: 10.1080/15592294.2018.1435243. Epub 2018 Apr 2.

Breast cancer family history and allele-specific DNA methylation in the legacy girls study

Affiliations

Breast cancer family history and allele-specific DNA methylation in the legacy girls study

Hui-Chen Wu et al. Epigenetics. 2018.

Abstract

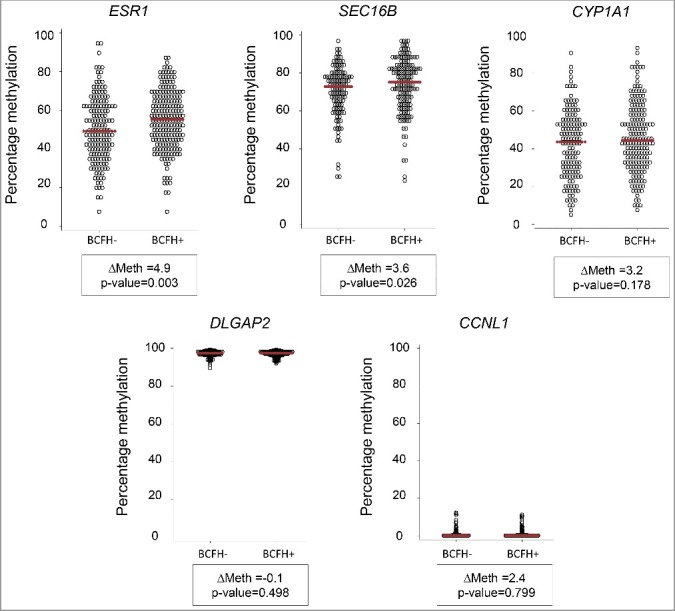
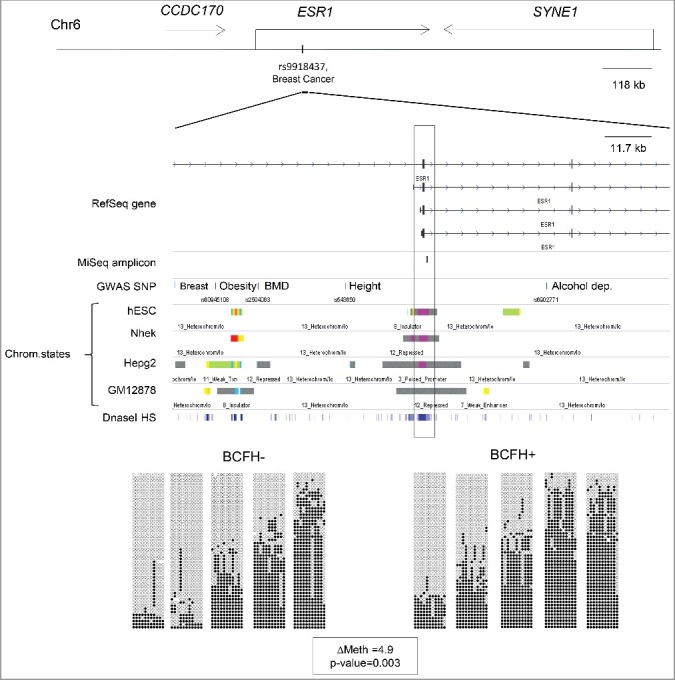
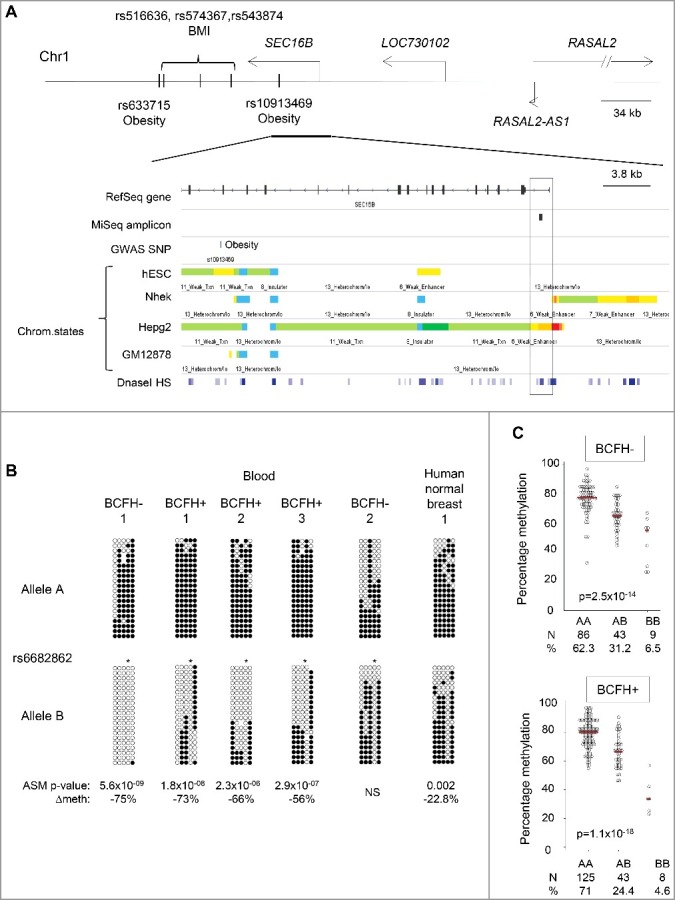
Family history, a well-established risk factor for breast cancer, can have both genetic and environmental contributions. Shared environment in families as well as epigenetic changes that also may be influenced by shared genetics and environment may also explain familial clustering of cancers. Epigenetic regulation, such as DNA methylation, can change the activity of a DNA segment without a change in the sequence; environmental exposures experienced across the life course can induce such changes. However, genetic-epigenetic interactions, detected as methylation quantitative trait loci (mQTLs; a.k.a. meQTLs) and haplotype-dependent allele-specific methylation (hap-ASM), can also contribute to inter-individual differences in DNA methylation patterns. To identify differentially methylated regions (DMRs) associated with breast cancer susceptibility, we examined differences in white blood cell DNA methylation in 29 candidate genes in 426 girls (ages 6-13 years) from the LEGACY Girls Study, 239 with and 187 without a breast cancer family history (BCFH). We measured methylation by targeted massively parallel bisulfite sequencing (bis-seq) and observed BCFH DMRs in two genes: ESR1 (Δ4.9%, P = 0.003) and SEC16B (Δ3.6%, P = 0.026), each of which has been previously implicated in breast cancer susceptibility and pubertal development. These DMRs showed high inter-individual variability in methylation, suggesting the presence of mQTLs/hap-ASM. Using single nucleotide polymorphisms data in the bis-seq amplicon, we found strong hap-ASM in SEC16B (with allele specific-differences ranging from 42% to 74%). These findings suggest that differential methylation in genes relevant to breast cancer susceptibility may be present early in life, and that inherited genetic factors underlie some of these epigenetic differences.

Keywords: Breast cancer family history; DNA methylation; mQTL; white blood cells, childhood and adolescent cohort.


Figures

Figure 1.
Figure 1.
Methylation differences between BCFH+ and BCFH- girls in ESR1, SEC16B, CYP1A1, DLGAP2, and CCNL1. Net CpG methylation values (percent) in BCFH- girls and BCFH+ girls in 5 gene regions examined in WBC DNA. The red line represents the median methylation. ESR1, SEC16B, and CYP1A1 showed high inter-individual variability of the methylation level, while the distribution of methylation levels of DLGAP2 and CCNL1 did not. For the CYP1A1, DLGAP2 and CCNL1, there is no difference between BCFH+ and BCFH- girls, while for ESR1 and SEC16B, there are small but statistically significant differences. Importantly, the range of methylation values for these loci is wide, suggesting the presence of hap-ASM, in which one local haplotype acts in cis and dictates a low methylation level while another haplotype dictates high methylation.
Figure 2.
Figure 2.
BCFH-DMR in an alternate promoter of ESR1. Map and bis-seq showing the BCFH-DMR in an alternate promoter of ESR1. Zoomed-in view of ESR1, showing relevant ENCODE tracks and the amplicons utilized for targeted bis-seq. The BCFH-DMR is located in a downstream ESR1 alternative promoter region and marked by poised chromatin marks. Graphical representation of bis-seq data for 10 examples of BCFH- girls (left) and BCFH+ girls (right) are shown. Each column represents a consecutive CpG covered by the amplicon, and each line a unique DNA fragment. White circles are unmethylated CpGs and black circles are methylated CpGs.
Figure 3.
Figure 3.
Hap-ASM BCFH-DMR and mQTLs in the promoter of SEC16B. Map and results of bis-seq showing the BCFH-DMR and hap-ASM in the promoter of SEC16B. (A) Map of SEC16B, showing relevant ENCODE tracks and the amplicons utilized for targeted bis-seq. (B) Bis-seq data showing hap-ASM in the SEC16B promoter region. Graphical representation of 5 representative whole-blood samples and 1 human normal breast tissue. Additional representations in breast tissues and T cells from peripheral blood are shown in the Supplemental figure 1. This region overlaps with the common SNP, rs6682862. Allele A and B are analyzed and represented separately. The SNP dictates methylation level with the alternate allele (allele B) being significantly hypomethylated compared to the reference allele (allele A), suggesting the presence of hap-ASM in 25 out of 32 heterozygous samples. The low methylated allele is significantly biased toward allele B (P = 3 × 10−08, using binomial test), which ruled out imprinting. For each heterozygous sample, Wilcoxon P value and methylation difference between alleles were calculated by bootstrapping (1,000 sampling of 50 reads per allele) and are indicated only for significant hap-ASM defined as difference in percentage methylation >20%, >3 ASM CpGs, and P < 0.05. One representative random sample of each allele (20 reads per allele) is shown. ∆Meth (difference in percentage of methylation between alleles in heterozygous samples) and Wilcoxon P values are from bootstrapping. * indicates the position of the index SNP which overlap with a CpG site, which is, therefore, always unmethylated on allele B. (C) CpG methylation values (percent) by genotypes in BCFH- girls (Up) and BCFH+ girls (Bottom). The red line represents the median methylation. Methylation and genotype significantly correlate in both groups supporting mQTL/hap-ASM. Girls with the AA genotype had the highest methylation levels, while girls with BB genotype had lowest methylation levels. The number of samples for each genotype and the distribution (%) is indicated below each graph.

References

    1. Cancer CGoHFiB Familial breast cancer: collaborative reanalysis of individual data from 52 epidemiological studies including 58 209 women with breast cancer and 101 986 women without the disease. The Lancet. 2001;358:1389–1399. doi:http://dx.doi.org/10.1016/S0140-6736(01)06524-2. - DOI - PubMed
    1. Stratton MR. Rahman N. The emerging landscape of breast cancer susceptibility. Nature Genet. 2008;40:17–22. doi: 10.1038/ng.2007.53. PMID:18163131. - DOI - PubMed
    1. Shiovitz S, Korde LA. Genetics of breast cancer: a topic in evolution. Ann Oncol. 2015;26:1291–1299. doi: 10.1093/annonc/mdv022. PMID:25605744 - DOI - PMC - PubMed
    1. Esteller M, Silva JM, Dominguez G, et al. Promoter hypermethylation and BRCA1 inactivation in sporadic breast and ovarian tumors. J Natl Cancer Inst. 2000;92:564–569. doi: 10.1093/jnci/92.7.564. PMID:10749912 - DOI - PubMed
    1. Rice JC, Ozcelik H, Maxeiner P, et al. Methylation of the BRCA1 promoter is associated with decreased BRCA1 mRNA levels in clinical breast cancer specimens. Carcinogenesis. 2000;21:1761–1765. doi: 10.1093/carcin/21.9.1761. PMID:10964110 - DOI - PubMed

Publication types