. 2018 Feb 7;10(427):eaan5372.
doi: 10.1126/scitranslmed.aan5372.

Targeting mitochondrial responses to intra-articular fracture to prevent posttraumatic osteoarthritis

Affiliations

Targeting mitochondrial responses to intra-articular fracture to prevent posttraumatic osteoarthritis

Mitchell C Coleman et al. Sci Transl Med. .

Abstract

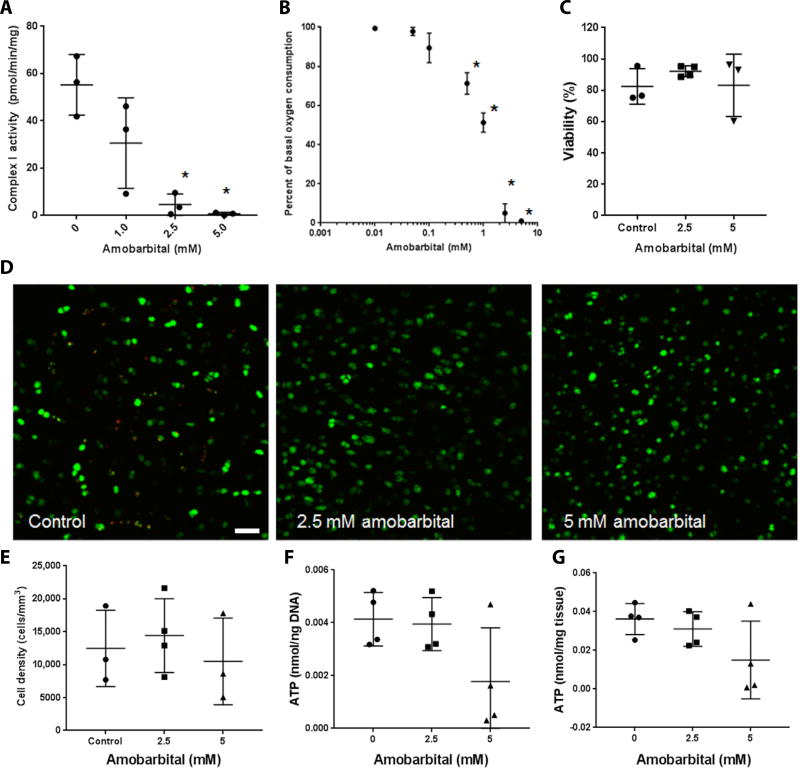
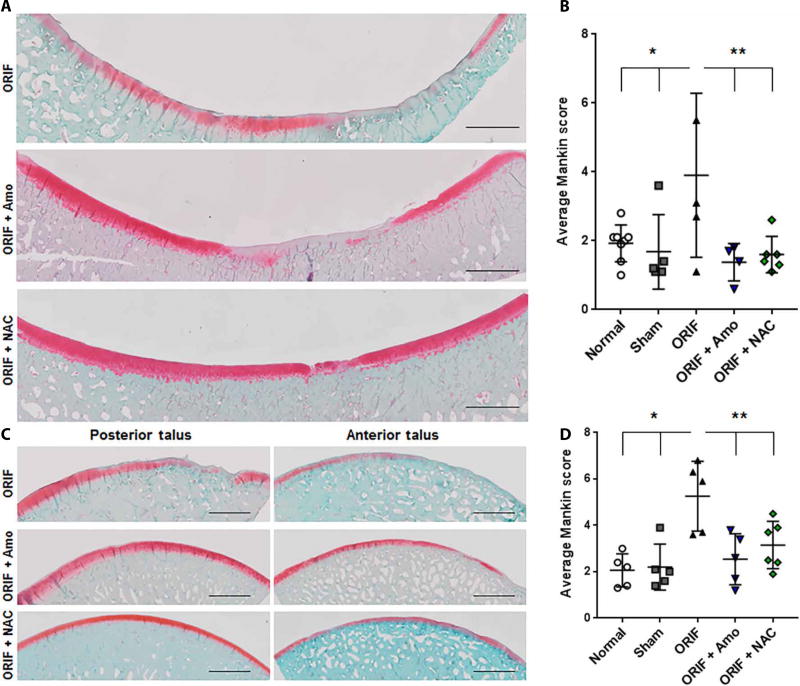
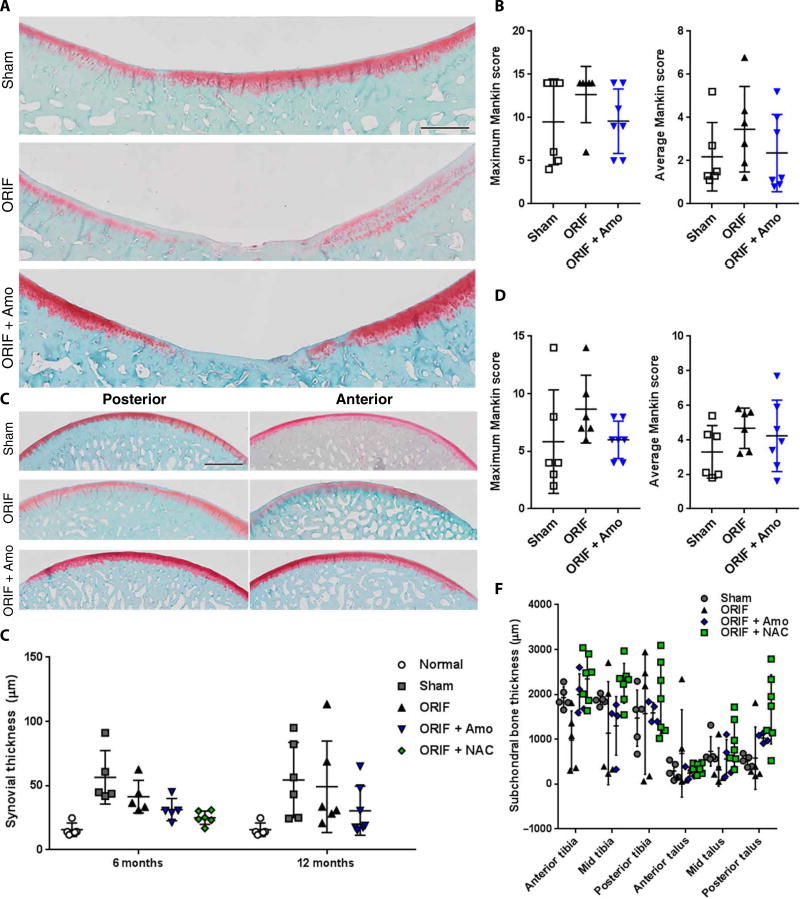
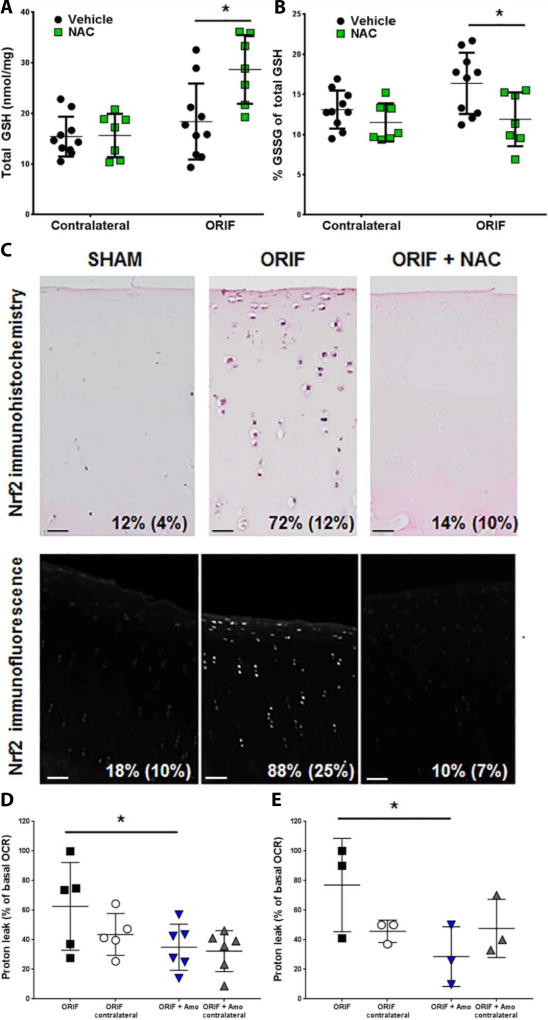
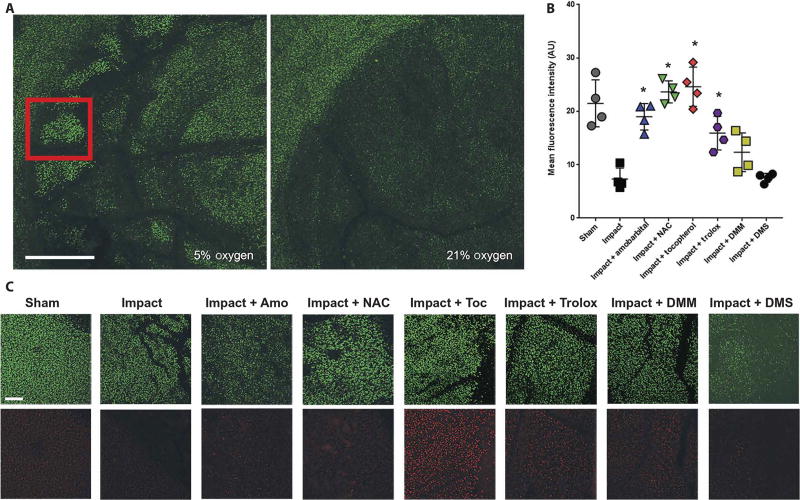
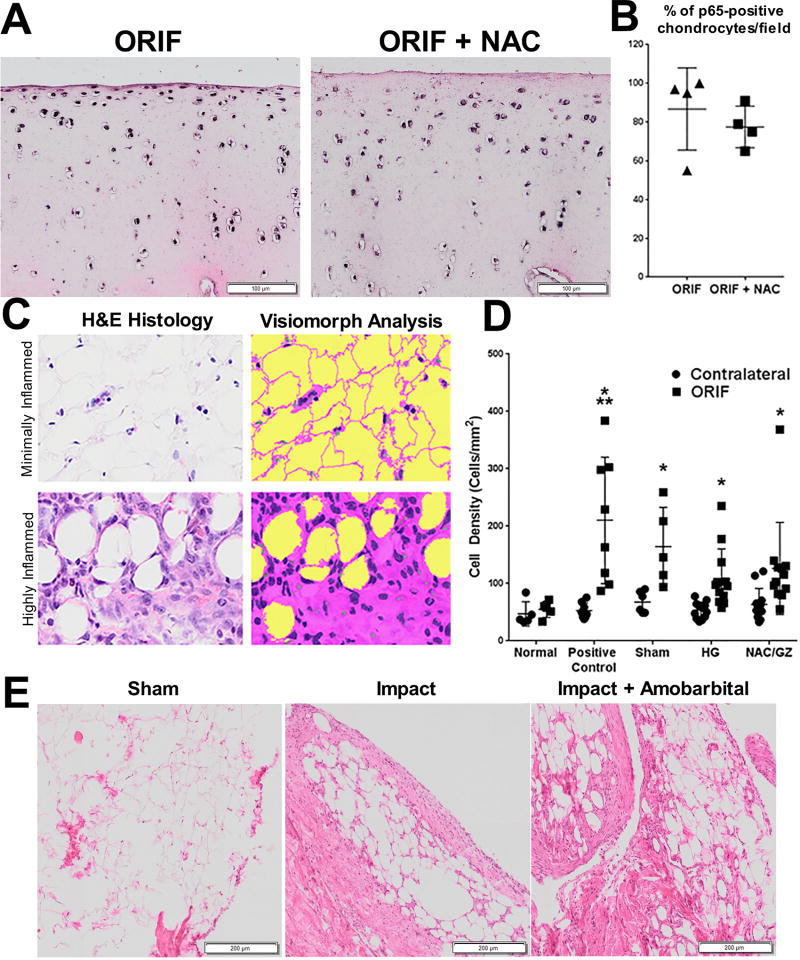
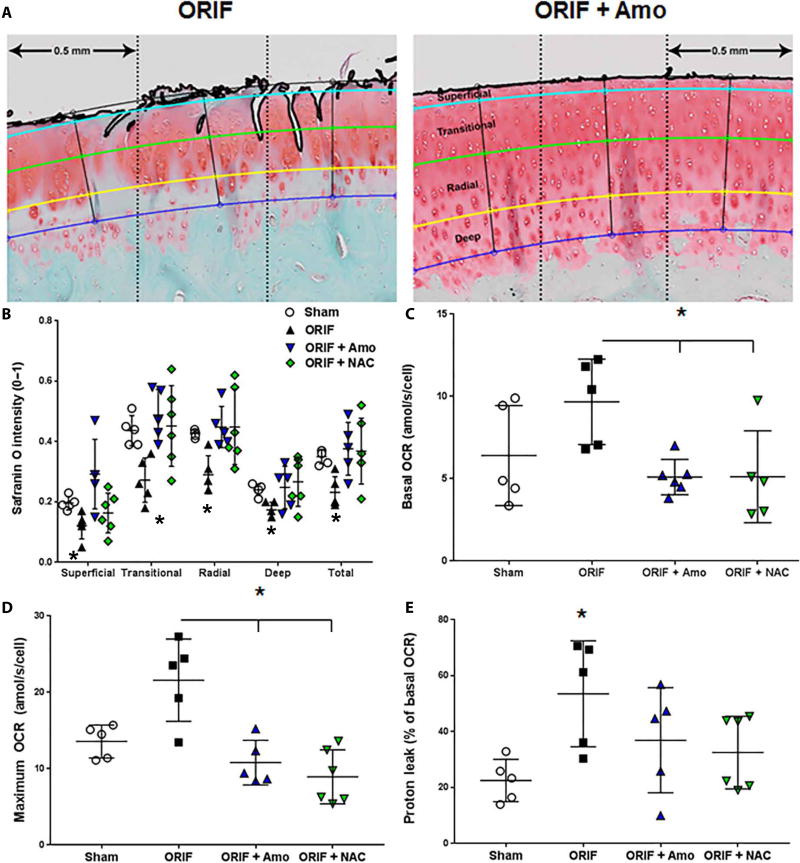
We tested whether inhibiting mechanically responsive articular chondrocyte mitochondria after severe traumatic injury and preventing oxidative damage represent a viable paradigm for posttraumatic osteoarthritis (PTOA) prevention. We used a porcine hock intra-articular fracture (IAF) model well suited to human-like surgical techniques and with excellent anatomic similarities to human ankles. After IAF, amobarbital or N-acetylcysteine (NAC) was injected to inhibit chondrocyte electron transport or downstream oxidative stress, respectively. Effects were confirmed via spectrophotometric enzyme assays or glutathione/glutathione disulfide assays and immunohistochemical measures of oxidative stress. Amobarbital or NAC delivered after IAF provided substantial protection against PTOA at 6 months, including maintenance of proteoglycan content, decreased histological disease scores, and normalized chondrocyte metabolic function. These data support the therapeutic potential of targeting chondrocyte metabolism after injury and suggest a strong role for mitochondria in mediating PTOA.


Figures

Fig. 1
Fig. 1. Amobarbital inhibits chondrocyte complex I activity and is nontoxic to human chondrocytes at therapeutic doses
(A) Spectrophotometric assay of freshly harvested bovine articular chondrocyte NADH (reduced form of nicotinamide adenine dinucleotide) dehydrogenase activity in the presence of increasing concentrations of amobarbital [n = 3; * P < 0.01 versus control via one way analysis of variance (ANOVA)]. For each group and panel, lines indicate mean and SD. (B) Extracellular flux analysis of oxygen consumption rates in bovine chondrocyte monolayers in the presence of increasing concentrations of amobarbital (n = 3; * P < 0.01 versus control via one way ANOVA). Circles represent means. (C) Percent viability as indicated by Calcein AM positivity of human articular chondrocytes taken from human intra-articular fracture (IAF) discards and cultured as osteochondral explants in the presence of amobarbital for 3 days (n = 3 except 2.5 mM, where n = 4; no significant differences via one way ANOVA). (D) Representative images of Calcein AM stained human cartilage explants exposed to amobarbital (n = 3; * P < 0.01 versus control via one way ANOVA). Scale bar, 50 µm. (E) Quantitation of viable cell density within cartilage from Calcein AM images of human explants (n = 3; no statistical differences indicated by one way ANOVA). (F) Whole human cartilage adenosine 5’-triphosphate (ATP) concentration normalized to total DNA content after amobarbital exposure (n = 4; no differences indicated by one way ANOVA). (G) Whole human cartilage ATP concentration normalized to protein content after amobarbital exposure (n = 4; no differences indicated by one way ANOVA).
Fig. 2
Fig. 2. Acute administration of amobarbital or NAC after IAF prevents PTOA development 6 months after IAF
(A) Representative images of the loaded portion of the porcine medial tibia stained for proteoglycan content via safranin O 6 months after fracture [n = 8 for normal, n = 5 for sham, n = 5 for open reduction and internal fixation (ORIF), n = 4 for ORIF + amobarbital (Amo), n = 6 for ORIF + N-acetylcysteine (NAC)]. Images are a composite of 20X scans across the entire anterior-posterior length of the surface. Scale bars, 2 mm. (B) Semi-automated Mankin scoring of the loaded areas of the medial tibia spanning both the anterior and posterior segments [n same as in (A); * P < 0.05 versus normal and sham; ** P < 0.05 versus ORIF; all via two way ANOVA with Dunnett’s posttest). (C) Representative images of the loaded portions of the porcine medial talus stained for proteoglycan content via safranin O 6 months after fracture (n = 8 for normal, n = 5 for sham, n = 5 for ORIF, n = 5 for ORIF + amobarbital, and n = 6 for ORIF + NAC). Images are a composite of 20X scans across either the anterior or posterior (samples cut in half for staining) length of the talus. Scale bars, 2 mm. (D) Semi-automated Mankin scoring of the loaded areas of the medial talus spanning both the anterior and posterior segments (n same as (C), * P < 0.05 versus normal and sham, ** P < 0.05 versus ORIF, all via two way ANOVA with Dunnett’s post-test). Data represent the mean with SD shown.
Fig. 3
Fig. 3. Sham surgical procedures used for IAF modeling cause indications of PTOA by 12 months after ORIF
(A) Representative images of the loaded portion of the porcine medial tibia stained for proteoglycan content via safranin O 12 months after fracture (n = 6 for sham, n = 6 for ORIF, n = 7 for ORIF + amobarbital). Images are a composite of 20X scans across the entire anterior-posterior length of the surface. Scale bar, 2 mm. (B) Semiautomated Mankin scoring of the loaded areas of the porcine medial tibia spanning both the anterior and posterior segments, with maximum and average values given [n same as in (A); all P > 0.05 versus sham as indicated by two-way ANOVA with Dunnett’s posttest]. (C) Representative images of the loaded portions of the porcine medial talus stained for proteoglycan content via safranin O 12 months after fracture [n same as in (A)]. Images are a composite of 20X scans across either the anterior or posterior (samples cut in half for staining) length of the talus. Scale bar, 2 mm. (D) Semiautomated Mankin scoring of the loaded areas of the porcine medial talus spanning both the anterior and posterior segments, with maximum and average values given [n same as in (A)]. (E) Synovial thickness measured from the posterior portion of the capsule at 6 and 12 months [n as indicated in Fig. 2 or in (A) for 6 and 12 months, respectively; * P < 0.05 versus normal via two way ANOVA with Dunnett’s posttest]. (F) Subchondral bone thickness at 6 months from micrographs used for Fig. 2 (n as indicated in Fig. 2, no significant difference found via two way ANOVA with Dunnett’s posttest). Data represent the mean with SD shown.
Fig. 4
Fig. 4. NAC supplements intracellular GSH and prevents indications of oxidative stress after IAF
(A) Spectrophotometric analysis of total glutathione (GSH) concentrations of porcine articular cartilage, both tibial and talar with contralateral joints also shown, 1 week after IAF (n = 10 for ORIF + vehicle, n = 7 for ORIF + NAC; * P < 0.01 versus ORIF via Student’s t-test). (B) Percent of total GSH present as oxidized glutathione disulfide (GSSG) 1 week after IAF (n = 10 for ORIF + vehicle, n = 7 for ORIF + NAC; * P < 0.01 versus ORIF via Student’s t-test). (C) Representative images of immunohistochemical staining for Nrf2 1 week after IAF with percent positive cells per 20X field shown (n = 4 for both groups) in the top row and representative images of confocal immunofluorescent staining for Nrf2 1 week after IAF with percent positive cells per 20X field shown (n = 4 for both groups) in the bottom row. Scale bars, 25 µm. Percentages indicate percent positive cells (SD). (D) Proton leak expressed as a percentage of basal oxygen consumption rate according to standard mitochondrial stress tests conducted on bovine chondrocytes 1 week after IAF (n = 10 for ORIF, n = 7 for ORIF + NAC; * P < 0.05). (E) Proton leak expressed as a percentage of basal oxygen consumption rate (OCR) conducted on freshly harvested rabbit chondrocytes 1 week after impact injury (n = 3 for both groups; * P < 0.05 via Student’s t-test). Data represent the mean with SD shown.
Fig. 5
Fig. 5. Acute loss of mitochondrial content after impact is prevented by inhibition of electron transport or critical redox events
(A) Representative confocal micrographs at 4X magnification showing the site of a 2 J impact to bovine femoral osteochondral explants 24 hours after injury in either 5 or 21% oxygen. Scale bar, 1 mm. Red inset square indicates zone of interest for quantitation (B) and images shown in (C). (B) Quantitation of MitoTracker Deep Red staining 24 hours after 2 J impact (n = 4; * P < 0.01 versus impact alone via one-way ANOVA). Data represent the mean with SD shown. AU, arbitrary units. (C) Representative 10X micrographs of areas within the impact site as indicated by the red square in (A) and an analogous region central to the sham (unimpacted) osteochondral explant was chosen. Scale bar, 100 µm. Calcein AM is shown in green in the top row and MitoTracker Deep Red is shown in red in the bottom row. Amobarbital, NAC, α-tocopherol (Toc), trolox, dimethylmalonate (DMM), and dimethyl succinate (DMS) were all tested. Dark areas within the images indicate cracks or other structural damage from the impacts.
Fig. 6
Fig. 6. Increases in joint inflammation 1 week after IAF were not prevented by NAC or amobarbital
(A) Representative micrographs from porcine anterior talar specimens 1 week after IAF with and without NAC (and glycyrrhizin, an agent intended to decrease inflammation that had a minimal, if any, effect and was added in this treatment group only) that have been formalin fixed and immunohistochemically stained for p65. (B) Quantitation of percent p65 positive-staining cells per 20X field from (A) (n = 4 for all groups; no significant differences noted via Student’s t-test). (C) Illustration of the tissue and cell identification routine developed in Visiomorph software shown under minimally (top) and highly (bottom) inflamed conditions. In the analysis of hematoxylin and eosin (H&E) images, tissue is classified as pink, cell nuclei as purple, and empty space as yellow. Cell counts and tissue areas are calculated from these color-coded images. (D) Average monocyte infiltration quantified from porcine infrapatellar fat pads 1 week after ORIF and a single treatment injection of either hydrogel only (HG) or NAC and glycyrrhizin (NAC/GZ) (n = 5 for normal, n = 8 for positive control, n = 6 for sham, n = 12 for HG and n = 12 for NAC/GZ; * P < 0.01 ORIF versus contralateral for each group except normal via two way ANOVA; ** P < 0.01 for positive control ORIF versus sham ORIF only). Data represent the mean with SD shown. (E) Representative micrographs of rabbit stifle (knee) synovia 1 week after severe impact stained with H&E (n = 3). Scale bar, 250 mm.
Fig. 7
Fig. 7. Articular chondrocytes from amobarbital- and NAC-treated IAFs exhibit healthy anabolism 6 months after IAF
(A) Representative images of the semiautomated segmentation of porcine articular cartilage show how the scoring algorithm defines and tracks input from the different zones of the articular tissue in a continuum along the length of the entire specimen. (B) Local intensities of safranin O staining throughout the different zones of the porcine articular cartilage (* P < 0.01 comparing the ORIF to other groups via two way ANOVA with Dunnett’s posttest). (C) Basal OCRs of freshly harvested porcine chondrocytes 6 months after IAF (n = 5 for sham, n = 5 for ORIF, n = 5 for ORIF + amobarbital, n = 6 for ORIF + NAC; * P < 0.01 versus ORIF via two way ANOVA with Dunnett’s posttest). (D) OCRs after uncoupling (maximum OCR) (n = 5 for sham, n = 5 for ORIF, n = 5 for ORIF + amobarbital, n = 6 for ORIF + NAC; * P < 0.01 versus ORIF via two way ANOVA with Dunnett’s posttest). (E) Proton leak measured in freshly harvested porcine chondrocytes normalized to basal OCR, 6 months after IAF (n = 5 for sham, n = 5 for ORIF, n = 5 for ORIF + amobarbital, n = 6 for ORIF + NAC; * P < 0.05 ORIF versus sham via two way ANOVA with Dunnett’s posttest but no other differences noted). Data represent the mean with SD shown.

References

    1. Brown TD, Johnston RC, Saltzman CL, Marsh JL, Buckwalter JA. Posttraumatic osteoarthritis: a first estimate of incidence, prevalence, and burden of disease. J Orthop Trauma. 2006 Nov-Dec;20(10):739–44. - PubMed
    1. Rivera JC, Wenke JC, Buckwalter JA, Ficke JR, Johnson AE. Posttraumatic osteoarthritis caused by battlefield injuries: the primary source of disability in warriors. J Am Acad Orthop Surg. 2012;20(suppl 1):S64–9. - PMC - PubMed
    1. Praemer A, Furner S, Furner RD. The Burden of Musculoskeletal Diseases in the United States: Prevalence, Societal and Economic Cost. AAOS; 1999.
    1. McKinley TO, Borrelli J, Jr, D’Lima DD, Furman BD, Giannoudis PV. Basic science of intra-articular fractures and posttraumatic osteoarthritis. J Orthop Trauma. 2010 Sep;24(9):567–70. - PMC - PubMed
    1. Marsh JL, Buckwalter JA, Gelberman R, Dirschl D, Olson S, Brown T, Llinias A. Articular fractures: does an anatomic reduction really change the result? J Bone Joint Surg Am. 2002 Jul;84-a(7):1259–71. - PubMed

Publication types

Substances