. 2018 Apr 5;131(14):1532-1544.
doi: 10.1182/blood-2017-05-783845. Epub 2018 Feb 5.

hsa-mir183/EGR1-mediated regulation of E2F1 is required for CML stem/progenitor cell survival

Affiliations

hsa-mir183/EGR1-mediated regulation of E2F1 is required for CML stem/progenitor cell survival

Francesca Pellicano et al. Blood. .

Abstract

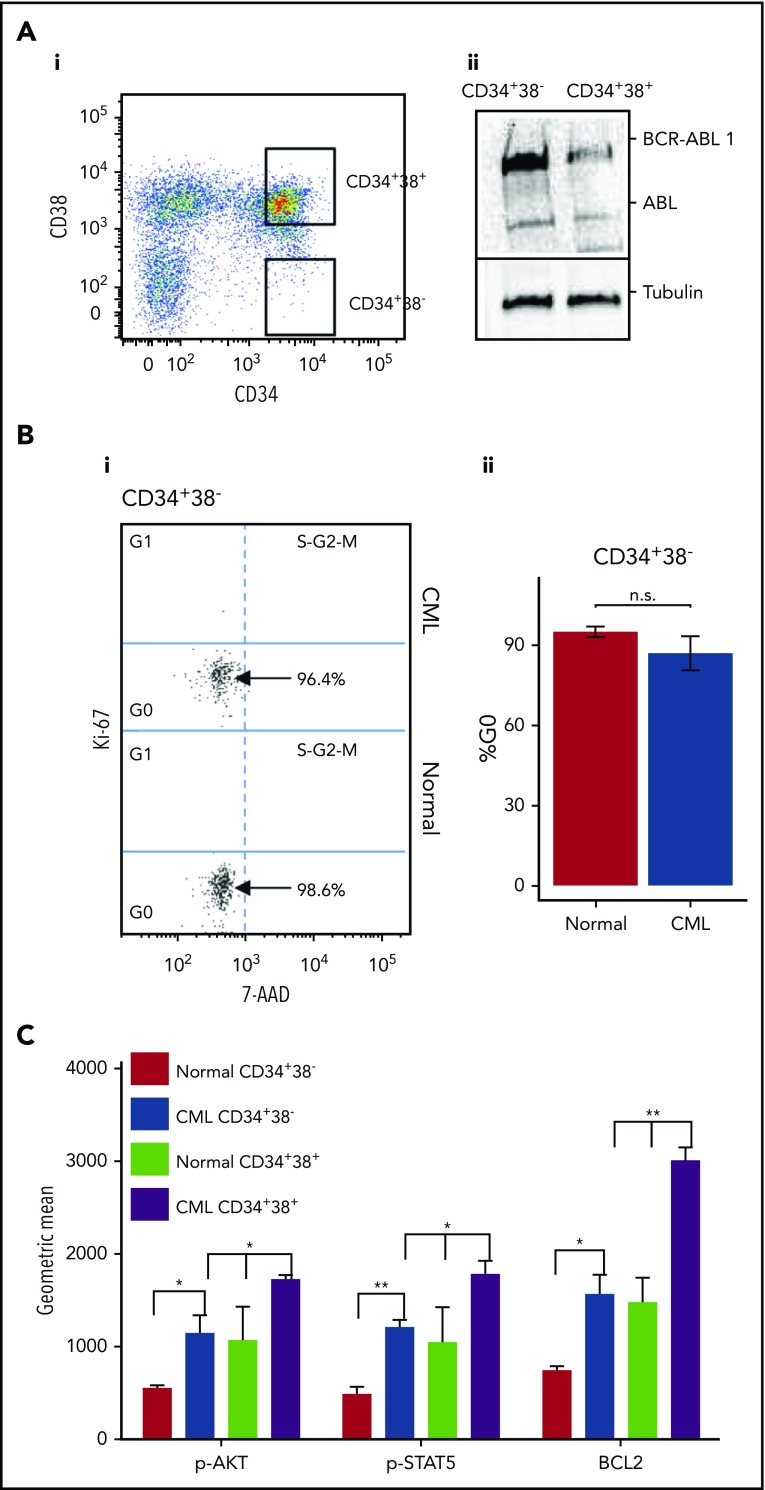
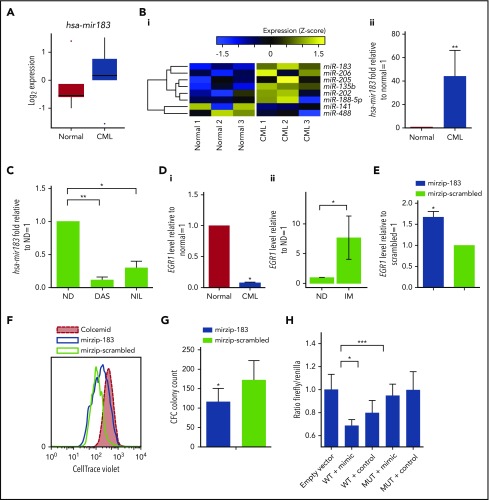
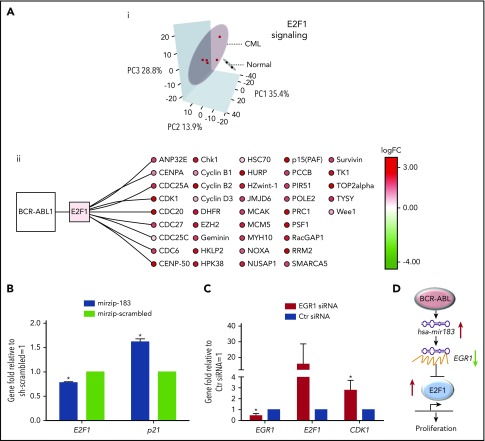
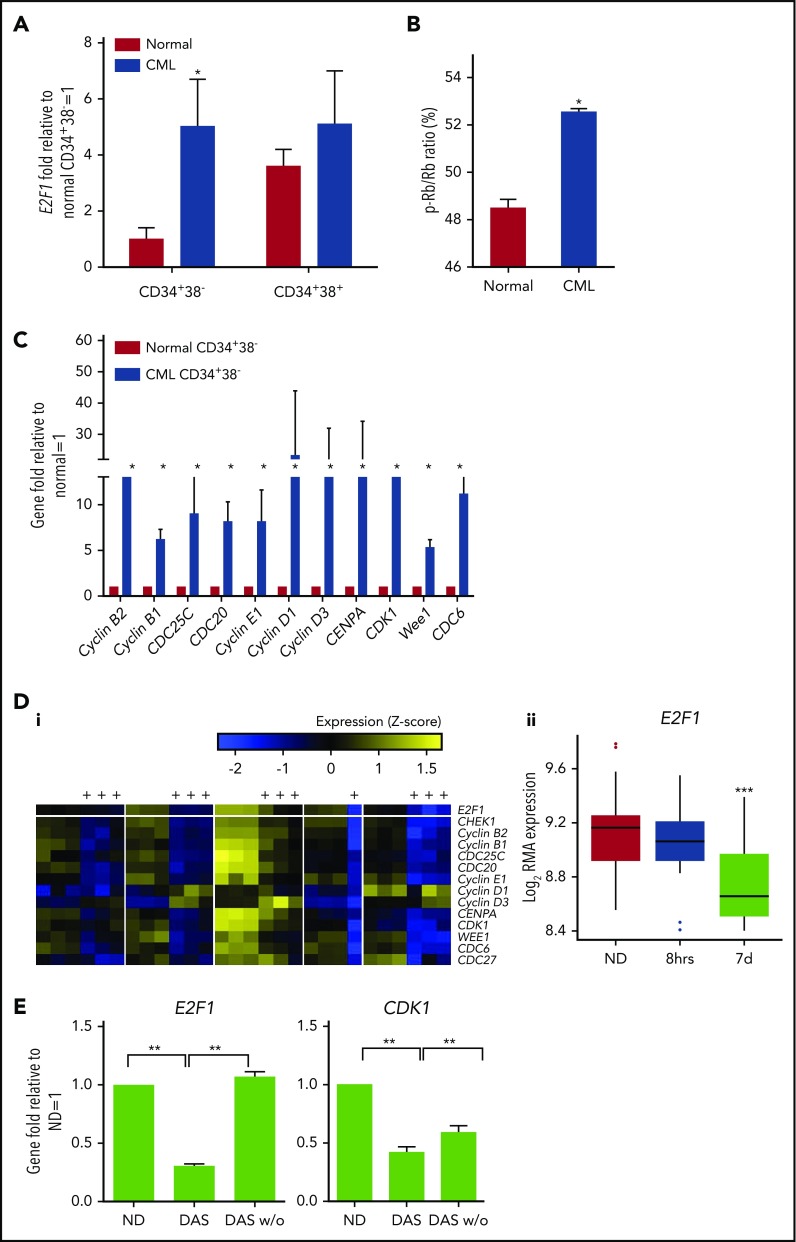
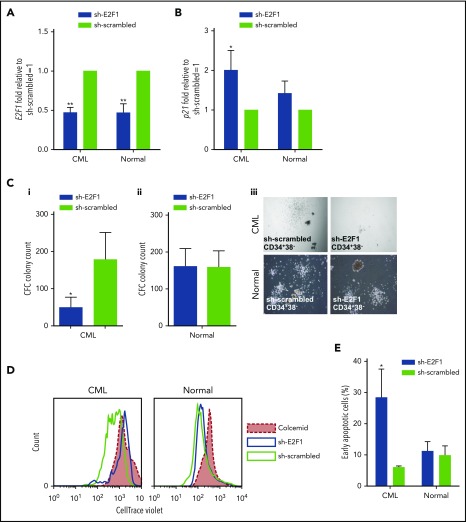
Chronic myeloid leukemia (CML) stem/progenitor cells (SPCs) express a transcriptional program characteristic of proliferation, yet can achieve and maintain quiescence. Understanding the mechanisms by which leukemic SPCs maintain quiescence will help to clarify how they persist during long-term targeted treatment. We have identified a novel BCR-ABL1 protein kinase-dependent pathway mediated by the upregulation of hsa-mir183, the downregulation of its direct target early growth response 1 (EGR1), and, as a consequence, upregulation of E2F1. We show here that inhibition of hsa-mir183 reduced proliferation and impaired colony formation of CML SPCs. Downstream of this, inhibition of E2F1 also reduced proliferation of CML SPCs, leading to p53-mediated apoptosis. In addition, we demonstrate that E2F1 plays a pivotal role in regulating CML SPC proliferation status. Thus, for the first time, we highlight the mechanism of hsa-mir183/EGR1-mediated E2F1 regulation and demonstrate this axis as a novel, critical factor for CML SPC survival, offering new insights into leukemic stem cell eradication.


Conflict of interest statement

Conflict-of-interest disclosure: The authors declare no competing financial interests.

Figures

Figure 1.
Figure 1.
CML SPCs are predominantly quiescent. (Ai) Gating strategy for healthy and CML SPCs enriched for CD34+38 and CD34+38+ cells. (ii) Level of BCR-ABL1 and ABL measured in CD34+38 and CD34+38+ cells. (Bi) Representative dot plots showing the cell-cycle phases in healthy and CML SPCs measured by Ki-67/7-AAD staining. N = 1 representative sample shown. (ii) Percentage of healthy (n = 4) and CML (n = 4) SPCs in G0 cell-cycle phase. (C) Phosphorylation of AKT and STAT5 and level of BCL2 measured by fluorescence-activated cell sorting (FACS) in CML CD34+38 and CD34+38+cells. (*P < .05; **P < .01). n.s., not significant; p-AKT, phospho-AKT; p-STAT5, phospho-STAT5.
Figure 2.
Figure 2.
CML SPCs show regulation of the hsa-mir183/EGR1 axis. (A) Genome-wide miRNA expression for healthy and CML SPCs (N = 5 biological replicates). (Bi) Heatmap for the OncoMir MiRNA Q-PCR Array in SPCs showing statistically significant regulation of miRNAs between healthy and CML SPCs. (ii) Q-PCR for hsa-mir183 regulation in CML vs healthy SPCs. (C) CML SPCs treated for 24 hours with dasatinib (DAS; 150 nM) and nilotinib (NIL; 1 µM) and analysis by Q-PCR for hsa-mir183. (Di) mRNA level of the hsa-mir183 target gene EGR1 in healthy and CML CD34+38 cells. (ii) CML CD34+ cells treated for 7 days with imatinib (IM; 5 µM) and live cells analyzed by Q-PCR for EGR1 expression (N = 6). (E) hsa-mir183 knockdown GFP+ CML SPCs sorted and analyzed for EGR1 mRNA level by Q-PCR. Mir zip-scrambled vector was used as negative control. (F) Representative plot for cell divisions analyzed in hsa-mir183 knockdown GFP+ CML SPCs using Cell Trace Violet staining. Colcemid treatment used to visualize undivided cells. (G) CFC analysis carried out in hsa-mir183 knockdown CML SPCs. (H) Luciferase assay showing binding between of hsa-mir183 and EGR1 in KCL22 cells. Cells transfected with oligos containing the EGR1 3′UTR (along with the binding site for hsa-mir183, WT) or a mutant version (MUT) together with hsa-mir183 mimic or scrambled negative control. Each experiment had N = 3 biological replicates; *P < .05; **P < .01; *** P < .001. ND, no drug.
Figure 3.
Figure 3.
CML SPCs show deregulation of E2F1-signaling networks. (Ai) Analysis of mRNA screen for CD34+PYHo healthy (N = 2 biological replicates) and CML (N = 5 biological replicates) cells. PCA reduced the high-dimensional data set to 3 dimensions using E2F1 targets as obtained from MetaCoreKB (targets listed in supplemental Table 3). Each sample is represented as a dot; CML and healthy samples are colored red and black, respectively. Three-dimensional (3D) ellipses are drawn around each set of samples (CML or healthy) using the mean and covariance of that set, to represent each sample type’s 95% confidence region. Axes labels indicate the percentage of variability accounted for by each principal component (PC). (ii) The network of BCR-ABL1, E2F1, and E2F1 targets, significantly deregulated in CML is shown. Node color indicates transcriptional deregulation in CML vs healthy G0 cells (ArrayExpress accession E-MTAB-2508), with red/green indicating up/downregulation, respectively; color intensity indicates the extent of the deregulation (as indicated by the color bar). (B) Levels of E2F1 and p21 mRNA measured by Q-PCR in hsa-mir183 knockdown CML SPCs. (C) Levels of EGR1, E2F1, and CDK1 mRNA measured by Q-PCR after knocking down EGR1 by siRNA in CML SPCs. (D) Schematic summary of the hsa-mir183/EGR1–mediated regulation of E2F1 (each experiment had N = 3 biological replicates;*P < .05). Ctr, control; logFC, log fold change.
Figure 4.
Figure 4.
E2F1 regulation in CML SPCs by BCR-ABL1. (A) Nuclear levels of E2F1 mRNA measured in healthy and CML CD34+38 and CD34+38+ cells by Q-PCR. (B) Phosphorylation level of Rb measured in healthy and CML SPCs by a high-content screening-based platform. (C) mRNA levels of E2F1 downstream genes measured in healthy and CML CD34+38 and CD34+38+ cells by Q-PCR. (Di) Heatmap showing regulation of E2F1 and its signaling (yellow, upregulation; blue, downregulation, see color bar) in CML SPCs after treatment with TKIs (values for imatinib, dasatinib, and nilotinib pooled together) for 7 days (treated columns indicated by “+”). (ii) E2F1 response to TKI treatment of 8 hours and 7 days. (E) E2F1 and CDK1 mRNA levels from CML SPCs treated with dasatinib (DAS, 150 nM) or washed out and cultured for a further 3 days (DAS w/o). ●, Outliers as calculated using the Tukey method. Each experiment had N = 3 biological replicates. *P < .05; **P < .01; ***P < .001. RMA, robust multiarray average.
Figure 5.
Figure 5.
Healthy E2f1−/−SPCs cells retain functionality. (A) E2f1−/− or WT BM LSK cells transplanted into lethally irradiated CD45.1+ WT recipient mice (n = 5) for long-term reconstitution (i). Sixteen weeks posttransplantation, CD45.2+ LSK WT or E2f1−/− cells purified from harvested BM and transplanted into lethally irradiated CD45.1+ WT secondary recipient mice (N = 4/5) (ii). The engraftment ability of E2f1+/+ WT (black) and E2f1−/− (gray) LSK cells was assessed by the percentage of CD45.2+/CD45.1 cells in PB at weeks 4, 8, 12, and 16 post primary and secondary transplantation. (Bi) Schematic representation of experimental design. E2f1−/− (CD45.2+) and E2f1+/+ WT BM cells (CD45.1+) were transplanted in ratios of 9:1, 1:1, and 1:9 into lethally irradiated (7Gy) CD45.1+ WT recipient mice (N = 5) for long-term reconstitution. (ii) Percentages of CD45.2+ E2f1−/− donor vs recipient cells (CD45.1+) at weeks 4, 8, 12, and 16 posttransplant. NS, not significant with P > .05.
Figure 6.
Figure 6.
E2F1 knockdown induces a block in proliferation and increased cell death in CML SPCs. mRNA levels of (A) E2F1 and (B) p21 by Q-PCR in E2F1 knockdown GFP+ healthy and CML SPCs. Transfection with scrambled vector was used as negative control. (C) CFC analysis to measure colony-forming ability following E2F1 knockdown in (i) CML and (ii) healthy SPCs. (iii) Representative images for CFC from healthy and CML SPCs upon E2F1 knockdown (phase-contrast images, ×10 magnification). (D) Representative histogram of cell divisions by CellTrace Violet staining in E2F1 knockdown healthy and CML SPCs. Colcemid treatment was used to visualize undivided cells. (E) Percentage of early apoptosis indicated by Annexin V+/7-AAD cells. Each experiment had N = 3 biological replicates. *P < .05; **P < .01.

Comment in

References

    1. Druker BJ, Tamura S, Buchdunger E, et al. Effects of a selective inhibitor of the Abl tyrosine kinase on the growth of Bcr-Abl positive cells. Nat Med. 1996;2(5):561-566. - PubMed
    1. Bhatia R, Holtz M, Niu N, et al. Persistence of malignant hematopoietic progenitors in chronic myelogenous leukemia patients in complete cytogenetic remission following imatinib mesylate treatment. Blood. 2003;101(12):4701-4707. - PubMed
    1. Mahon FX, Réa D, Guilhot J, et al. ; Intergroupe Français des Leucémies Myéloïdes Chroniques. Discontinuation of imatinib in patients with chronic myeloid leukaemia who have maintained complete molecular remission for at least 2 years: the prospective, multicentre Stop Imatinib (STIM) trial. Lancet Oncol. 2010;11(11):1029-1035. - PubMed
    1. Graham SM, Jørgensen HG, Allan E, et al. Primitive, quiescent, Philadelphia-positive stem cells from patients with chronic myeloid leukemia are insensitive to STI571 in vitro. Blood. 2002;99(1):319-325. - PubMed
    1. Chen IM, Harvey RC, Mullighan CG, et al. Outcome modeling with CRLF2, IKZF1, JAK, and minimal residual disease in pediatric acute lymphoblastic leukemia: a Children’s Oncology Group study. Blood. 2012;119(15):3512-3522. - PMC - PubMed

Publication types

MeSH terms