. 2018 Apr 5;131(14):1600-1610.
doi: 10.1182/blood-2017-12-819870. Epub 2018 Feb 2.

HO-1hi patrolling monocytes protect against vaso-occlusion in sickle cell disease

Affiliations

HO-1hi patrolling monocytes protect against vaso-occlusion in sickle cell disease

Yunfeng Liu et al. Blood. .

Abstract

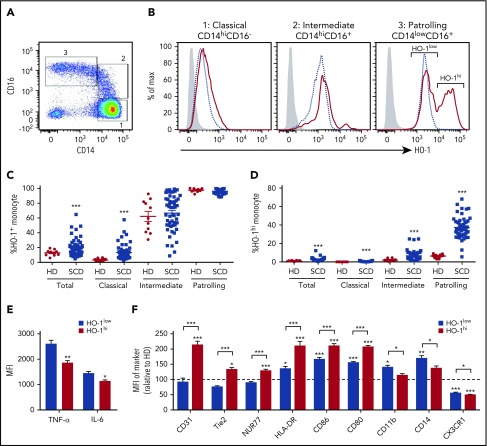
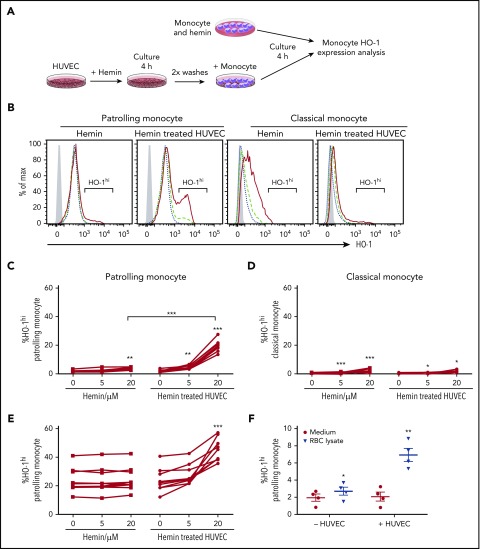
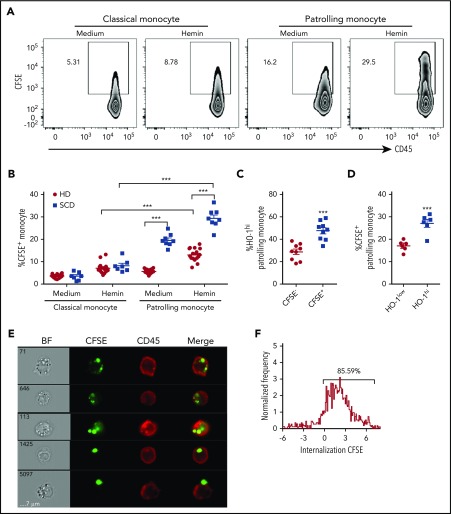
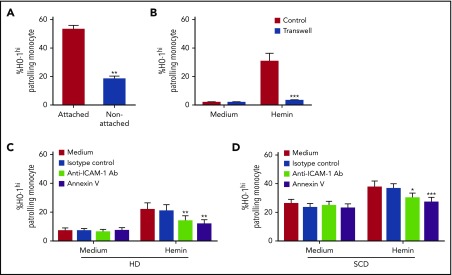
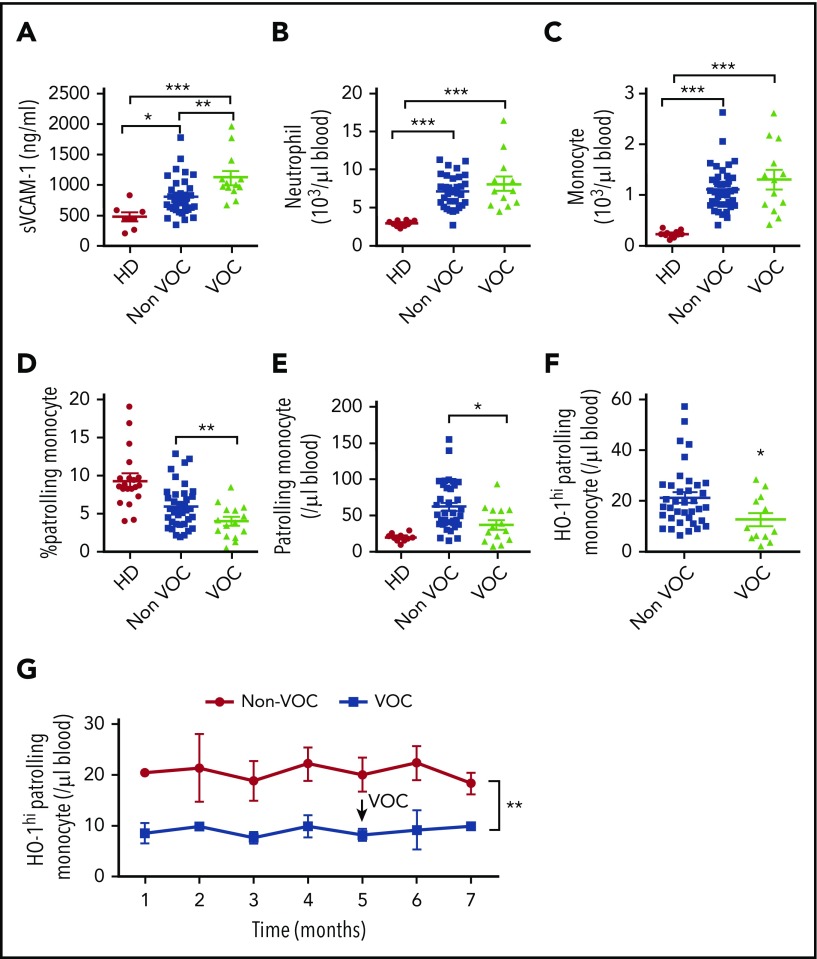
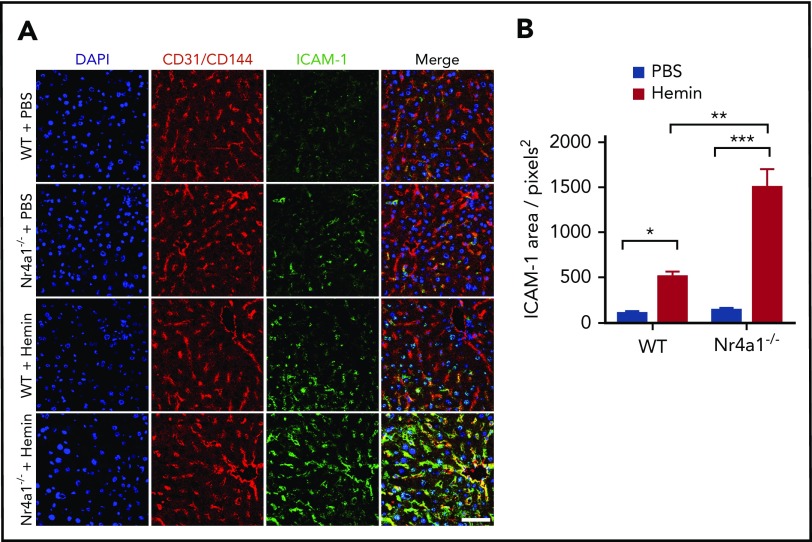
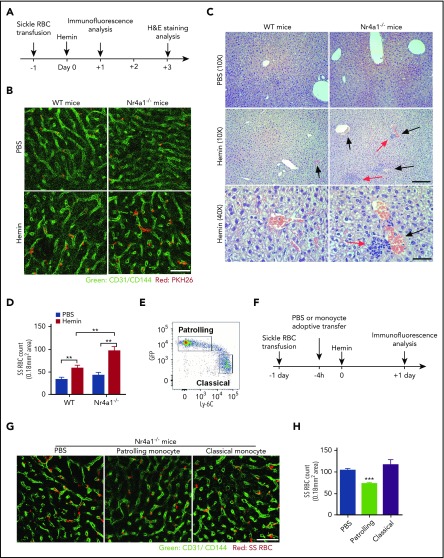
Patients with sickle cell disease (SCD) suffer from intravascular hemolysis associated with vascular injury and dysfunction in mouse models, and painful vaso-occlusive crisis (VOC) involving increased attachment of sickle erythrocytes and activated leukocytes to damaged vascular endothelium. Patrolling monocytes, which normally scavenge damaged cells and debris from the vasculature, express higher levels of anti-inflammatory heme oxygenase 1 (HO-1), a heme degrading enzyme. Here, we show that HO-1-expressing patrolling monocytes protect SCD vasculature from ongoing hemolytic insult and vaso-occlusion. We found that a mean 37% of patrolling monocytes from SCD patients express very high levels of HO-1 (HO-1hi) vs 6% in healthy controls and demonstrated that HO-1hi expression was dependent on uptake of heme-exposed endothelium. SCD patients with a recent VOC episode had lower numbers of HO-1hi patrolling monocytes. Heme-mediated vaso-occlusion by mouse SCD red blood cells was exacerbated in mice lacking patrolling monocytes, and reversed following transfer of patrolling monocytes. Altogether, these data indicate that SCD patrolling monocytes remove hemolysis-damaged endothelial cells, resulting in HO-1 upregulation and dampening of VOC, and that perturbation in patrolling monocyte numbers resulting in lower numbers of HO-1hi patrolling monocyte may predispose SCD patients to VOC. These data suggest that HO-1hi patrolling monocytes are key players in VOC pathophysiology and have potential as therapeutic targets for VOC.


Conflict of interest statement

Conflict-of-interest disclosure: The authors declare no competing financial interests.

Figures

Figure 1.
Figure 1.
HO-1hiPMo characterization. (A) Representative dot plot of CD14 and CD16 expression in circulating monocytes of SCD patients showing 3 subsets: classical CD14hiCD16 (gate 1), intermediate CD14hiCD16+ (gate 2), and patrolling CD14lowCD16+ (PMo) (gate 3). (B) Representative histograms comparing HO-1 expression in the 3 monocyte subsets from SCD patients (red solid line) and race-matched healthy controls (blue dashed line). Isotype control is shown as gray-filled histogram. Gating for HO-1+ population was set according to the corresponding isotype background. Two peaks of HO-1 expression, indicated as HO-1hi and HO-1low, can be clearly discerned in PMos from SCD patients. (C) Frequencies of total HO-1+–expressing circulating monocyte populations (relative to isotype control) in race-matched healthy controls (n = 10) and SCD patients (n = 52). (D) Frequencies of HO-1hi–expressing monocytes (based on the gating strategy in PMos as shown in panel B) in the same individuals as in panel C: 10 race-matched healthy controls and 52 SCD patients. (E) PMos from SCD patients (n = 8) were purified, and following 4 hours LPS (200 ng/mL) stimulation, intracellular TNF-α and IL-6 expression in HO-1hi vs HO-1low subpopulations of PMos was measured by flow cytometry. (F) Expression of monocyte markers in HO-1hi and HO-1low PMos from SCD patients (n = 21) relative to levels expression by HD HO-1low PMo. Data represent mean ± SEM; means in panels C and D were compared using 2-tailed Student t test. Means in panels E and F were compared using 2-tailed paired Student t test. *P < .05; **P < .01; ***P < .001. MFI, mean fluorescence intensity.
Figure 2.
Figure 2.
Hemin-treated HUVECs induce high-level HO-1 expression in PMo. (A) Schematic representation of experimental design. Purified total monocytes were cultured directly with hemin or with HUVECs pretreated with hemin for 4 hours before monocyte HO-1 expression analysis. (B) Representative histograms comparing HO-1 expression in monocyte subsets from the cultures without or with HUVECs. No hemin (blue short dashed line), hemin 5 µM (green long dashed line), and hemin 20 µM (red solid line). Isotype control is shown as gray-filled histogram. Frequencies of HO-1hi–expressing (C) PMos and (D) CMos from HDs (n = 7) following 4 hours of exposure of purified monocytes to heme alone (5 and 20 µM) or HUVECs pretreated with hemin (5 and 20 µM). (E) Frequencies of HO-1hi–expressing PMos from SCD patients (n = 9) using the same experimental protocol as for HDs. (F) Frequencies of HO-1hi–expressing PMos from HDs (n = 4) exposed to RBC lysate (120 µM total heme level) alone or HUVECs pretreated with RBC lysate. Data represent mean ± SEM; means were compared using 2-tailed paired Student t test. *P < .05; **P < .01; ***P < .001.
Figure 3.
Figure 3.
PMos uptake hemin-exposed HUVECs. CFSE-labeled HUVECs were pretreated without (“medium”) or with hemin (20 µM) before coculturing with purified monocytes from HDs (n = 18, filled circles) or SCD patients (n = 8, filled squares) for 4 hours. (A) Representative dot plots comparing CFSE+ classical and PMos. (B) Frequencies of CFSE+ classical and PMos are shown. (C) Frequencies of HO-1hi–expressing cells in PMos from HDs (n = 9) comparing CFSE (no attachment/uptake of CFSE+ cellular material) and CFSE+ (representing cells that have adhered to/taken up CFSE+ cellular material) subpopulations following coculture with labeled hemin-treated HUVECs. (D) Comparison of frequencies of CFSE+ PMos from SCD patients (n = 6) in HO-1low vs HO-1hi subpopulations following coculture with HUVECs. (E) Representative flow cytometry images acquired simultaneously and gated on CFSE+ patrolling CD14lowCD16+ monocytes from SCD patients (from panel A). Right to left: single-channel bright field (BF), CFSE (representing HUVEC material in green), CD45 (representing PMos in red), and merged images showing CFSE+ materials within CD45+ cells in the first 4 rows, but not in the last row where CFSE+ material is attached to the external surface of PMo. (F) Histogram depicting degree of CFSE+ material internalized within PMos with internalization score: <0 represents CFSE+ material attached to the surface of PMos; >0 represents CFSE+ material internalized by PMo. Percentage of cells with internalization score of >0 is indicated. Data represent mean ± SEM; means were compared using 2-tailed paired Student t test (medium vs hemin treatment as well as monocyte subset vs other monocyte subset in the same donor/patient) and unpaired Student t tests (HD vs SCD patients). ***P < .001.
Figure 4.
Figure 4.
Mechanism of HO-1hiinduction by heme-damaged HUVECs in PMos. (A) Following culturing of purified monocytes from HDs (n = 4) with hemin-pretreated HUVECs (20 µM) for 4 hours, frequency of HO-1hi in nonadherent vs adherent monocytes was analyzed. (B) Frequencies of HO-1hi–expressing PMos from HDs (n = 5) in the transwell culture system (blue bars) in which HUVECs exposed to hemin (20 μM) or not (“medium”) were placed in the bottom well and separated from purified monocytes on the top well. At the same time, as a control (“Control”), monocytes were also cocultured directly with HUVECs exposed to hemin (20 µM) or not (“medium”). Hemin (20 µM) exposed HUVEC was preincubated with annexin V or blocking antibodies anti-ICAM-1, VCAM-1, or isotype control for 30 minutes before addition of purified monocyte from (C) HDs (n = 5) and (D) SCD patients (n = 8). Frequencies of HO-1hi–expressing PMos were then analyzed. Data represent mean ± SEM; means were compared using 2-tailed paired Student t test. *P < .05; **P < .01; ***P < .001. Ab, antibody.
Figure 5.
Figure 5.
Reduced HO-1hiPMos in SCD patients at risk of VOC. (A) Soluble VCAM-1 levels in platelet-free plasma from race-matched HDs (n = 10) and SCD patients grouped as “Non-VOC” (n = 38) and “VOC” (n = 15, see “Methods” for patient characteristics) were tested by enzyme-linked immunosorbent assay. Absolute (B) neutrophil and (C) monocyte counts in peripheral blood were determined by Advia Hematology Analyzer. (D) Frequency of PMos within total circulating monocyte population. Absolute numbers of (E) PMos and (F) HO-1hi PMos were calculated based on monocyte counts and monocyte subset frequency. (G) Absolute numbers of HO-1hi PMos at monthly intervals in the VOC (n = 6) and non-VOC (n = 11) groups. The arrow indicates the timing of the vaso-occlusive event in the VOC group. Data represent mean ± SEM; means in panels A-F were compared using 2-tailed Student t test and means in panel G were compared using 2-way analysis of variance. *P < .05; **P < .01; ***P < .001.
Figure 6.
Figure 6.
Hemin induces higher vascular ICAM-1 expression in Nr4a1−/−mice. WT mice and Nr4a1−/− mice were injected with hemin (30 μmol/kg mouse) or phosphate-buffered saline (PBS). (A) Whole mount immunofluorescence analysis of livers 24 hours postinjection showing ICAM-1 (green), CD31/CD144 (red), and 4′,6-diamidino-2-phenylindole (DAPI) (blue). Scale bar = 50 µm. Yellow in “Merge” images indicates colocalization of ICAM-1 (green) expression on CD31/CD144+ ECs (red). A pronounced increase in ICAM1 expression was evident due to hemin injection in Nr4a1−/− mice. (B) Quantification of the area of blood vessels expressing ICAM-1 in the Nr4a1−/− and control groups using Image J software. Data represent mean ± SEM; means were compared using 2-tailed Student t test. *P < .05; **P < .01; ***P < .001 (n = 6-8 mice per group).
Figure 7.
Figure 7.
Increased sickle RBC stasis in Nr4a1−/−mice and reversal by adoptively transferred PMo. (A) Experimental schedule for induction of sickle RBC stasis and analysis. WT mice and Nr4a1−/− mice were transfused with PKH26-labeled mouse sickle RBCs (1.5 × 10⁹ RBCs per mouse) followed by injection of hemin (30 μmol/kg mouse) followed by analysis at the indicated times. As a control, some of the transfused mice received PBS instead of hemin. (B) Whole mount immunofluorescence of perfused livers from WT or Nr4a1−/− mice showing CD31/CD144 (endothelial markers, green) and PKH26 (red). Scale bar = 50 µm. (C) Representative hematoxylin and eosin (H&E)–stained liver sections of sickle RBC transfused mice (scale bars = 200 µm [first 2 rows] and 50 µm [last row]). Black arrows indicate RBC stasis within blood vessels. Red arrows depict leukocyte infiltration. (D) Enumeration of PKH26+, representing sickle RBCs (“SS RBC”), per image in perfused livers in panel B as quantified using Image J software, indicating increased stasis in hemin-treated Nr4a1−/− mice. (E) Gating strategy for sorting GFP+ Ly6C PMos and GFPlowLy-C6+ CMo populations from spleen and blood of Nr4a1-GFP reporter mice. (F) Experimental schedule for adoptive transfer of sorted monocyte subsets into sickle RBC stasis model and analysis. PBS or purified PMos or CMos were adoptively transferred (5 × 10⁵ monocytes per mouse) into Nr4a1−/− mice that had received first PKH26-labeled sickle RBCs (1.5 × 10⁹ RBCs per mouse) followed by injection of hemin (30 μmol/kg mouse) and analysis at the indicated times. (G) Representative confocal images in liver blocks of perfused mice comparing control PBS mice (no adoptive transfer) and PMos or CMos adoptively transferred mice. Scale bar = 50 μm. (H) Enumeration of sickle RBCs per image in perfused livers as quantified using Image J software. Data represent mean ± SEM; means were compared using 2-tailed Student t test. **P < .01; ***P < .001 (n = 6-8 mice per group).

Comment in

References

    1. Zhang D, Xu C, Manwani D, Frenette PS. Neutrophils, platelets, and inflammatory pathways at the nexus of sickle cell disease pathophysiology. Blood. 2016;127(7):801-809. - PMC - PubMed
    1. Kato GJ, Hebbel RP, Steinberg MH, Gladwin MT. Vasculopathy in sickle cell disease: Biology, pathophysiology, genetics, translational medicine, and new research directions. Am J Hematol. 2009;84(9):618-625. - PMC - PubMed
    1. Larsen R, Gouveia Z, Soares MP, Gozzelino R. Heme cytotoxicity and the pathogenesis of immune-mediated inflammatory diseases. Front Pharmacol. 2012;3:77. - PMC - PubMed
    1. Belcher JD, Beckman JD, Balla G, Balla J, Vercellotti G. Heme degradation and vascular injury. Antioxid Redox Signal. 2010;12(2):233-248. - PMC - PubMed
    1. Gladwin MT. Cardiovascular complications and risk of death in sickle-cell disease. Lancet. 2016;387(10037):2565-2574. - PubMed

Publication types

MeSH terms