. 2018 Jan 1;32(1):79-92.
doi: 10.1101/gad.309245.117. Epub 2018 Feb 1.

Protein synthesis controls phosphate homeostasis

Affiliations

Protein synthesis controls phosphate homeostasis

Mauricio H Pontes et al. Genes Dev. .

Abstract

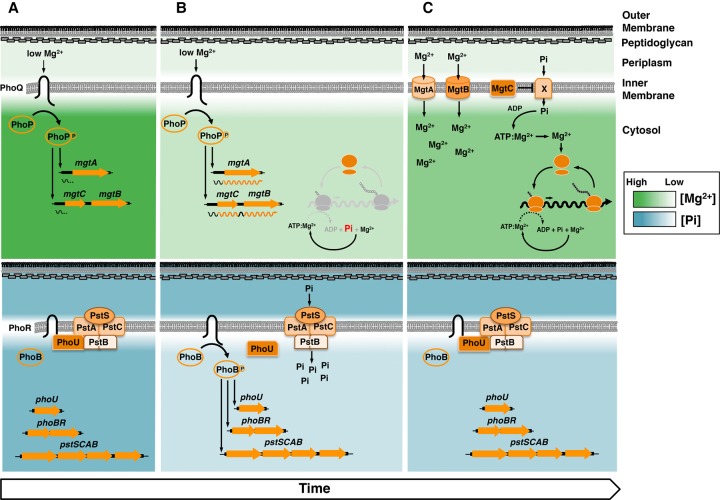
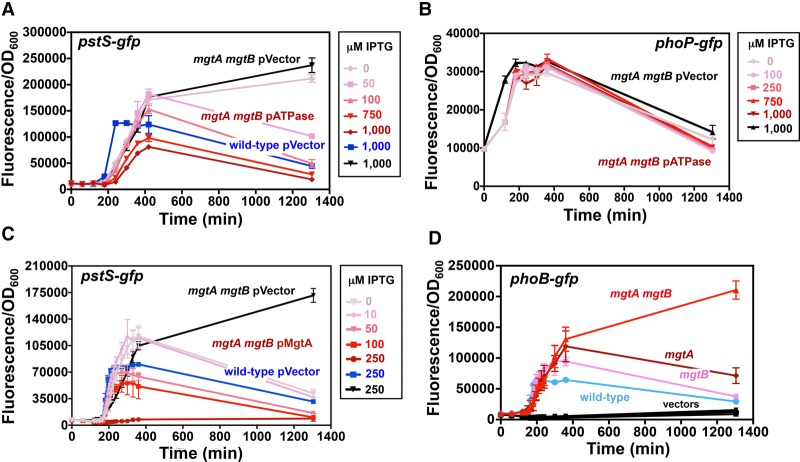
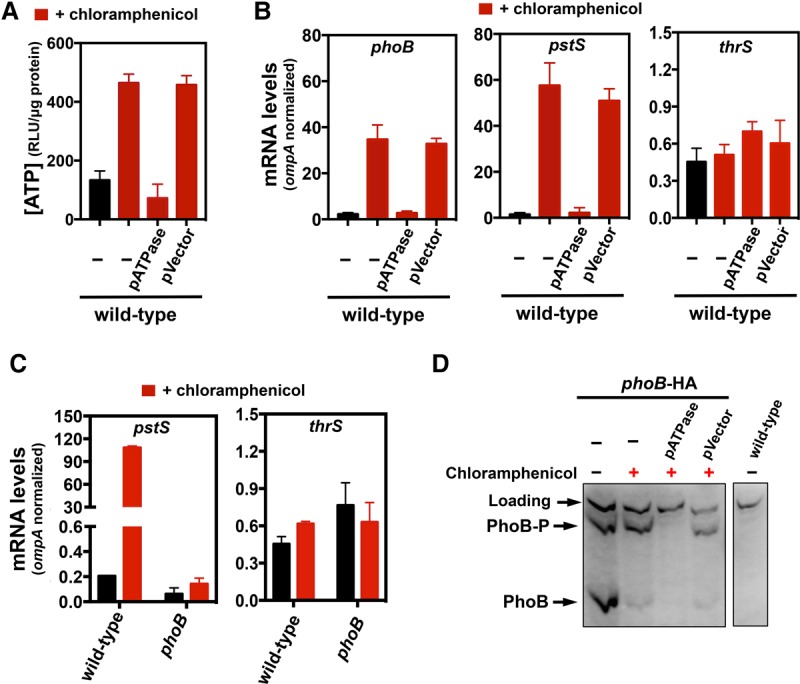
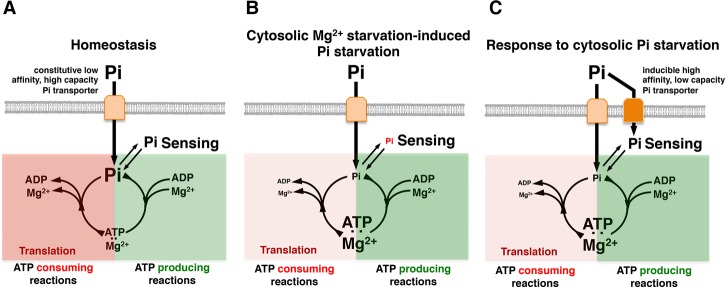
Phosphorus is an essential element assimilated largely as orthophosphate (Pi). Cells respond to Pi starvation by importing Pi from their surroundings. We now report that impaired protein synthesis alone triggers a Pi starvation response even when Pi is plentiful in the extracellular milieu. In the bacterium Salmonella enterica serovar Typhimurium, this response entails phosphorylation of the regulatory protein PhoB and transcription of PhoB-dependent Pi transporter genes and is eliminated upon stimulation of adenosine triphosphate (ATP) hydrolysis. When protein synthesis is impaired due to low cytoplasmic magnesium (Mg2+), Salmonella triggers the Pi starvation response because ribosomes are destabilized, which reduces ATP consumption and thus free cytoplasmic Pi. This response is transient because low cytoplasmic Mg2+ promotes an uptake in Mg2+ and a decrease in ATP levels, which stabilizes ribosomes, resulting in ATP consumption and Pi increase, thus ending the response. Notably, pharmacological inhibition of protein synthesis also elicited a Pi starvation response in the bacterium Escherichia coli and the yeast Saccharomyces cerevisiae Our findings identify a regulatory connection between protein synthesis and Pi homeostasis that is widespread in nature.

Keywords: ATP; Mg2+; PhoB/PhoR; PhoP/PhoQ; Pi; translation.


Figures

Figure 1.
Figure 1.
Cartoon representation of the PhoP/PhoQ and PhoB/PhoR systems, regulated targets, and cellular behavior during Pi starvation induced in low cytoplasmic Mg2+. (A, top) Low extracytoplasmic Mg2+ activates PhoQ, which promotes the phosphorylated state of PhoP (PhoP-P), which in turn promotes transcription initiation from the mgtA and mgtCB promoters. Transcription stops before RNA polymerase (RNAP) reaches the mgtA- and mgtCB-coding regions. (Bottom) High extracellular and intracellular free Pi promotes an interaction between the sensor kinase PhoR and the PstB component of the high-affinity Pi transporter via the regulatory protein PhoU, which inhibits the activity of the PhoB/PhoR system. (B, top) As free cytoplasmic Mg2+ decreases, ribosome subunits are unable to associate efficiently, translation slows down, ATP consumption decreases, and transcription elongation into mgtA- and mgtCB-coding regions takes place. (Bottom) The decrease in ATP consumption prevents the liberation of Pi into the cytosol, leading to a decrease in free cytoplasmic Pi. The low concentration of free cytoplasmic Pi disrupts the inhibitory activity of PhoU, resulting in PhoB/PhoR activation even when extracytoplasmic Pi is high. (C, top) Restoration of free cytoplasmic Mg2+ by the MgtA and MgtB proteins importing Mg2+ into the cytoplasm and the MgtC protein reducing the importation of Pi (via an unknown mechanism/Pi transporter X), which feeds into the synthesis of the Mg2+-chelating ATP. The increase in free cytoplasmic Mg2+ restores translation, which results in ATP hydrolysis and recycling of intracellular Pi. (Bottom) Elevated ATP hydrolysis increases free cytoplasmic Pi levels, restoring the PhoU-mediated inhibition of PhoB/PhoR activity.
Figure 2.
Figure 2.
Low cytoplasmic Mg2+ induces a transcriptional signature of Pi starvation. (A,B) RNAP ChIP-seq results of selected genes in wild-type Salmonella (14028s) grown in N-minimal medium containing 10 µM Mg2+ (red) or 50 µM MgCl2 (green) to an OD600 of ∼0.3. Input (nonimmunoprecipitated DNA) is also shown (black). Peak heights were normalized to the total number of assembled nucleotides. (CE) Fluorescence from wild-type Salmonella (14028s) harboring pPhoB-GFP (C), pPhoP-GFP (D), and the promoterless GFP vector pVector and inducible GFP vector pGFPON (pUH-GFP; 325 µM IPTG) (E) grown in MOPS medium containing 500 µM K2HPO4 and the indicated concentrations of MgCl2. (FH) Fluorescence from wild-type Salmonella (14028s) harboring pPhoB-GFP (F), pPhoP-GFP (G), and the promoterless GFP vector pVector and constitutive GFP vector pGFPON (pUH-GFP; 100 µM IPTG) (H) grown in MOPS medium containing 500 µM MgCl2 and the indicated concentrations of K2HPO4. Error bars represent the standard deviations. Graphs are representative of at least three independent experiments with a total of at least six biological replicates. See also Supplemental Figure S1.
Figure 3.
Figure 3.
The Mg2+ transporters MgtA and MgtB and the ATPase inhibitor MgtC regulate PhoB activity in opposite ways. (A) Fluorescence from wild-type Salmonella (14028s) harboring pPhoB-GFP (phoB-gfp), pMgtA-leader-GFP (mgtA-gfp), pMgtC-leader-GFP (mgtC-gfp), or the promoterless GFP vector pVector plasmid. (B) Fluorescence from wild-type (14028s), mgtA mgtB (EG17048), and mgtC (EL4) Salmonella harboring pPhoB-GFP or pVector. (C) Fluorescence from wild-type (14028s), mgtA mgtB (EG17048), mgtC (EL4), and mgtA mgtCB (MP363) Salmonella harboring pPstS-GFP or pVector. (D) Fluorescence from wild-type (14028s), phoB (EG9054), mgtA mgtB (EG17048), and mgtA mgtB (EG17048) and phoB mgtA mgtB (MP1184) Salmonella following 24 h of growth on solid medium. (E) Fluorescence from wild-type Salmonella (14028s) harboring pPhoB-GFPAAV, pPstS-GFPAAV, or pVectorAAV. For all experiments, cells were grown in MOPS liquid or on solid (1% agarose) medium containing 10 µM MgCl2 and 500 µM K2HPO4. Error bars represent the standard deviations. Graphs are representative of at least three independent experiments with a total of at least six biological replicates. See also Supplemental Figure S2.
Figure 4.
Figure 4.
MgtC reduces cytoplasmic Pi during cytoplasmic Mg2+ starvation. (A) Fluorescence from wild-type (14028s) and mgtC (EL4) Salmonella carrying pPstS-GFPc and either pUHE-21 (pVector) or pUHE-MgtC (pMgtC) grown in the presence of different concentrations of IPTG. The fluorescence of mgtC (EL4)/pMgtC cultures lacking IPTG is also shown. (B) Fluorescence from wild-type (14028s) and mgtC (EL4) strains carrying pPstS-GFPc and pVector in the presence of 500 µM IPTG and mgtC (EL4)/pMgtC at the indicated IPTG concentrations. The arrow indicates the time when 250 µM IPTG was added to the cultures. (C) Fluorescence from wild-type (14028s) and mgtC (EL4) Salmonella carrying pPstS-GFPc and pVector during growth in 10 or 1000 µM MgCl2 and of mgtC (EL4)/pMgtC Salmonella in the presence of the indicated MgCl2 concentrations. Unless indicated in the figure, bacteria were grown in the presence of 250 µM IPTG. (D) Total intracellular Pi in wild type (14028s), mgtC (EL4), or mgtC (EL4)/pMgtC or pVector, mgtA mgtB (EG17048) Salmonella, and mgtA mgtB (EG17048)/pMgtA or pVector following 300 min of growth. All experiments were carried out in MOPS medium containing 500 µM K2HPO4 and either 10 µM MgCl2 or the specified MgCl2 concentration. Error bars represent the standard deviations. Graphs are representative of at least three independent experiments with a total of at least six biological replicates. See also Supplemental Figure S2.
Figure 5.
Figure 5.
Free cytoplasmic Mg2+ inhibits Pi starvation response. (A) Fluorescence from wild-type (14028s), mgtA (EG16735), mgtB (EL5), and mgtA mgtB (EG17048) Salmonella harboring pPhoB-GFP. (B) Fluorescence from wild-type Salmonella (14028s) carrying pPstS-GFPc and pUHE-21 (pVector) and from mgtA mgtB mutant (EG17048) harboring pPstS-GFPc and either pUHE-21 (pVector) or pUHE-MgtA (pMgtA) in the presence of the indicated IPTG concentrations. (C) Fluorescence from wild-type Salmonella (14028s) carrying pPstS-GFPc and pVector and from mgtA mgtB mutant Salmonella (EG17048) harboring pPstS-GFPc and either pVector or pUHE-ATPase (pATPase) in the presence of the indicated IPTG concentrations. (D) Fluorescence from mgtA mgtB (EG17048) Salmonella harboring pPhoP-GFP and either pATPase or pVector in the presence of various IPTG concentrations. For all experiments, cells were grown in MOPS liquid medium containing 10 µM MgCl2 and 500 µM K2HPO4. Error bars represent the standard deviations. Graphs are representative of at least three independent experiments with a total of at least six biological replicates. See also Supplemental Figures S2 and S3.
Figure 6.
Figure 6.
Translation recycles intracellular Pi from ATP, preventing a Pi starvation response. (A) Intracellular ATP levels of wild-type Salmonella (14028s) lacking or harboring either pUHE-ATPase (pATPase) or pUHE-21 (pVector). (B) mRNA amounts of the phoB, pstS, and thrS genes produced by wild-type Salmonella (14028s) lacking or harboring either pATPase or pVector. (C) mRNA amounts of the pstS and thrS genes produced by wild-type (14028s) and phoB (EG9054) Salmonella. For AC, cells were grown in MOPS containing 10 mM MgCl2 and 2 mM K2HPO4 for 2 h followed by 30 min of treatment with 1 mM IPTG (when harboring pATPase or pVector) followed by 30 min of treatment with 25 µg/mL chloramphenicol. mRNA amounts were normalized to those of the ompA gene. (D) Western blot analysis of extracts prepared from wild-type (14028s) and phoB-HA (MP1429) Salmonella and phoB-HA (MP1429) Salmonella harboring either pATPase or pVector following separation on Phos-tag SDS-PAGE to detect PhoB-HA and PhoB-HA-P. Cells were grown in MOPS containing 10 mM MgCl2 and 200 µM K2HPO4 for 2 h and treated for 35 min with 1 mM IPTG followed by chloramphenicol as in AC. Error bars represent the standard deviations. Graphs are representative of at least three independent experiments with a total of at least six biological replicates. See also Supplemental Figures S3 and S4.
Figure 7.
Figure 7.
Free cytoplasmic Mg2+ inhibits Pi starvation response. (A) When neither Pi nor Mg2+ are limiting in the cytoplasm, extracellular Pi is imported via constitutive low-affinity high-capacity Pi transporters. Free intracellular Pi is sensed by components of the cellular machinery and incorporated into ATP. Pi from ATP is transferred to other biomolecules and assimilated into the cell or liberated back into the cytosol through ATP hydrolysis (e.g., the result of active ribosomes). (B) During Pi starvation, the intracellular concentration of free Pi decreases either because Pi is limited in the extracellular environment or because low free cytoplasmic Mg2+ levels compromise the function of cellular activities that recycle Pi from ATP (i.e., translation). (C) The cellular machinery senses a drop in free intracellular Pi, eliciting a Pi starvation response that is characterized, among other things, by the expression of high-affinity Pi transporters. See also Supplemental Figure S5.

References

    1. Aiba H, Adhya S, de Crombrugghe B. 1981. Evidence for two functional gal promoters in intact Escherichia coli cells. J Biol Chem 256: 11905–11910. - PubMed
    1. Andersen JB, Sternberg C, Poulsen LK, Bjorn SP, Givskov M, Molin S. 1998. New unstable variants of green fluorescent protein for studies of transient gene expression in bacteria. Appl Environ Microbiol 64: 2240–2246. - PMC - PubMed
    1. Askwith C, Eide D, Van Ho A, Bernard PS, Li L, Davis-Kaplan S, Sipe DM, Kaplan J. 1994. The FET3 gene of S. cerevisiae encodes a multicopper oxidase required for ferrous iron uptake. Cell 76: 403–410. - PubMed
    1. Auesukaree C, Homma T, Kaneko Y, Harashima S. 2003. Transcriptional regulation of phosphate-responsive genes in low-affinity phosphate-transporter-defective mutants in Saccharomyces cerevisiae. Biochem Biophys Res Commun 306: 843–850. - PubMed
    1. Auesukaree C, Homma T, Tochio H, Shirakawa M, Kaneko Y, Harashima S. 2004. Intracellular phosphate serves as a signal for the regulation of the PHO pathway in Saccharomyces cerevisiae. J Biol Chem 279: 17289–17294. - PubMed

Publication types

MeSH terms

LinkOut - more resources