. 2018 Sep 1;24(17):4175-4186.
doi: 10.1158/1078-0432.CCR-17-1846. Epub 2018 Feb 7.

T-Cell Exhaustion Signatures Vary with Tumor Type and Are Severe in Glioblastoma

Affiliations

T-Cell Exhaustion Signatures Vary with Tumor Type and Are Severe in Glioblastoma

Karolina Woroniecka et al. Clin Cancer Res. .

Abstract

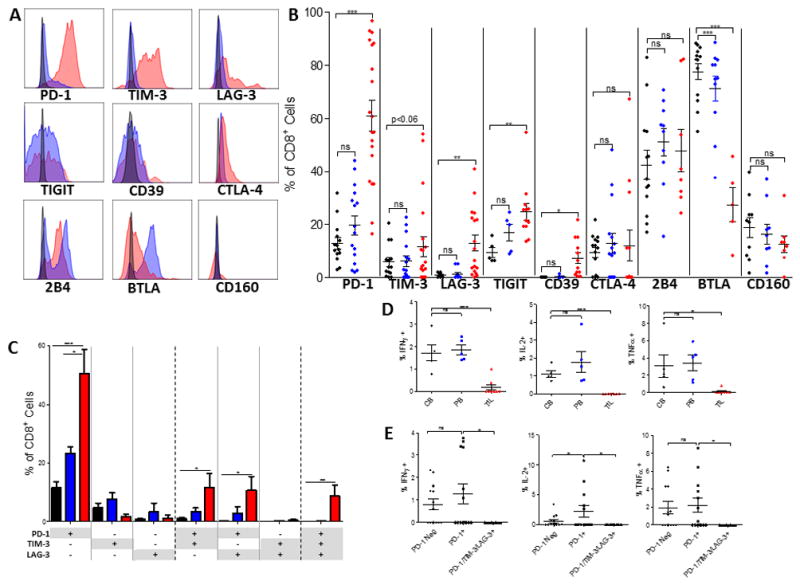
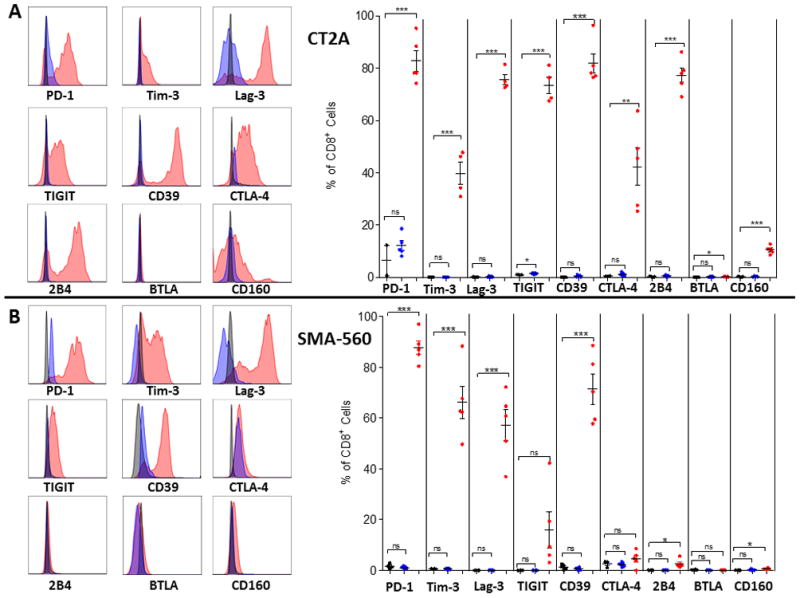
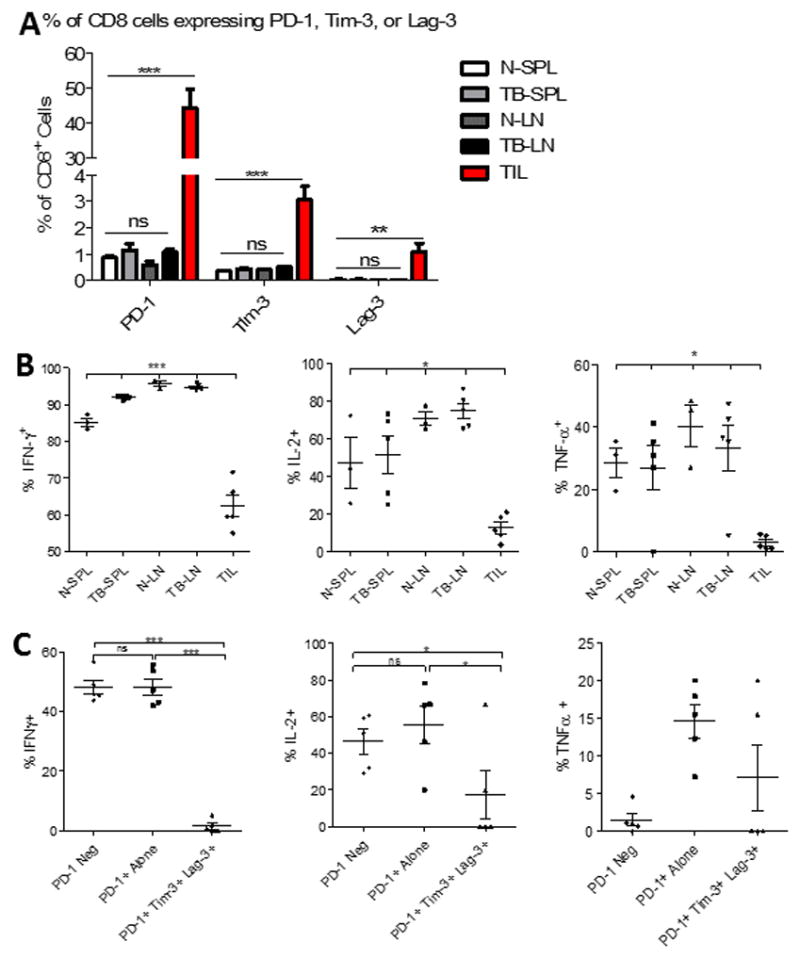
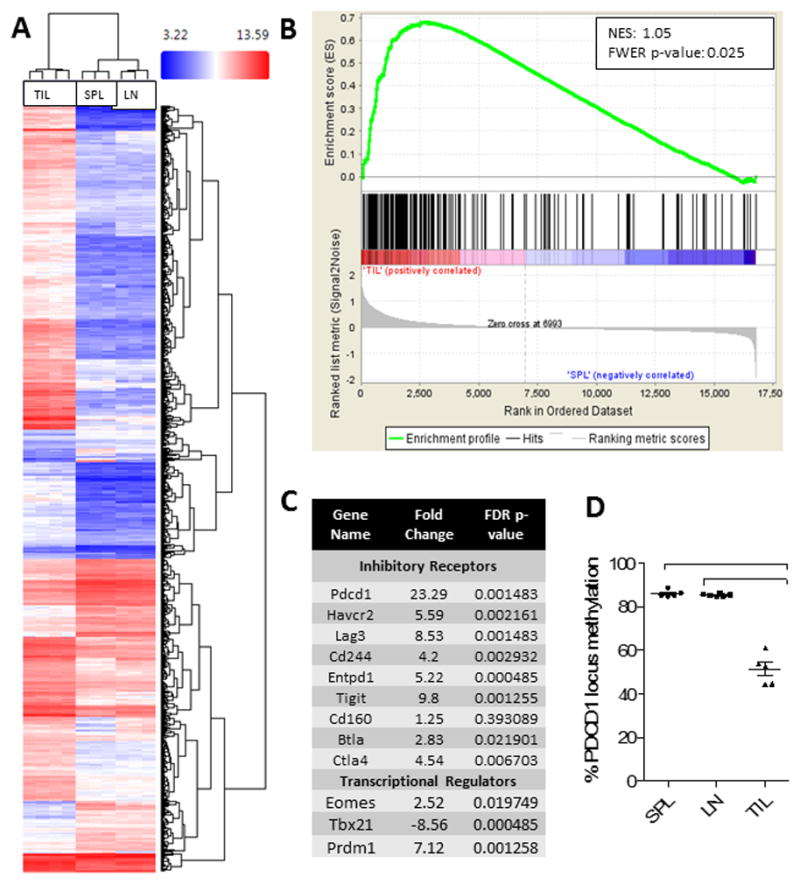
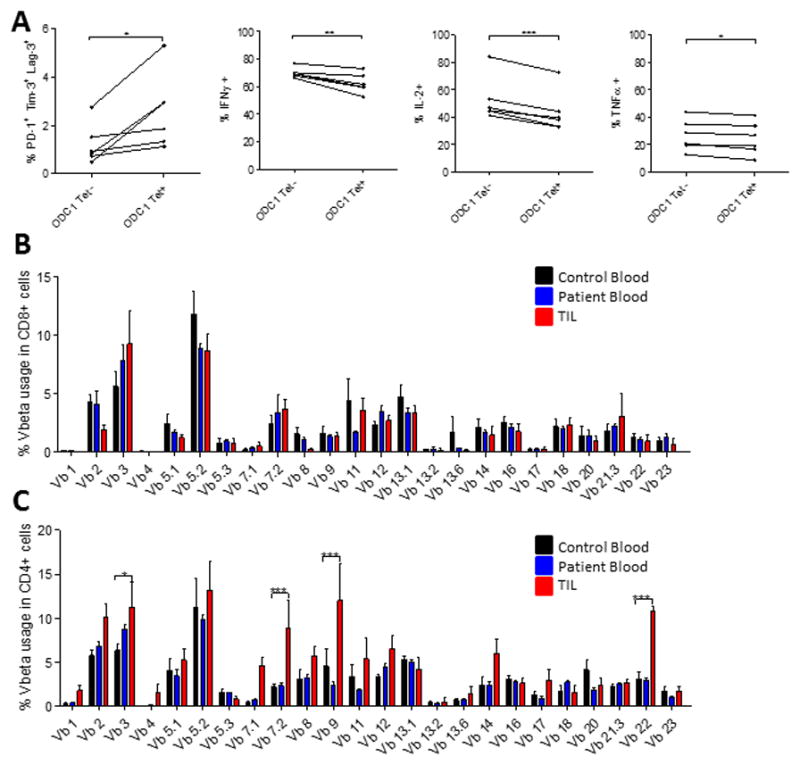
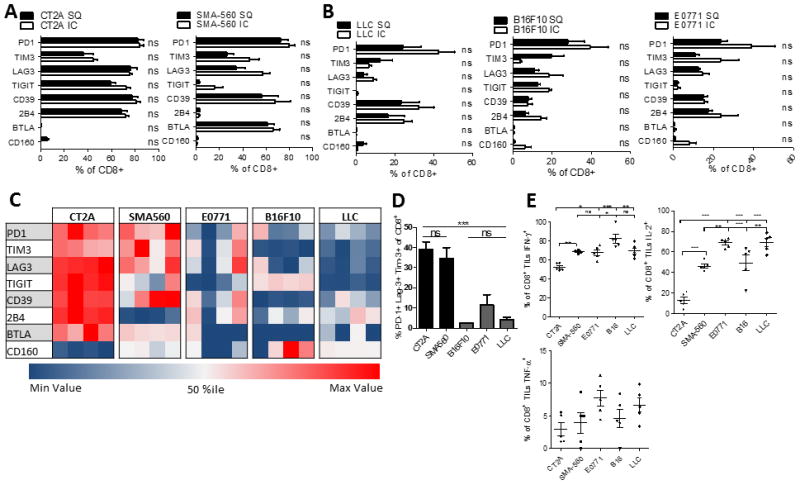
Purpose: T-cell dysfunction is a hallmark of glioblastoma (GBM). Although anergy and tolerance have been well characterized, T-cell exhaustion remains relatively unexplored. Exhaustion, characterized in part by the upregulation of multiple immune checkpoints, is a known contributor to failures amid immune checkpoint blockade, a strategy that has lacked success thus far in GBM. This study is among the first to examine, and credential as bona fide, exhaustion among T cells infiltrating human and murine GBM.Experimental Design: Tumor-infiltrating and peripheral blood lymphocytes (TILs and PBLs) were isolated from patients with GBM. Levels of exhaustion-associated inhibitory receptors and poststimulation levels of the cytokines IFNγ, TNFα, and IL2 were assessed by flow cytometry. T-cell receptor Vβ chain expansion was also assessed in TILs and PBLs. Similar analysis was extended to TILs isolated from intracranial and subcutaneous immunocompetent murine models of glioma, breast, lung, and melanoma cancers.Results: Our data reveal that GBM elicits a particularly severe T-cell exhaustion signature among infiltrating T cells characterized by: (1) prominent upregulation of multiple immune checkpoints; (2) stereotyped T-cell transcriptional programs matching classical virus-induced exhaustion; and (3) notable T-cell hyporesponsiveness in tumor-specific T cells. Exhaustion signatures differ predictably with tumor identity, but remain stable across manipulated tumor locations.Conclusions: Distinct cancers possess similarly distinct mechanisms for exhausting T cells. The poor TIL function and severe exhaustion observed in GBM highlight the need to better understand this tumor-imposed mode of T-cell dysfunction in order to formulate effective immunotherapeutic strategies targeting GBM. Clin Cancer Res; 24(17); 4175-86. ©2018 AACRSee related commentary by Jackson and Lim, p. 4059.


Conflict of interest statement

Conflicts of Interest: Glenn Dranoff is currently an employee and stock-holder at Novartis, Inc.

Figures

Figure 1
Figure 1. Elevated expression of checkpoint molecules and decreased cytokine production among TIL in human GBM
A. Representative histograms of checkpoint molecule expression on CD8+ T cells where red represents patient TIL, blue represents patient blood, and black represents relevant isotype control. CTLA-4 is an intracellular stain. B. Frequency of checkpoint molecule expression on CD8+ T cells isolated from TIL (PD-1, TIM-3 n=20; LAG-3 n=18; CTLA-4 n=13; CD39, TIGIT n=12; CD160, 2B4 n=8; BTLA n=5), patient blood (PD-1, TIM-3 n=16; CTLA-4 n=15; 2B4, BTLA n=11; LAG-3 n=12; CD160 n=9; TIGIT, CD39 n=5), or control blood (PD-1, TIM-3, CTLA-4 n=14; LAG-3 n=10; 2B4, BTLA n=13; CD160 n=10; TIGIT, CD39 n=5). C. Boolean gating was performed on CD8+ T cells isolated from control and patient blood and patient tumors to determine co-expression of PD-1, TIM-3, and LAG-3. Sample numbers: control blood (n=9), patient blood (n=6), and patient TIL (n=5). Bar graphs represent mean +/− SEM. D. Post-stimulation with PMA/Ionomycin intracellular staining was performed on patient TIL, blood and control blood for IFN-γ, IL-2, and TNF-α. E. Boolean gating was employed to determine percentage of cells producing cytokines among T cells not expressing PD-1, PD-1 single positive, or PD-1/TIM-3/LAG-3 triple positive cells. B–D: red represents patient TIL, blue represents patient blood, and black represents control blood. Throughout figure *p<0.05; **p<0.01; ***p<0.0001 by unpaired t-test between control and patient samples.
Figure 2
Figure 2. Expression of multiple checkpoint molecules among TIL in CT2A and SMA-560 murine glioma models
Tumors and blood were harvested when mice were moribund at day 21 post intracranial tumor implantation (n=5) for CT2A (A) or SMA-560 (B) tumor models. Representative histograms of checkpoint molecule expression on CD8+ T cells are shown where red represents TIL, blue represents tumor-bearing blood, and black represents relevant isotype control. For graphs, red represents TIL, blue represents tumor-bearing blood, and black represents naïve blood. Significance was determined using unpaired t-test between control and tumor-bearing samples. *p<0.05; ***p<.001.
Figure 3
Figure 3. TIL isolated from murine gliomas demonstrate impaired function
A. The percentage of CD8+ T cells expressing either PD-1, Tim-3, or Lag-3 alone was compared across immunologic compartments. T cells were isolated from the spleens (SPL) and cervical lymph nodes (LN) from either CT2A tumor-bearing (TB) (n=5) or naïve (N) (n=3) mice, as well as from tumors of TB mice (TIL). B. The capacity for CD8+ T cells isolated from the same sites to express IFN-γ, IL-2, and TNF-α, upon stimulation with PMA/ionomycin was compared. C. Boolean gating was employed to determine percentage of cells producing cytokines among TIL not expressing PD-1, PD-1 single positive, or PD-1/TIM-3/LAG-3 triple positive cells. Statistical significance was assessed via unpaired t-test between control and tumor-bearing samples. *p<0.05; **p<0.01; ***p<0.0001 throughout figure.
Figure 4
Figure 4. TIL demonstrate molecular signatures and epigenetic profiles consistent with T cell exhaustion
A. A hierarchical cluster of gene expression of CD8+ T cells isolated from tumors (TIL), spleens (SPL), or tumor-draining cervical lymph nodes (LN). Microarray analysis was performed using the Affymetrix Clariom S Array Platform and clustering was performed on the 1071 genes which were screened from 22701 total. Comparisons were made via ANOVA; p-value <0.001 and FDR p-value <0.001 (all conditions). B. Gene Set Enrichment Analysis (GSEA) was performed with the software GSEA v2.2.3 downloaded from the Broad Institute. Gene sets assessed included GSE30962, publically available through the NCBI on Gene Expression Omnibus. NES = normalized enrichment score. C. Table demonstrating representative transcripts over- or under-represented in TIL compared to SPL. D. Analysis of methylation at the PD-1 promoter (Pdcd1) in CD8+ T cells from TIL, SPL, or LN via ANOVA with repeated measures followed by Bonferroni post-test ***p<0.0001.
Figure 5
Figure 5. T cell exhaustion arises preferentially amongst tumor-specific T cells
A. 5 mice were implanted with SMA-560 tumors IC. Tumors were harvested when mice were moribund and TIL isolated. TIL were stimulated with the ODC-1 peptide for 6 hours, stained with the ODC-1 tetramer conjugated to APC, several immune checkpoints and intracellular stain for cytokines was performed. Significance was assessed via paired t-test between tetramer positive and negative cells. Vbeta analysis was performed on CD8+ (B) and CD4+ (C) T cells isolated from human GBM TIL (n=5), patient blood (n=5), or control blood (n=5). Significance was assessed using a two-way ANOVA to assess for interaction between Vb and sample type, followed by Bonferroni post-tests between patient and control samples. *p<0.05; **p<0.01; ***p<0.001.
Figure 6
Figure 6. T cell exhaustion signatures reflect tumor histology rather than intracranial location and are particularly severe among malignant glioma
A. The percentage of CD8+ T cells expressing immune checkpoints within either intracranial (IC) or subcutaneous (SC) CT2A and SMA-560 glioma models. TIL were isolated when mice bearing IC tumors (n=5) were moribund or when SC tumors (n=5) reached 20mm at the largest diameter. B. The percentage of CD8+ T cells expressing various immune checkpoints among IC or SC B16F10 (melanoma), E0771 (breast) and LLC (lung). C. Heat map representing the % of CD8+ TIL expressing immune checkpoints across five different models of IC malignancies (n=4). Each row represents one immune checkpoint with associated percentiles. Each column represents an individual mouse. D. The percentage of CD8+ TIL co-expressing PD-1, Tim-3, and Lag-3 across five different models of intracranial malignancies. Differences were assessed via one-way ANOVA with Tukey’s post hoc test. E. The percentage of CD8+ TIL staining for IFN-γ, IL-2, and TNF-α. *p<0.05; **p<0.01; ***p<0.0001.

References

    1. Stupp R, Hegi ME, Mason WP, van den Bent MJ, Taphoorn MJ, Janzer RC, et al. Effects of radiotherapy with concomitant and adjuvant temozolomide versus radiotherapy alone on survival in glioblastoma in a randomised phase III study: 5-year analysis of the EORTC-NCIC trial. Lancet Oncol. 2009;10(5):459–66. doi: 10.1016/S1470-2045(09)70025-7. - DOI - PubMed
    1. Patel AP, Tirosh I, Trombetta JJ, Shalek AK, Gillespie SM, Wakimoto H, et al. Single-cell RNA-seq highlights intratumoral heterogeneity in primary glioblastoma. Science. 2014;344(6190):1396–401. doi: 10.1126/science.1254257. - DOI - PMC - PubMed
    1. Kmiecik J, Poli A, Brons NH, Waha A, Eide GE, Enger PO, et al. Elevated CD3+ and CD8+ tumor-infiltrating immune cells correlate with prolonged survival in glioblastoma patients despite integrated immunosuppressive mechanisms in the tumor microenvironment and at the systemic level. Journal of neuroimmunology. 2013;264(1–2):71–83. doi: 10.1016/j.jneuroim.2013.08.013. - DOI - PubMed
    1. Dix AR, Brooks WH, Roszman TL, Morford LA. Immune defects observed in patients with primary malignant brain tumors. Journal of neuroimmunology. 1999;100(1–2):216–32. - PubMed
    1. Dunn GP, Fecci PE, Curry WT. Cancer immunoediting in malignant glioma. Neurosurgery. 2012;71(2):201–22. doi: 10.1227/NEU.0b013e31824f840d. discussion 22–3. - DOI - PubMed

Publication types

MeSH terms