. 2018 Apr;17(4):858-868.
doi: 10.1158/1535-7163.MCT-17-0965. Epub 2018 Feb 7.

Characterizing the Potency and Impact of Carbon Ion Therapy in a Primary Mouse Model of Soft Tissue Sarcoma

Affiliations

Characterizing the Potency and Impact of Carbon Ion Therapy in a Primary Mouse Model of Soft Tissue Sarcoma

Jeremy M Brownstein et al. Mol Cancer Ther. 2018 Apr.

Abstract

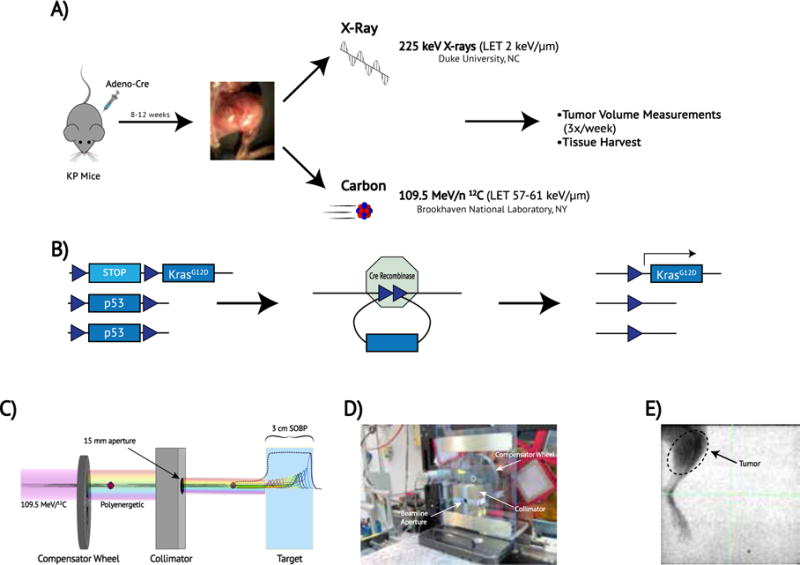
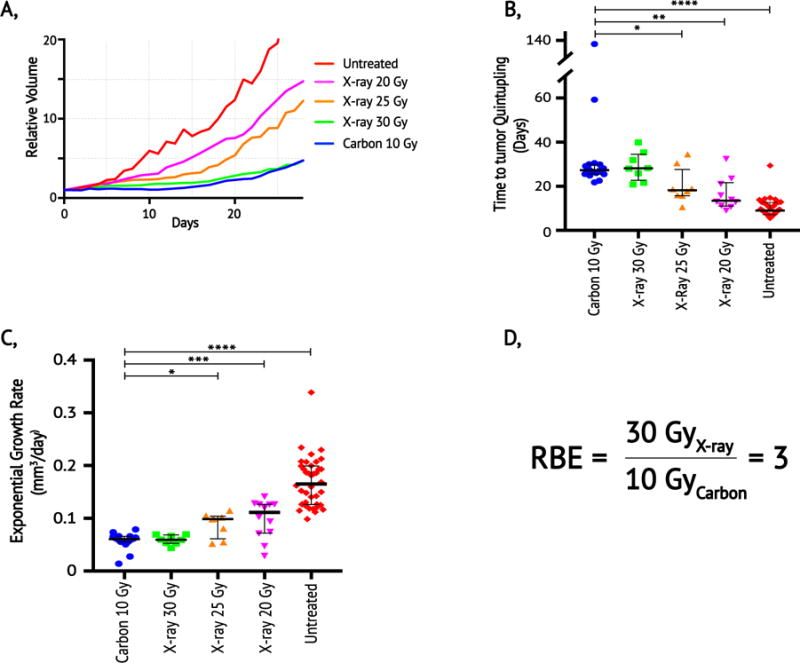
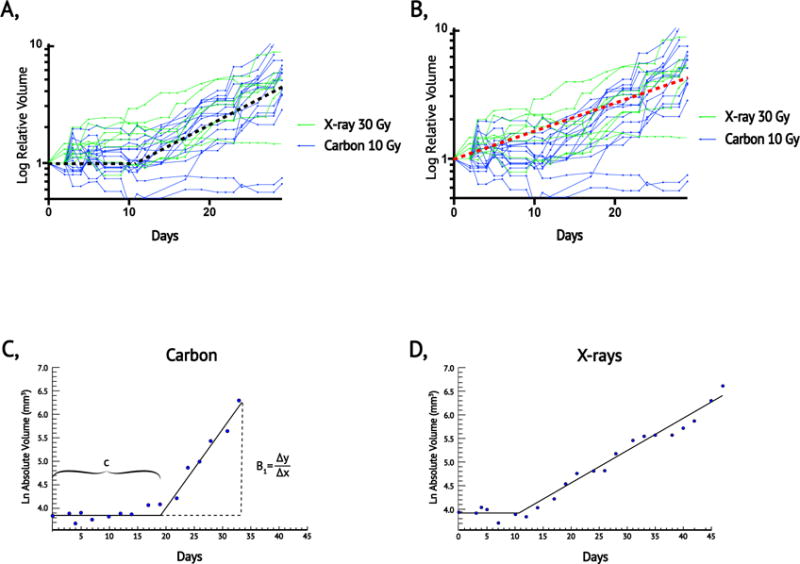
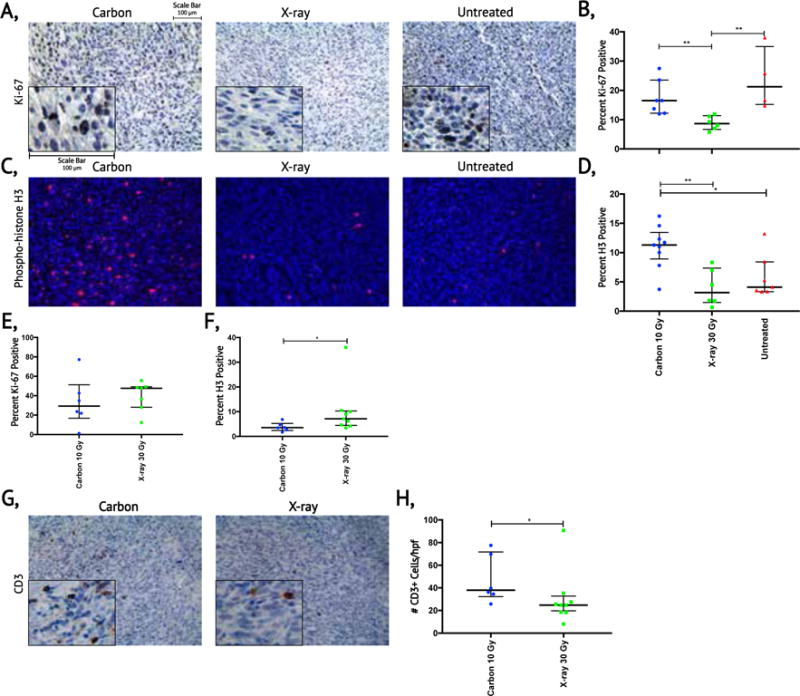
Carbon ion therapy (CIT) offers several potential advantages for treating cancers compared with X-ray and proton radiotherapy, including increased biological efficacy and more conformal dosimetry. However, CIT potency has not been characterized in primary tumor animal models. Here, we calculate the relative biological effectiveness (RBE) of carbon ions compared with X-rays in an autochthonous mouse model of soft tissue sarcoma. We used Cre/loxP technology to generate primary sarcomas in KrasLSL-G12D/+; p53fl/fl mice. Primary tumors were irradiated with a single fraction of carbon ions (10 Gy), X-rays (20 Gy, 25 Gy, or 30 Gy), or observed as controls. The RBE was calculated by determining the dose of X-rays that resulted in similar time to posttreatment tumor volume quintupling and exponential growth rate as 10 Gy carbon ions. The median tumor volume quintupling time and exponential growth rate of sarcomas treated with 10 Gy carbon ions and 30 Gy X-rays were similar: 27.3 and 28.1 days and 0.060 and 0.059 mm3/day, respectively. Tumors treated with lower doses of X-rays had faster regrowth. Thus, the RBE of carbon ions in this primary tumor model is 3. When isoeffective treatments of carbon ions and X-rays were compared, we observed significant differences in tumor growth kinetics, proliferative indices, and immune infiltrates. We found that carbon ions were three times as potent as X-rays in this aggressive tumor model and identified unanticipated differences in radiation response that may have clinical implications. Mol Cancer Ther; 17(4); 858-68. ©2018 AACR.


Conflict of interest statement

The authors declare no potential conflicts of interest.

Figures

Figure 1
Figure 1. Schematic of the experimental design and radiation therapy treatments
(a) Schematic of the experimental design. Mice with conditional mutations in oncogenic Kras and p53 (LSL-KrasG12D;p53fl/fl or KP) were inoculated with adenovirus expressing Cre recombinase via direct injection into muscle of the hind-limb, thus generating primary sarcomas. Mice were either treated with X-rays at Duke or were transported to Brookhaven National Laboratory for Carbon Ion Therapy (b) Cre recombinase recombines LoxP sites (blue triangles) in LSL-KrasG12D; p53fl/fl (KP) mice, selectively deleting p53 and activating the expression of mutant Kras by deleting the transcription stop cassette. (c) Schematic of carbon ion radiation delivery. A mono-energetic carbon ion beam passes through a spinning variable-depth compensator wheel and is shaped by a copper collimator. The resulting poly-energetic beam produces many Bragg peaks that span the breadth of the target (colored lines) and effectively sum to create a spread-out Bragg peak (SOBP) (black line). (d) Carbon ion experimental setup at NSRL. The compensator wheel and collimator are arranged within the beamline. (e) Image-guided X-ray radiotherapy. Pre-treatment fluoroscopic imaging depicts a 40 × 40 mm square field encompassing the sarcoma-bearing leg and excludes the remainder of the mouse. Tick marks = 2 mm.
Figure 2
Figure 2. Carbon ion Spread out Bragg peak, predictions and measurements
(a) The spinning acrylonitrile butadiene styrene compensator wheel was expected to produce a poly-energetic carbon beam with a 3-cm constant physical dose SOBP (magenta) comprised of 30 individual Bragg peaks (black lines). Dose rate is represented as a function of depth and is normalized to entrance dose rate of mono-energetic 109.5 MeV/12C beam = 1. (b) Monte Carol simulations (blue) and ion chamber dose rate measurements (black-dashed) of the SOBP confirmed a constant physical dose distribution within the target in the proximal SOBP. (c) Monte Carlo simulated dose-weighted LET (orange) is 59-63 keV/μm throughout the proximal SOBP (blue).
Figure 3
Figure 3. Response of primary sarcomas to carbon ions and X-rays and Relative Biological Effectiveness
(a) Mean relative tumor volumes as a function of days after treatment in untreated controls (red, n=38), and mice treated with single fractions of 20 Gy X-ray (purple, n=12), 25 Gy X-ray (orange, n=8), 30 Gy X-ray (green, n=8), and 10 Gy Carbon (blue, n=16). Volumes are normalized to volume on day of treatment in irradiated mice and the first measured volume > 40 mm3 for untreated controls. (b) Data from panel (a) represented as number of days for tumor volume quintupling from the initial day of treatment. (c) Data from panel (a) represented as the exponential growth rate for sarcomas in each treatment group. (d) RBE is defined as the dose of X-rays divided by the dose of particle radiation required to produce the same biological result. Because 30 Gy X-rays and 10 Gy carbon ions have similar time to tumor quintupling and exponential growth rates, the RBE of carbon ions for these endpoints in primary sarcomas is 3. Median values (thick black lines) and interquartile range (IQR) (thin black error bars) shown; statistical significance evaluated with Mann Whitney U test. * p< 0.05, ** p<0.01, *** p<0.001, **** p<0.0001
Figure 4
Figure 4. Comparison of relative growth after 10 Gy carbon ions and 30 Gy X-rays using piecewise exponential and simple exponential regression models
(a) Log relative volume as a function of time following treatment for individual tumors after 10 Gy carbon (blue) or 30 Gy X-rays (green) with a graphical representation of a piecewise exponential model (black dashed line). (b) Volume data described in (a) with a graphical representation of a simple exponential model (red dashed lined). Note that the piecewise model characterizes the period of post-treatment stasis and the rate of regrowth better than the simple exponential model. (c) Example of an individual sarcoma evaluated with the piecewise exponential model after 10 Gy carbon ion radiation therapy. (d) Example of an individual sarcoma evaluated with the piecewise exponential model after 30 Gy X-rays radiation therapy. For details of the piecewise exponential model, please refer to equation 2.
Figure 5
Figure 5. Assessment of tumor cell proliferation and T-cell infiltration after carbon ion or X-ray radiotherapy
(a) Evaluation of proliferation by Ki-67 immunohistochemistry in sarcomas treated with 10 Gy carbon ions, 30 Gy X-rays, and untreated sarcomas when tumor volume approached the limit of the IACUC protocol. (b) Quantification of Ki-67 staining for sarcomas that reached the experimental endpoint in each treatment group. (c) Evaluation tumor cells in G2 and mitosis by immunofluorescence of phospho-histone H3 in sarcomas treated with 10 Gy carbon ions, 30 Gy X-rays and untreated sarcomas when tumor volume approached the limit of the IACUC protocol. (d) Quantification of phospho-histone H3 staining for sarcomas that reached the experimental endpoint in each treatment group. (e) Quantification of Ki-67 staining for sarcomas at 24 or 48 hours after 10 Gy carbon ions and 30 Gy X-raysΔ. (f) Quantification of phospho-histone H3 staining for sarcomas at 24 or 48 hours after 10 Gy carbon ions and 30 Gy X-raysΔ. (g) Evaluation of T-cell infiltration in sarcomas proliferation by CD3 immunohistochemistry at 24 or 48 hours after 10 Gy carbon ions and 30 Gy X-rays. (h) Quantification of infiltrating T-cells in sarcomas at 24 or 48 hours after 10 Gy carbon ions and 30 Gy X-raysΔ. Median values (thick black lines) and IQR (thin black error bars) shown; statistical significance evaluated with Mann Whitney U test. *p< 0.05, **p<0.01. Δ refer to Supplementary Figure 2 for breakdown of 24 and 48 hours. Scale bar = 100 microns.

References

    1. Howlader NNA, Krapcho M, Miller D, Bishop K, Kosary CL, Yu M, Ruhl J, Tatalovich Z, Mariotto A, Lewis DR, Chen HS, Feuer EJ, Cronin KA, editors. SEER Cancer Statistics Review, 1975–2014. National Cancer Institute; Bethesda, MD: 2016. Novermber 2016 ed.
    1. Page BR, Hudson AD, Brown DW, Shulman AC, Abdel-Wahab M, Fisher BJ, et al. Cobalt, linac, or other: what is the best solution for radiation therapy in developing countries? Int J Radiat Oncol Biol Phys. 2014;89:476–80. - PubMed
    1. Mohan R, Grosshans D. Proton therapy - Present and future. Advanced drug delivery reviews. 2017;109:26–44. - PMC - PubMed
    1. Wang X, Krishnan S, Zhang X, Dong L, Briere T, Crane CH, et al. Proton radiotherapy for liver tumors: dosimetric advantages over photon plans. Medical dosimetry: official journal of the American Association of Medical Dosimetrists. 2008;33:259–67. - PubMed
    1. Glimelius B, Isacsson U, Blomquist E, Grusell E, Jung B, Montelius A. Potential gains using high-energy protons for therapy of malignant tumours. Acta Oncol. 1999;38:137–45. - PubMed

Publication types