

Adjustments to Photosystem Stoichiometry and Electron Transfer Proteins Are Key to the Remarkably Fast Growth of the Cyanobacterium Synechococcus elongatus UTEX 2973
- PMID: 29437923
- PMCID: PMC5801466
- DOI: 10.1128/mBio.02327-17
Adjustments to Photosystem Stoichiometry and Electron Transfer Proteins Are Key to the Remarkably Fast Growth of the Cyanobacterium Synechococcus elongatus UTEX 2973
Abstract
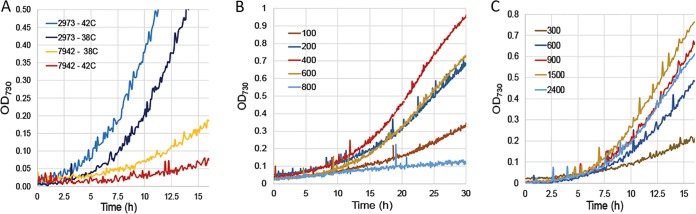
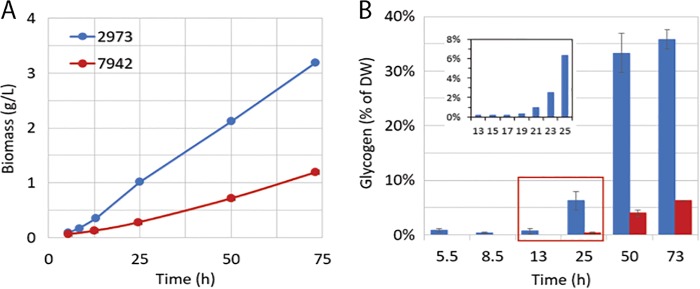
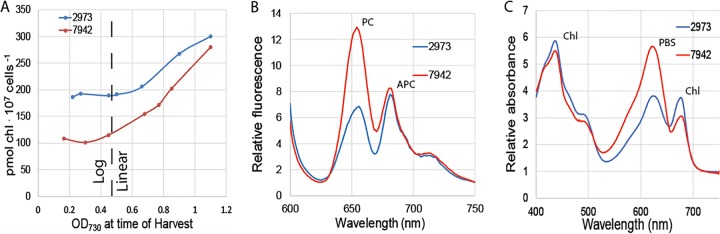
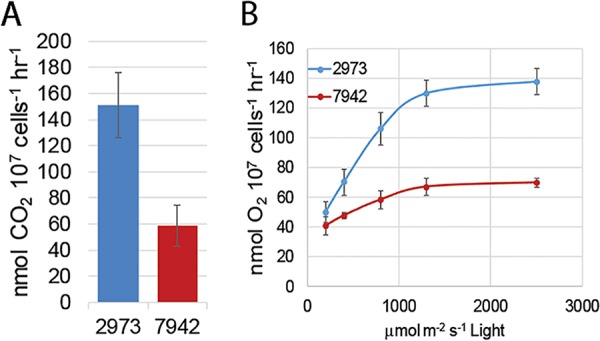
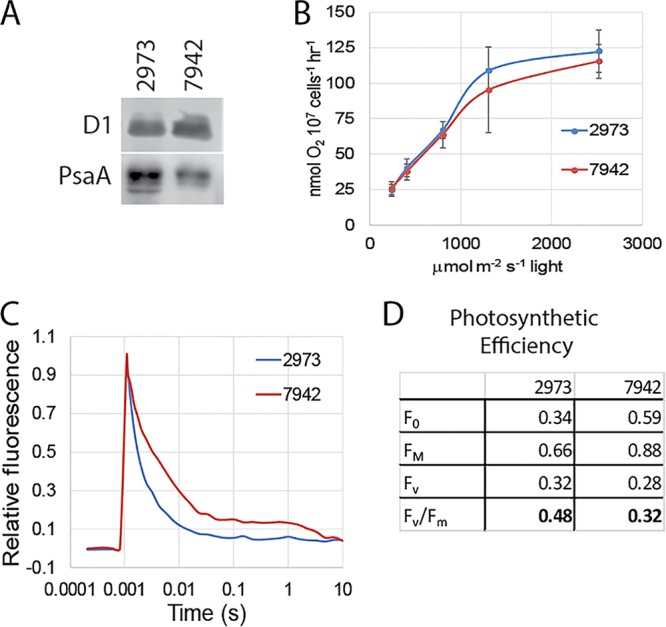
At the genome level, Synechococcus elongatus UTEX 2973 (Synechococcus 2973) is nearly identical to the model cyanobacterium Synechococcus elongatus PCC 7942 (Synechococcus 7942) with only 55 single nucleotide differences separating the two strains. Despite the high similarity between the two strains, Synechococcus 2973 grows three times faster, accumulates significantly more glycogen, is tolerant to extremely high light intensities, and displays higher photosynthetic rates. The high homology between the two strains provides a unique opportunity to examine the factors that lead to increased photosynthetic rates. We compared the photophysiology of the two strains and determined the differences in Synechococcus 2973 that lead to increased photosynthetic rates and the concomitant increase in biomass production. In this study, we identified inefficiencies in the electron transport chain of Synechococcus 7942 that have been alleviated in Synechococcus 2973. Photosystem II (PSII) capacity is the same in both strains. However, Synechococcus 2973 exhibits a 1.6-fold increase in PSI content, a 1.5-fold increase in cytochrome b6f content, and a 2.4-fold increase in plastocyanin content on a per cell basis. The increased content of electron carriers allows a higher flux of electrons through the photosynthetic electron transport chain, while the increased PSI content provides more oxidizing power to maintain upstream carriers ready to accept electrons. These changes serve to increase the photosynthetic efficiency of Synechococcus 2973, the fastest growing cyanobacterium known.IMPORTANCE As the global population increases, the amount of arable land continues to decrease. To prevent a looming food crisis, crop productivity per acre must increase. A promising target for improving crop productivity is increasing the photosynthetic rates in crop plants. Cyanobacteria serve as models for higher plant photosynthetic systems and are an important test bed for improvements in photosynthetic productivity. In this study, we identified key factors that lead to improved photosynthetic efficiency and increased production of biomass of a cyanobacterium. We suggest that the findings presented herein will give direction to improvements that may be made in other photosynthetic organisms to improve photosynthetic efficiency.
Keywords: Synechococcus; cyanobacteria; electron transport; photosynthesis.
Copyright © 2018 Ungerer et al.
Figures
References
-
- Porra RJ, Thompson WA, Kriedemann PE. 1989. Determination of accurate extinction coefficients and simultaneous equations for assaying chlorophylls a and b extracted with four different solvents: verification of the concentration of chlorophyll standards by atomic absorption spectroscopy. Biochim Biophys Acta 975:384–394. doi: 10.1016/S0005-2728(89)80347-0. - DOI
-
- Kalaji HM, Schansker G, Ladle RJ, Goltsev V, Bosa K, Allakhverdiev SI, Brestic M, Bussotti F, Calatayud A, Dąbrowski P, Elsheery NI, Ferroni L, Guidi L, Hogewoning SW, Jajoo A, Misra AN, Nebauer SG, Pancaldi S, Penella C, Poli D, Pollastrini M, Romanowska-Duda ZB, Rutkowska B, Serôdio J, Suresh K, Szulc W, Tambussi E, Yanniccari M, Zivcak M. 2014. Frequently asked questions about in vivo chlorophyll fluorescence: practical issues. Photosynth Res 122:121–158. doi: 10.1007/s11120-014-0024-6. - DOI - PMC - PubMed
-
- Kromkamp J, Barranguet C, Peene J. 1998. Determination of microphytobenthos PSII quantum efficiency and photosynthetic activity by means of variable chlorophyll fluorescence. Mar Ecol Prog Ser 162:45–55. doi: 10.3354/meps162045. - DOI
Publication types
MeSH terms
Substances
LinkOut - more resources
Full Text Sources
Other Literature Sources
Molecular Biology Databases
Research Materials
