. 2018 Feb 20;115(8):E1896-E1905.
doi: 10.1073/pnas.1800165115. Epub 2018 Feb 7.

Normal aging induces A1-like astrocyte reactivity

Affiliations

Normal aging induces A1-like astrocyte reactivity

Laura E Clarke et al. Proc Natl Acad Sci U S A. .

Abstract

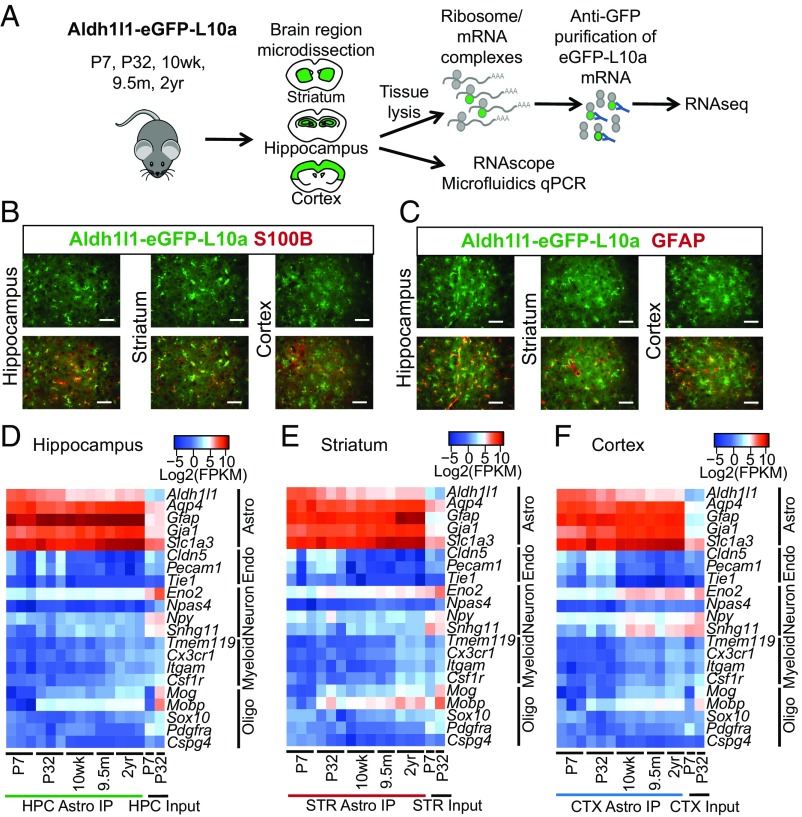
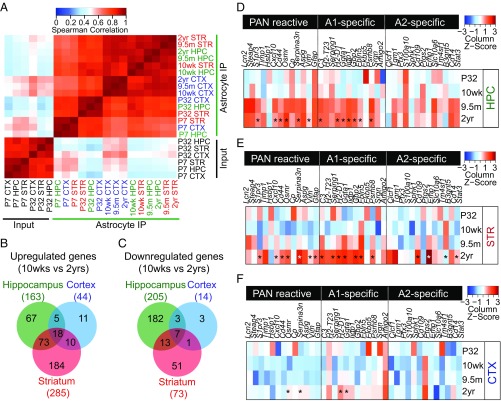
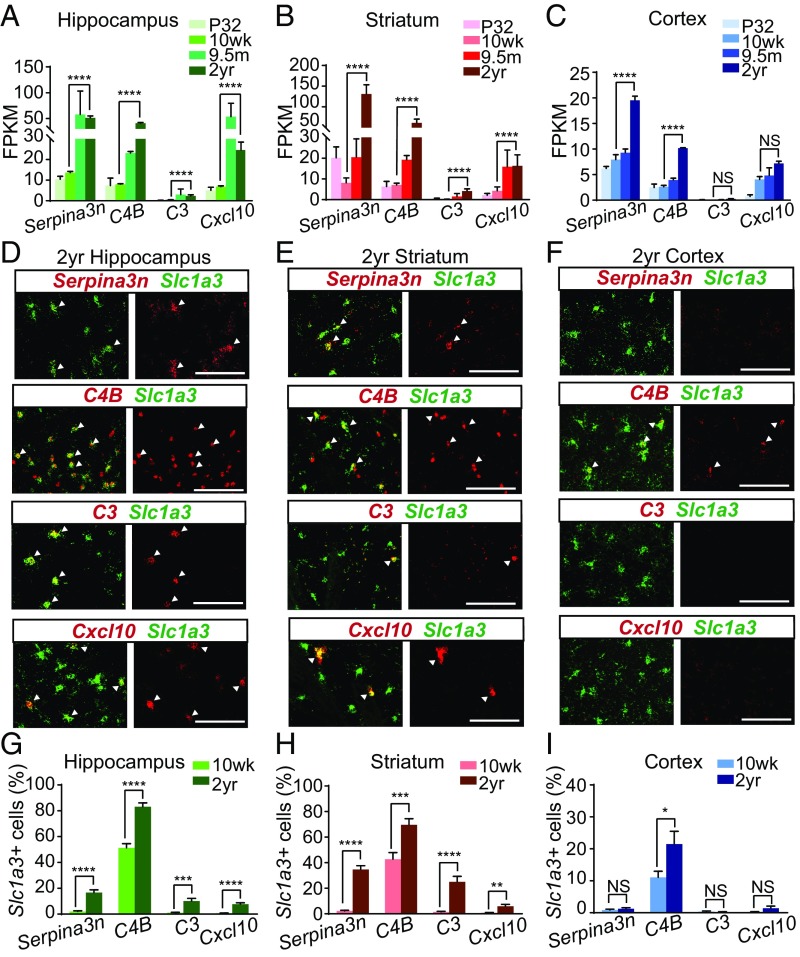
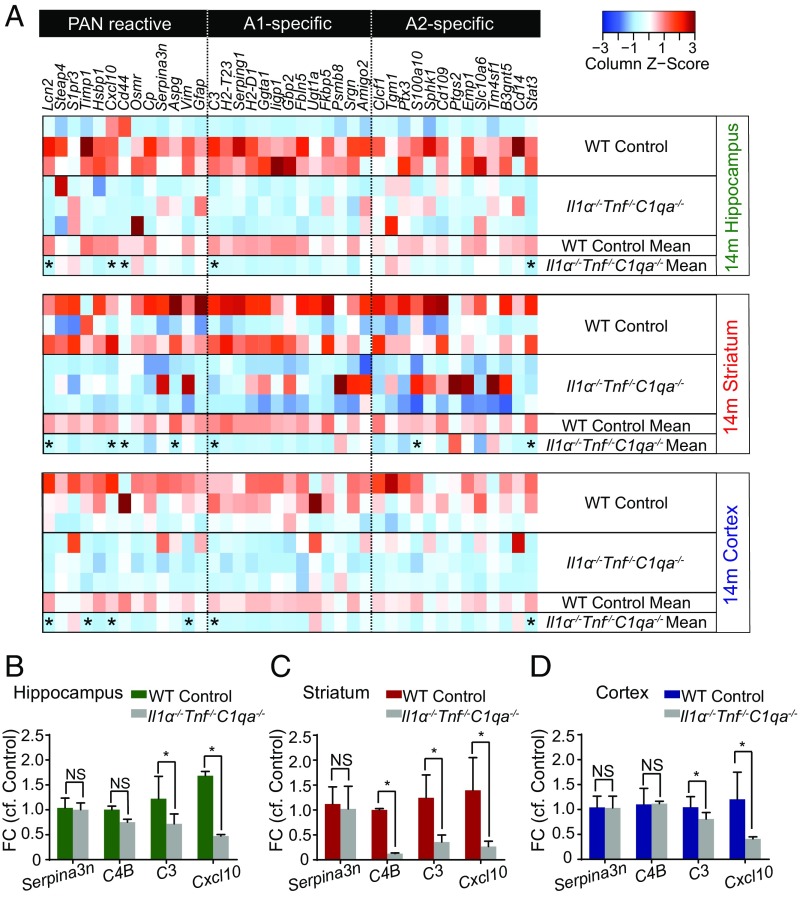
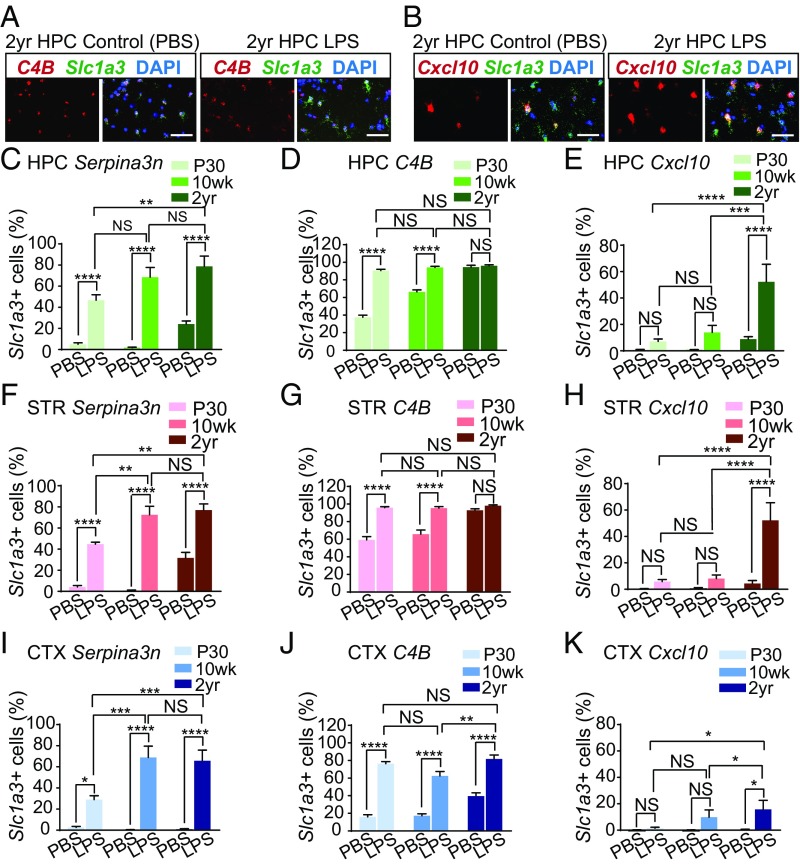
The decline of cognitive function occurs with aging, but the mechanisms responsible are unknown. Astrocytes instruct the formation, maturation, and elimination of synapses, and impairment of these functions has been implicated in many diseases. These findings raise the question of whether astrocyte dysfunction could contribute to cognitive decline in aging. We used the Bac-Trap method to perform RNA sequencing of astrocytes from different brain regions across the lifespan of the mouse. We found that astrocytes have region-specific transcriptional identities that change with age in a region-dependent manner. We validated our findings using fluorescence in situ hybridization and quantitative PCR. Detailed analysis of the differentially expressed genes in aging revealed that aged astrocytes take on a reactive phenotype of neuroinflammatory A1-like reactive astrocytes. Hippocampal and striatal astrocytes up-regulated a greater number of reactive astrocyte genes compared with cortical astrocytes. Moreover, aged brains formed many more A1 reactive astrocytes in response to the neuroinflammation inducer lipopolysaccharide. We found that the aging-induced up-regulation of reactive astrocyte genes was significantly reduced in mice lacking the microglial-secreted cytokines (IL-1α, TNF, and C1q) known to induce A1 reactive astrocyte formation, indicating that microglia promote astrocyte activation in aging. Since A1 reactive astrocytes lose the ability to carry out their normal functions, produce complement components, and release a toxic factor which kills neurons and oligodendrocytes, the aging-induced up-regulation of reactive genes by astrocytes could contribute to the cognitive decline in vulnerable brain regions in normal aging and contribute to the greater vulnerability of the aged brain to injury.

Keywords: RNA sequencing; aging; astrocytes; cognitive decline; microglia.


Conflict of interest statement

Conflict of interest statement: B.A.B. was a cofounder of Annexon Biosciences Inc., a company working to make new drugs for treatment of neurological diseases.

Figures

Fig. 1.
Fig. 1.
Isolation and validation of the aging astrocyte transcriptome from distinct brain regions. (A) Schematic diagram showing the experimental strategy for isolation of astrocyte RNA by TRAP across the lifespan of the mouse, and validation of differentially expressed aging genes. (B and C) Representative images of astrocytes from the hippocampus, striatum, and cortex in an adult (10 wk old) Aldh1l1-eGFP-L10a mouse showing costaining for (B) S100β and (C) GFAP. (Scale bar, 50 µm.) (DF) Cell purity heatmaps depicting mean FPKM expression values for cell-type−specific markers of astrocytes, neurons, oligodendrocyte lineage cells (oligo), endothelial cells (endo), and microglia/macrophages (myeloid) in (D) hippocampal, (E) striatal, and (F) cortical astrocyte and input samples. CTX, cortex; HPC, hippocampus; IP, immunoprecipitation; STR, striatum. See also Datasets S1–S4.
Fig. 2.
Fig. 2.
Differential gene expression analysis in aging astrocytes from distinct brain regions. (A) Heatmap of Spearman correlation between astrocytes (P7, P32, 10 wk, 9.5 mo, and 2 y) and input samples for three brain regions (hippocampus, striatum, and cortex). Data are mean FPKM values for genes expressed FPKM ≥ 5. (B and C) Venn diagrams showing the number of significantly (P < 0.05) (B) up-regulated and (C) down-regulated genes, determined by edgeR analysis, between mature adult (10 wk) and aged (2 y old) astrocyte samples from the hippocampus, striatum, and cortex. Numbers listed on the outside of the charts represent the total number of up-regulated genes in each brain region [hippocampus (green), striatum (red), and cortex (blue)]. Diagrams are adapted from jvenn (54). (DF) Heatmaps comparing the mean expression of pan-reactive (genes induced by neuroinflammation or ischemia), A1-specific (genes induced by neuroinflammation), and A2-specfic (genes induced by ischemia) transcripts in TRAP astrocyte RNA samples isolated from the (D) hippocampus, (E) striatum, and (F) cortex of P32, 10-wk-, 9.5-mo-, and 2-y-old mice. Asterisks (*) denote significantly (P < 0.05) increased expression in 2-y-old samples compared with 10 wk by edgeR analysis. See also Figs. S1 and S2 and Datasets S1–S3.
Fig. 3.
Fig. 3.
Validation of aging-induced reactive genes by in situ hybridization. (AC) Bar plots of RNAseq data showing FPKM expression of four aging-induced genes (Serpina3n, C4B, C3, and Cxcl10) in astrocyte samples across the mouse lifespan in the (A) hippocampus, (B) striatum, and (C) cortex. Error bars depict mean ± SEM. ****P < 0.0001 for values compared between 10-wk- and 2-y-old astrocyte samples by edgeR analysis. (DF) Representative in situ hybridization images for four aging-induced astrocyte genes (Serpina3n, C4B, C3, and Cxcl10) showing colocalization with the astrocyte marker Slc1a3 in aged mice (2 y) in the (D) hippocampus, (E) striatum, and (F) cortex. (Scale bar, 100 µm.) White arrowheads highlight Slc1a3+ astrocytes expressing reactive genes. (GI) Bar charts depicting quantification of the number of Slc1a3+ astrocytes expressing detectable levels of Serpina3n, C4B, C3, and Cxcl10 mRNA in the mature adult (10 wk) and aged (2 y old) (G) hippocampus, (H) striatum, and (I) cortex. Error bars depict mean ± SEM. ****P < 0.0001; ***P < 0.001; **P < 0.01; *P < 0.05. NS, nonsignificant; n = 3 animals.
Fig. 4.
Fig. 4.
Comparison of reactive gene expression in WT and IL-1α, TNF, and C1q knockout mice. (A) Heatmap comparing the expression of pan-reactive (genes induced by neuroinflammation or ischemia), A1-specific (genes induced by neuroinflammation), and A2-specfic (genes induced by ischemia) transcripts in whole brain RNA isolated from 14-mo-old WT and IL-1α, TNF, and C1q mice. Asterisks (*) denote significantly (P < 0.05) reduced expression of transcripts after averaging deltaCT gene Z scores from microfluidics qPCR. (BD) Bar charts depicting the fold change in expression of four aging-induced (Serpina3n, C4B, C3, and Cxcl10) genes in IL-1α, TNF, and C1q knockout mice compared with WT mice in the (B) hippocampus, (C) striatum, and (D) cortex. Error bars depict mean ± SEM. *P < 0.05; n = 3 animals for each genotype. FC, fold change.
Fig. 5.
Fig. 5.
Comparison of the induction of reactive astrocyte genes in response to LPS treatment with age. (A) Representative images of C4B colocalization with Slc1a3+ astrocytes, by in situ hybridization, in the hippocampus of aged (2 y old) PBS-injected and LPS-treated (5 mg/kg) mice. (Scale bars, 50 µm.) (B) Representative images of Cxcl10 colocalization with Slc1a3+ astrocytes, by in situ hybridization, in the hippocampus of mature adult (10 wk) and aged (2 y old) LPS-treated (5 mg/kg) mice. (Scale bars, 50 µm.) (CE) Bar graphs comparing the number of hippocampal Slc1a3+ astrocytes expressing reactive astrocyte transcripts [(C) Serpina3n, (D) C4B, and (E) Cxcl10] in PBS-injected and LPS-treated mice at P30, 10 wk, and 2 y of age. (FH) Bar graphs comparing the number of striatal Slc1a3+ astrocytes expressing reactive astrocyte transcripts [(F) Serpina3n, (G) C4B, and (H) Cxcl10] in PBS-injected and LPS-treated mice at P30, 10 wk, and 2 y of age. (IK) Bar graphs comparing the number of striatal Slc1a3+ astrocytes expressing reactive astrocyte transcripts [(I) Serpina3n, (J) C4B, and (K) Cxcl10] in PBS-injected and LPS-treated mice at P30, 10 wk, and 2 y of age. Error bars depict mean ± SEM. ****P < 0.0001; ***P < 0.001; **P < 0.01; *P < 0.05; n = 3 animals. See also Figs. S3S6.

References

    1. Christopherson KS, et al. Thrombospondins are astrocyte-secreted proteins that promote CNS synaptogenesis. Cell. 2005;120:421–433. - PubMed
    1. Kucukdereli H, et al. Control of excitatory CNS synaptogenesis by astrocyte-secreted proteins Hevin and SPARC. Proc Natl Acad Sci USA. 2011;108:E440–E449. - PMC - PubMed
    1. Allen NJ, et al. Astrocyte glypicans 4 and 6 promote formation of excitatory synapses via GluA1 AMPA receptors. Nature. 2012;486:410–414. - PMC - PubMed
    1. Chung WS, et al. Astrocytes mediate synapse elimination through MEGF10 and MERTK pathways. Nature. 2013;504:394–400. - PMC - PubMed
    1. Banker GA. Trophic interactions between astroglial cells and hippocampal neurons in culture. Science. 1980;209:809–810. - PubMed

Publication types

MeSH terms