. 2018 Mar 28;92(8):e02184-17.
doi: 10.1128/JVI.02184-17. Print 2018 Apr 15.

Herpes Simplex Virus 1 Dramatically Alters Loading and Positioning of RNA Polymerase II on Host Genes Early in Infection

Affiliations

Herpes Simplex Virus 1 Dramatically Alters Loading and Positioning of RNA Polymerase II on Host Genes Early in Infection

Claire H Birkenheuer et al. J Virol. .

Abstract

Herpes simplex virus 1 (HSV-1) transcription is mediated by cellular RNA polymerase II (Pol II). Recent studies investigating how Pol II transcription of host genes is altered after HSV-1 are conflicting. Chromatin immunoprecipitation sequencing (ChIP-seq) studies suggest that Pol II is almost completely removed from host genes at 4 h postinfection (hpi), while 4-thiouridine (4SU) labeling experiments show that host transcription termination is extended at 7 hpi, implying that a significant amount of Pol II remains associated with host genes in infected cells. To address this discrepancy, we used precision nuclear run-on analysis (PRO-seq) to determine the location of Pol II to single-base-pair resolution in combination with quantitative reverse transcription-PCR (qRT-PCR) analysis at 3 hpi. HSV-1 decreased Pol II on approximately two-thirds of cellular genes but increased Pol II on others. For more than 85% of genes for which transcriptional termination could be statistically assessed, Pol II was displaced to positions downstream of the normal termination zone, suggesting extensive termination defects. Pol II amounts at the promoter, promoter-proximal pause site, and gene body were also modulated in a gene-specific manner. qRT-PCR of selected RNAs showed that HSV-1-induced extension of the termination zone strongly correlated with decreased RNA and mRNA accumulation. However, HSV-1-induced increases of Pol II occupancy on genes without termination zone extension correlated with increased cytoplasmic mRNA. Functional grouping of genes with increased Pol II occupancy suggested an upregulation of exosome secretion and downregulation of apoptosis, both of which are potentially beneficial to virus production.IMPORTANCE This study provides a map of RNA polymerase II location on host genes after infection with HSV-1 with greater detail than previous ChIP-seq studies and rectifies discrepancies between ChIP-seq data and 4SU labeling experiments with HSV-1. The data show the effects that a given change in RNA Pol II location on host genes has on the abundance of different RNA types, including nuclear, polyadenylated mRNA and cytoplasmic, polyadenylated mRNA. It gives a clearer understanding of how HSV-1 augments host transcription of some genes to provide an environment favorable to HSV-1 replication.

Keywords: RNA polymerases; herpes simplex virus; human herpesviruses; transcriptional regulation; transcriptional repression.


Figures

FIG 1
FIG 1
Methodology and validation of precision nuclear run-on analysis (PRO-seq) after HSV-1 infection. (A) Schematic representation of the precision nuclear run-on technique. HEp-2 cells were infected with HSV-1 at an MOI of 5, and infection was allowed to progress for 3 h before isolation of nuclei. Native nucleotides were replaced with biotinylated nucleotides, and nuclear run-on reactions occurred for 3 to 20 min. Incorporation of the biotinylated nucleotides inhibited further Pol II processivity. Nascent RNA transcripts were purified with magnetic, streptavidin-coated beads. Sequencing libraries were prepared: fragments were hydrolyzed to create ∼100-bp fragments, 3′ adapters were ligated, the 5′ caps were removed, and the 5′ ends were repaired before 5′ adapter ligations. The RNAs were reverse transcribed and then PCR amplified. The amplified libraries were polyacrylamide gel purified before being submitted for sequencing on the Illumina NextSeq500 platform. Bioinformatics analysis was performed with SeqMonk, and data were also viewed on the integrative genomics viewer (IGV). (B) Validation of the nuclear run-on analysis using [α-32P]CTP incorporation into nascent RNA in the presence and absence of biotinylated UTP. A reaction without nuclei was included as a negative control (open circles). Isolated nuclei were exposed to [α-32P]CTP and nonlabeled UTP, ATP, and GTP (closed circles) or [α-32P]CTP, biotinylated UTP, and nonlabeled ATP and GTP (closed boxes) and were allowed to “run on” for 5 or 20 min before RNA was isolated and subjected to scintillation counting. (C) Image of a representative polyacrylamide gel used to purify the libraries prepared from three replicates of mock-infected cells and from three replicates of HSV-1-infected cells. The libraries appeared on the gels as broad bands above the 120-bp primer dimer. The bands were excised, and DNA within them was purified and sequenced. (D) Pearson correlation scatter plots showing variation in read levels for each probe (dots) between HSV-1 and mock infection replicates (1 versus 2 and 1 versus 3). The R value shown is the Pearson correlation coefficient between reads for each probe between replicates. (E) Pearson correlation scatter plot showing variation between the HSV-1 and mock infection replicate sets. The R value shown is the Pearson correlation coefficient between average reads per probe in each data set.
FIG 2
FIG 2
Diagrams of different Pol II occupancy patterns in different gene regions after HSV-1 infection. (A) Diagram of a “generic gene” outlining various components. The TSS is defined by the large black arrow which originates at the first base pair of the mRNA transcript and indicates the direction of transcription. The 5′ and 3′ untranslated regions (UTRs) are defined by the narrow gray boxes, while exons are defined as the wider gray boxes. The AUG start codon is shows as a blue bar, and the poly(A) signal is defined by the red bar. The promoter-proximal pause region shown in yellow-orange is defined as the first 100 bp downstream of the TSS. The gene body is defined as +100 bp past the TSS to the poly(A) signal. The region downstream of the poly(A) signal was broken into two regions, the termination A region [the poly(A) signal to +1,500 bp past the poly(A) signal], and the termination B region [+1,500 bp past the poly(A) signal to +5,000 bp past the poly(A) signal]. The same diagram components are used to delineate portions of the individual genes shown in panels (B to F). (B to F) Coverage of reads from the PRO-seq analysis on the genes STUB1, USP8, MYC, EGR1, FOSB, respectively. Each diagram shows read coverage on the y axis and distance (in kilobases) from the TSS on the x axis. Components of each gene are shown in the diagram and are scaled to the distance indicated on the x axes. One representative sample of 3 replicates is shown for HSV-1 and mock infection. Each gene was chosen to illustrate a different pattern of Pol II occupancy across the gene.
FIG 3
FIG 3
Changes in global Pol II occupancy across different gene regions after HSV-1 infection. (A) Diagram of a “generic gene” outlining the various components probed for Pol II occupancy for the DESeq2 analysis in SeqMonk. (B) Changes in Pol II occupancy after HSV-1 infection in the promoter-proximal pause region (0 to 100 bp) downstream of the TSS are shown in the large center circle. Each subset was then analyzed for changes in Pol II occupancy within the gene body [+100 bp to poly(A) signal] (see Table S1 in the supplemental material). (C) Pol II termination extension into the termination B region of genes [+1,500 to +5,000 bp with respect to the poly(A) signal] after HSV-1 infection. Values reflect the ratios of reads in the A region to those in the B region before and after infection. An increase in Pol II occupancy within this region suggests termination defects caused by HSV-1 (see Table S2 in the supplemental material). The percentage of genes is shown for each section of the pie chart, and the exact number of genes found within each category is shown in parentheses. Changes were calculated by comparing reads from three biological replicates of infected cells to similar data from mock-infected cells. Statistical analysis was done using DESeq2. (See also Fig. 4.)
FIG 4
FIG 4
Analysis of Pol II occupancy in the Drosophila spike-in PRO-seq experiment. (A) Diagram of a “generic gene” outlining the various components probed for Pol II occupancy for the DESeq2 analysis in SeqMonk. (B) Pearson correlation scatter plots showing read correlations between mock and HSV-1 replicate sets with respect to the Drosophila genome and the human genome. R values indicate the Pearson correlation coefficient. (C) Changes in Pol II occupancy after HSV-1 infection in the promoter-proximal pause region (0 to 100 bp) downstream of the TSS are shown in the large center circle. Each subset from this pie chart was then analyzed for changes in Pol II occupancy within the gene body [+100 bp to poly(A) signal]. (D) Pol II termination extension into the termination B region of genes [+1,500 to +5,000 bp with respect to the poly(A) signal] after HSV-1 infection. The ratios of reads in the A region to those in the B region in analyzable genes (defined in the text) from mock-infected and HSV-infected cells were calculated. The percentage of genes is shown for each section, and the exact number of genes found within each category is shown in parentheses. Changes were calculated by comparing reads from three biological replicates of infected cells to similar data from mock-infected cells. Statistical analysis was done using DESeq2. An increase in Pol II occupancy in the B versus A region suggests termination defects caused by HSV-1.
FIG 5
FIG 5
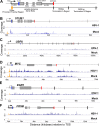
Validation of SDHA as a reference gene and screen shots of PRO-seq data for additional genes analyzed in the qRT-PCR experiments (A). CT values of the SDHA reference gene in different RNA samples from mock-infected and 3-h-HSV-1-infected HEp-2 cells and 3- and 6-h-HSV-1 infected CV1 cells, demonstrating SDHA as an appropriate, stable transcript for use as a reference standard. (B to D) PRO-seq readout of Pol II occupancy along the SDHA gene (B), the c-FOS gene (C), and the JUNB gene (D) in mock infection and 3 h after HSV-1 infection in HEp-2 cells. This occupancy correlates with SDHA's transcript stability and confirms the SeqMonk and DESeq2 global analysis of these genes shown in Table 1. The scale (kb) is indicated at the bottom of the diagram of each gene. The promoter-proximal pause sites are in yellow. Red vertical bars indicate the polyadenylation site. Vertical lines intersecting each gene define the limits of the termination A and B regions.

References

    1. Whitley R, Kimberlin DW, Prober CG. 2007. HSV-1 and 2: pathogenesis and disease, p 589–601. In Arvin A, Campadelli-Fiume G, Mocarski E, Moore PS, Roizman B, Whitley R, Yamanishi K (ed), Human herpesviruses: biology, therapy, and immunoprophylaxis. Cambridge University Press, Cambridge, United Kingdom. - PubMed
    1. Buratowski S. 2009. Progression through the RNA polymerase II CTD cycle. Mol Cell 36:541–546. doi:10.1016/j.molcel.2009.10.019. - DOI - PMC - PubMed
    1. Carey M, Peterson CL, Smale ST. 2009. Transcriptional regulation in eukaryotes: concepts, strategies, and techniques, 2nd ed Cold Spring Harbor Laboratory Press, Cold Spring Harbor, NY.
    1. Komarnitsky P, Cho EJ, Buratowski S. 2000. Different phosphorylated forms of RNA polymerase II and associated mRNA processing factors during transcription. Genes Dev 14:2452–2460. doi:10.1101/gad.824700. - DOI - PMC - PubMed
    1. Sogaard TM, Svejstrup JQ. 2007. Hyperphosphorylation of the C-terminal repeat domain of RNA polymerase II facilitates dissociation of its complex with mediator. J Biol Chem 282:14113–14120. doi:10.1074/jbc.M701345200. - DOI - PubMed

Publication types

MeSH terms