. 2018 Mar 16;359(6381):eaao0318.
doi: 10.1126/science.aao0318. Epub 2018 Feb 8.

Diurnal transcriptome atlas of a primate across major neural and peripheral tissues

Affiliations

Diurnal transcriptome atlas of a primate across major neural and peripheral tissues

Ludovic S Mure et al. Science. .

Abstract

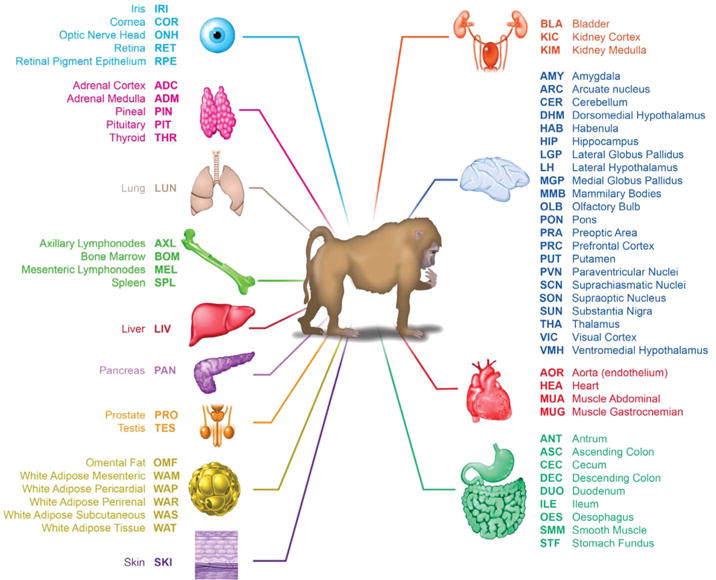
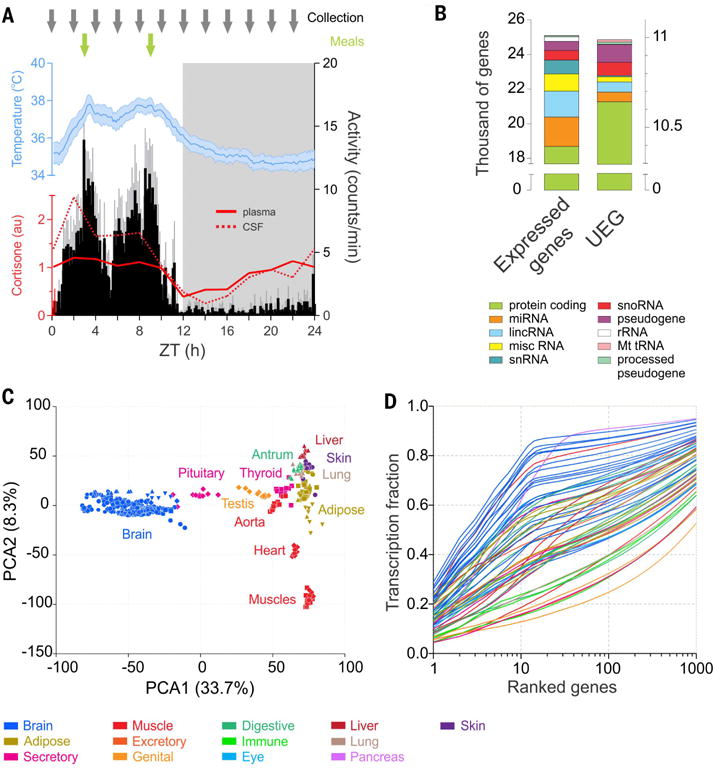
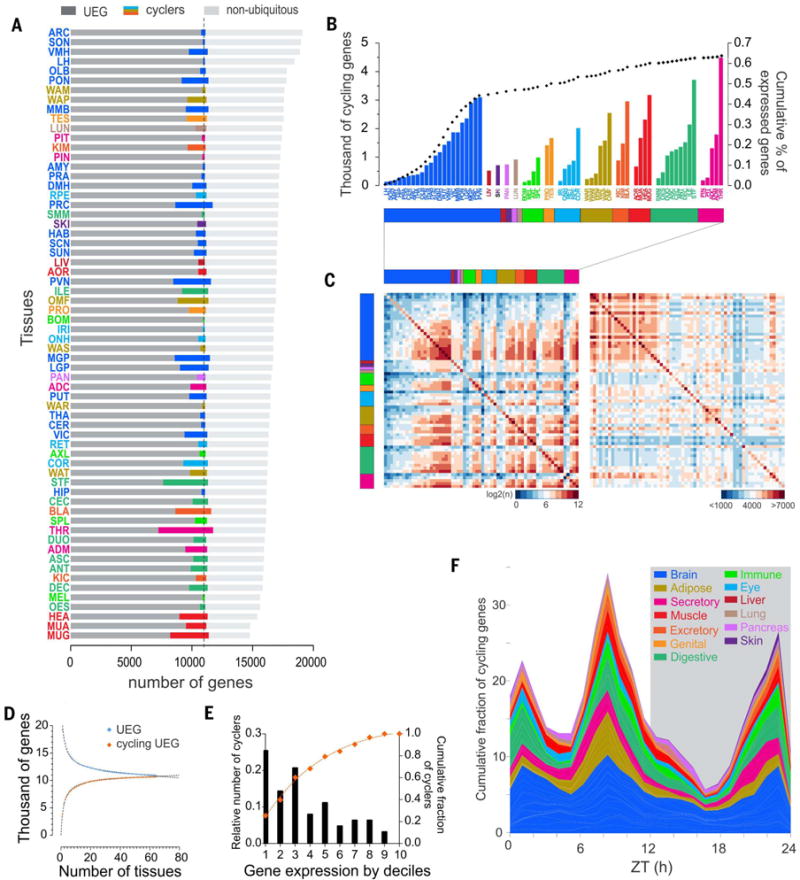
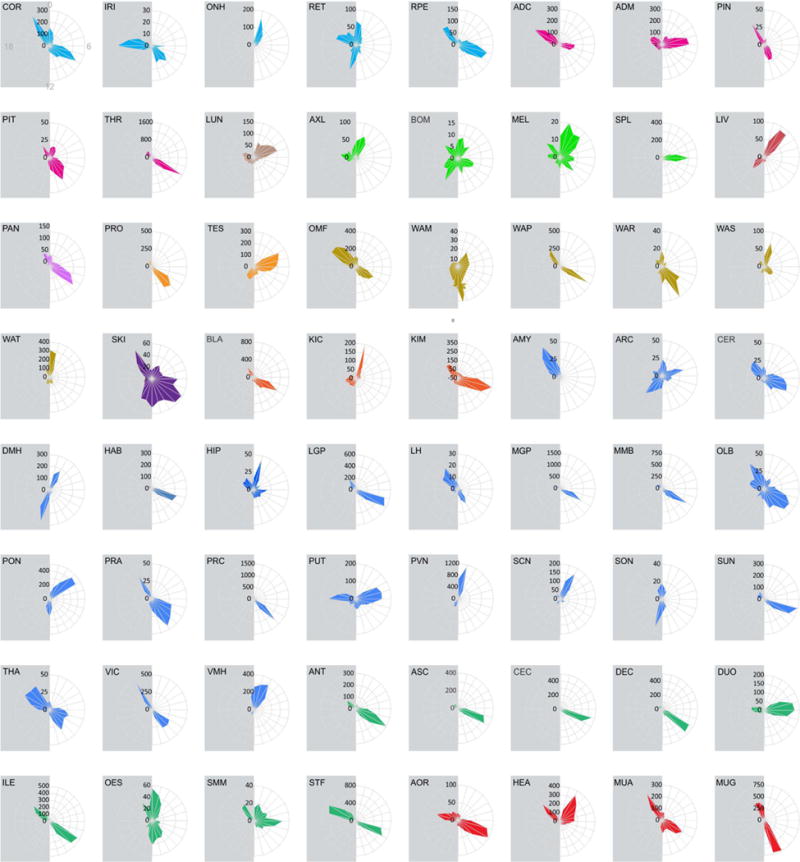
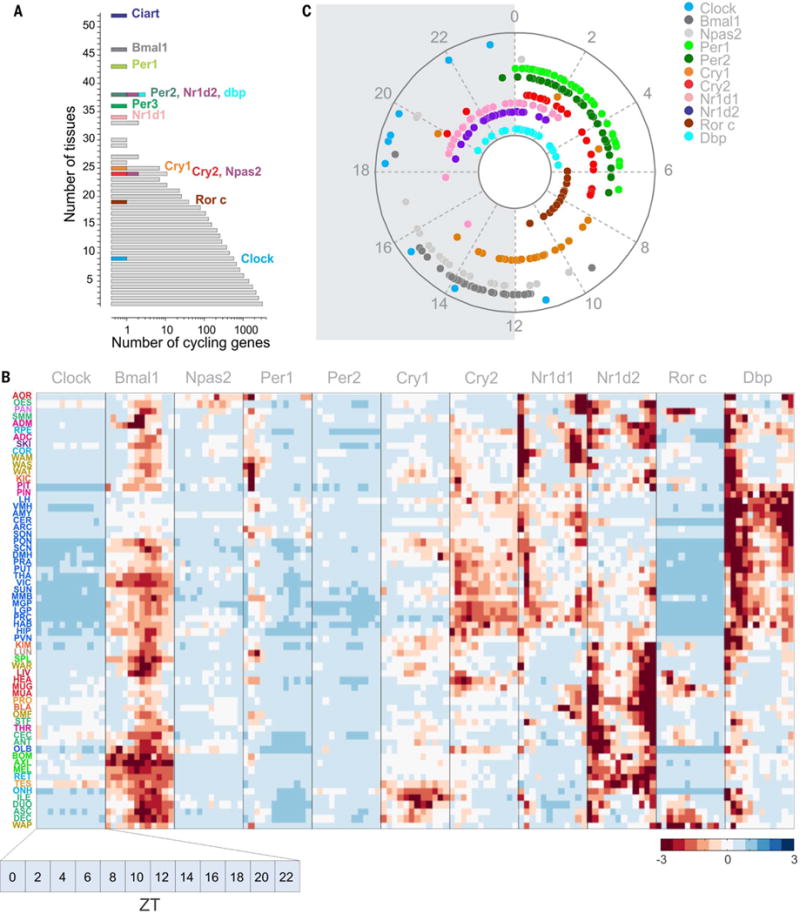
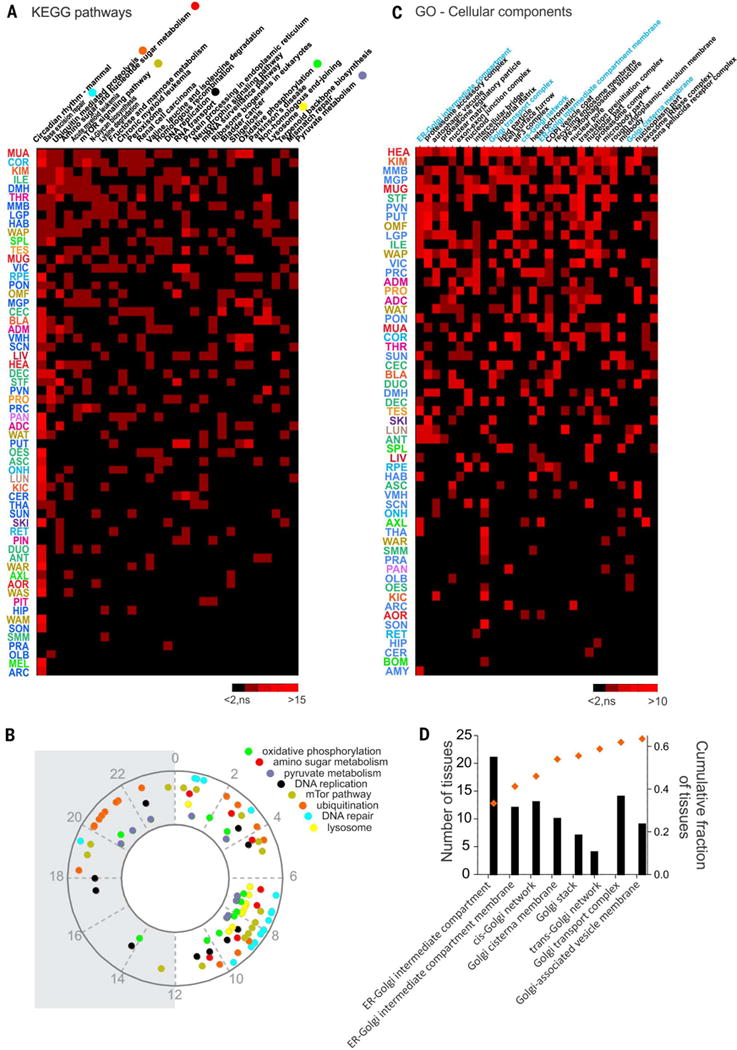
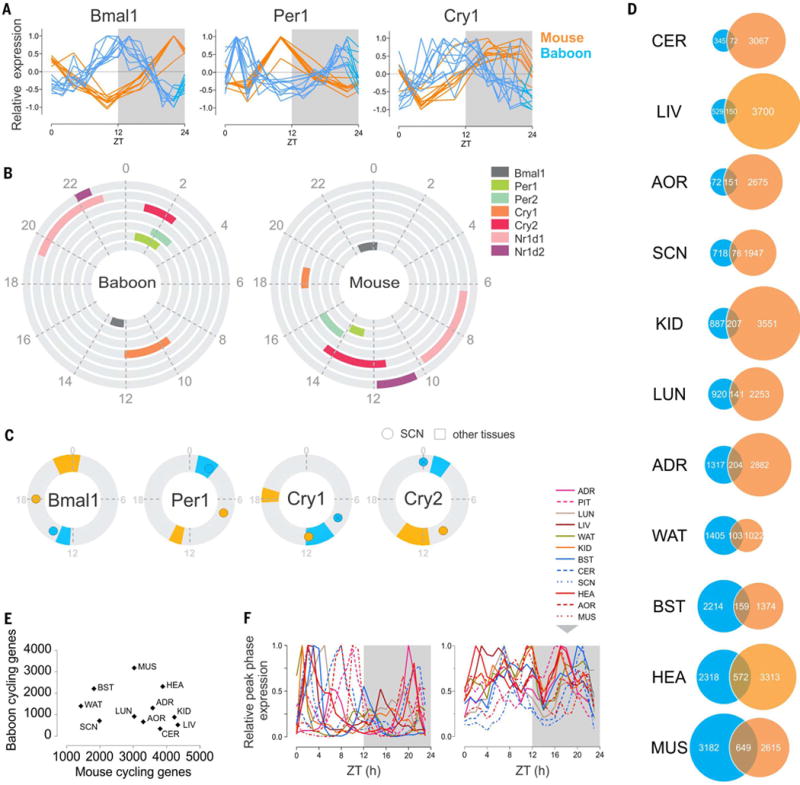
Diurnal gene expression patterns underlie time-of-the-day-specific functional specialization of tissues. However, available circadian gene expression atlases of a few organs are largely from nocturnal vertebrates. We report the diurnal transcriptome of 64 tissues, including 22 brain regions, sampled every 2 hours over 24 hours, from the primate Papio anubis (baboon). Genomic transcription was highly rhythmic, with up to 81.7% of protein-coding genes showing daily rhythms in expression. In addition to tissue-specific gene expression, the rhythmic transcriptome imparts another layer of functional specialization. Most ubiquitously expressed genes that participate in essential cellular functions exhibit rhythmic expression in a tissue-specific manner. The peak phases of rhythmic gene expression clustered around dawn and dusk, with a "quiescent period" during early night. Our findings also unveil a different temporal organization of central and peripheral tissues between diurnal and nocturnal animals.


Figures

Fig. 1
Fig. 1. Tissue collection
List of the 64 tissues collected, according to system and functional types (including 22 brain regions and nuclei).
Fig. 2
Fig. 2. Transcriptome complexity
(A) Timing of sampling (gray arrows) across the 24-hour cycle (dark phase in gray shading) and timing of meals (green arrows) superimposed on the daily cycles of locomotor activity (black), body temperature (blue) (averages for 12 animals, ± 95% confidence interval, over the 14 days preceding the sample collection, average activity and temperature periods respectively 23.98 ± 0.02 and 23.97 ± 0.07 hours), and cortisone (plasma, solid red line; cerebrospinal fluid, dotted red line). (B) Number of genes expressed (average FPKM of the 12 time points >0.1) in at least one of the 64 tissues (25,098, left) or present in all the tissues sampled (UEG, 10,989, right). Different colors indicate the gene types. (C) Principal component analysis performed on the 12 time points of 36 representative tissues shows clustering of similar tissues groups based on gene expression profiles. The 22 tissues constituting the brain group clustered very tightly apart from the peripheral organs. (D) Cumulative distribution of the average fraction of total transcription contributed by genes when sorted from most to least expressed in each tissue (x axis). In all figures, each tissue is color-coded according to its system or functional group presented in Fig. 1.
Fig. 3
Fig. 3. Rhythmic gene expression across tissues
(A) Number of rhythmic genes (colored bars) and their distribution in each tissue between the pool of genes expressed in all tissues (UEGs, dark gray) and the pool of genes expressed more specifically (light gray). (B) Rhythmic identity. Shown are the number of cycling genes per tissue (grouped according to type) and their relative contribution to the total pool of genes (dotted black line). (C) Tissue by tissue of the overlap of the cycling genes (left) and of expressed genes (right).The color coding represents the degree of the overlap: from blue, few common genes, to red, high number of shared genes [on the left, log2 (common cycling genes), and on the right <1000 to >7000 commonly expressed genes (excluding UEGs)]. Raw data is provided in table S6. (D) Number of UEGs and rhythmic UEGs detected as a function of the number of tissues sampled. Best-fit function is overlaid (R2 = 0.9909 and 0.9944, respectively) (E) Weights of rhythmic transcription. Shown is distribution according to deciles of expressed genes (from most expressed to least expressed) indicating where the highest proportion of rhythmic genes are located. The curve indicates the cumulative fraction of cycling genes according to their level of expression. (F) Cumulative distribution of the peak phases of gene expression in the different tissues (grouped by systems and functions) throughout the day–night cycle. Peak phases of gene expression were normalized to the maximum in each tissue.
Fig. 4
Fig. 4. Tissue-specific rhythmic gene expression
Radial plot of the distribution of the peak phase of expression of the cycling genes in each of the 64 tissues of the present atlas. On the first plot, gray indicates ZT, and number of gene peaks of expression are listed in black.
Fig. 5
Fig. 5. The molecular clock across tissues
(A) Distribution of the cycling genes ranked according to the number of tissues in which they cycle. The most frequent cycling clock component is Ciart, cycling in 52 tissues, followed by Bmal1 and Per. The contributions of the core clock components and output (Dbp) to this distribution are highlighted. (B) Detailed transcript abundance time course of the molecular clock components in the 64 tissues examined [log2(1 + FPKM)]. (C) Distribution of the peak phases of core clock components in the tissues where they are detected as cycling.
Fig. 6
Fig. 6. Rhythmic transcription drives coordinated cellular organization and rhythmic physiology
(A) Heatmap of the KEGG pathways enriched for cycling genes in more than 10 tissues. Pathways satisfying the criteria of overrepresentation analysis (ORA) (gene number > 2, z score > 2, and permuted P < 0.05) are shown in red (red intensity codes for the z score). Insignificantly enriched pathways are represented in black. (B) Phase distribution over the 24-hour cycle of representative KEGG pathways. Phases were calculated and statistically tested with the PSEA tool. (C) Heat-map of the GO cell components terms enriched for cycling genes in more than 10 tissues. Red indicates the pathways satisfying the criteria of overrepresentation analysis as described for (A). (D) Histogram of the number of tissues showing overrepresentation for Golgi-related GO-cellular component terms sorted from the cis to the trans side of the Golgi apparatus. Superimposed is the cumulative fraction of the rhythmic regulation for each GO term in the 45 tissues (out of 64) in which at least one of these GO terms that are related to the Golgi apparatus was cycling.
Fig. 7
Fig. 7. Comparison of rhythmic transcriptome organization in the diurnal primate and nocturnal rodent
(A) Normalized daily expression profiles of Bmal1, Per1, and Cry1 across 10 tissues in mouse and baboon (ADR, AOR, BST, CER, HEA, KID, LIV, LUN, MUS, and WAT). (B) Phase distribution of the main clock genes in the baboon (left) and the mouse (right). The colored fraction of the rings corresponds to the confidence interval (95%) of the phases of the corresponding clock genes in the tissues in which these genes were detected as cycling. (C) Comparison of the phase of Bmal1, Per1, Cry1, and Cry2 in the SCN (dot) and in the other the tissues (95% confidence interval) in mouse (orange) and baboon (blue). Baboon Cry1 and Cry2 are not detected as cycling in the SCN; their maximum expression is represented (crossed circle). (D) Numbers of cycling genes in selected tissues compared in the baboon and the mouse and overlap of common cycling genes in the two species. (E) A tissue-by-tissue comparison showing the lack of correlation of the number of cycling genes in the baboon and in the mouse (R2 = 0.086, P = 0.38). (F) Normalized peak phases of gene expression in 12 tissues throughout the day (left in the baboon, right in the mouse).

Comment in

References

    1. Zhang R, Lahens NF, Ballance HI, Hughes ME, Hogenesch JB. A circadian gene expression atlas in mammals: Implications for biology and medicine. Proc Natl Acad Sci USA. 2014;111:16219–16224. doi: 10.1073/pnas.1408886111. - DOI - PMC - PubMed
    1. Ceriani MF, et al. Genome-wide expression analysis in Drosophila reveals genes controlling circadian behavior. J Neurosci. 2002;22:9305–9319. - PMC - PubMed
    1. Harmer SL, et al. Orchestrated transcription of key pathways in Arabidopsis by the circadian clock. Science. 2000;290:2110–2113. doi: 10.1126/science.290.5499.2110. - DOI - PubMed
    1. Oster H, et al. The functional and clinical significance of the 24-h rhythm of circulating glucocorticoids. Endocr Rev. 2016;38:er20151080. doi: 10.1210/er.2015-1080. - DOI - PMC - PubMed
    1. Schwartz WJ, Reppert SM, Eagan SM, Moore-Ede MC. In vivo metabolic activity of the suprachiasmatic nuclei: A comparative study. Brain Res. 1983;274:184–187. doi: 10.1016/0006-89938390538-3. - DOI - PubMed

Publication types