Review
. 2018 Feb 8;221(Pt 3):jeb151167.
doi: 10.1242/jeb.151167.

New techniques, applications and perspectives in neuropeptide research

Affiliations
Review

New techniques, applications and perspectives in neuropeptide research

Kellen DeLaney et al. J Exp Biol. .

Abstract

Neuropeptides are one of the most diverse classes of signaling molecules and have attracted great interest over the years owing to their roles in regulation of a wide range of physiological processes. However, there are unique challenges associated with neuropeptide studies stemming from the highly variable molecular sizes of the peptides, low in vivo concentrations, high degree of structural diversity and large number of isoforms. As a result, much effort has been focused on developing new techniques for studying neuropeptides, as well as novel applications directed towards learning more about these endogenous peptides. The areas of importance for neuropeptide studies include structure, localization within tissues, interaction with their receptors, including ion channels, and physiological function. Here, we discuss these aspects and the associated techniques, focusing on technologies that have demonstrated potential in advancing the field in recent years. Most identification and structural information has been gained by mass spectrometry, either alone or with confirmations from other techniques, such as nuclear magnetic resonance spectroscopy and other spectroscopic tools. While mass spectrometry and bioinformatic tools have proven to be the most powerful for large-scale analyses, they still rely heavily on complementary methods for confirmation. Localization within tissues, for example, can be probed by mass spectrometry imaging, immunohistochemistry and radioimmunoassays. Functional information has been gained primarily from behavioral studies coupled with tissue-specific assays, electrophysiology, mass spectrometry and optogenetic tools. Concerning the receptors for neuropeptides, the discovery of ion channels that are directly gated by neuropeptides opens up the possibility of developing a new generation of tools for neuroscience, which could be used to monitor neuropeptide release or to specifically change the membrane potential of neurons. It is expected that future neuropeptide research will involve the integration of complementary bioanalytical technologies and functional assays.

Keywords: Electrophysiology; FaNaC/HyNaC; Immunochemistry; Mass spectrometry; Neuropeptides; Peptide-gated ion channel.


Conflict of interest statement

Competing interestsThe authors declare no competing or financial interests.

Figures

Fig. 1.
Fig. 1.
A general depiction of the importance of structure, function and localization to provide key information about a neuropeptide. Several methods for each area of the Venn diagram are highlighted. For structure tools, MS, computational prediction and NMR are shown. MALDI MSI and IHC are the examples depicted for tools to provide localization. For understanding functionality, quantification, behavioral studies and electrophysiology are core techniques.
Fig. 2.
Fig. 2.
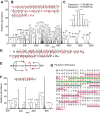
Depiction of de novo sequencing of peptides by using MS. (A) High-resolution tandem MS with sequence-specific fragment ions annotated. (B) Sequence assignment based on fragmentations, in which mass differences between adjacent fragment ion peaks are matched to amino acids. The tick marks shown indicate locations of cleavage sites that led to the fragments detected in the spectrum. (C) Enlarged, high-resolution spectrum showing mass accuracy and isotopic distribution (necessary for measurements of differences between molecules with the same nominal mass). (D) Display of the sequence coverage. Each tick mark indicates the cleavage of the peptide yielding a fragment that has been detected in the MS spectrum. The more fragments that are detected, the greater the sequence coverage. (E) Representation of the different types of ions produced in tandem MS depending on fragmentation method used and bond cleavage sites. The cleavage sites are indicative of typical fragmentation patterns characteristic of the two common types of fragmentation methods. The b and y ions are produced during HCD and CID fragmentation, and c and z ions are produced during ETD fragmentation. (F) Tandem mass spectrum of another peptide (from Jonah crab Cancer borealis tachykinin-related peptide) with fragments indicated. (G) Comparison between peptides detected with MS (different colored lines indicate different detected peptides) and those predicted based on the precursor cDNA sequence of the spiny lobster Panulirus interruptus (highlighted in red). Adapted with permission from Ye et al. (2015). CID, collision-induced dissociation; ETD, electron transfer dissociation; HCD, higher-energy collisional dissociation.
Fig. 3.
Fig. 3.
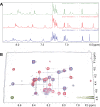
NMR spectra of a peptide standard of the neuropeptide pheromonotropin, originally discovered in an extract from the head of Mythimna (Pseudaletia) separata (armyworm) larvae. (A) One-dimensional [1H] NMR spectra collected at different temperatures, showing differences in chemical shift of NH protons in the peptide. The dependence of chemical shift on temperature is indicative of the degree of hydrogen bonding. Values below 3.00 ppb (chemical shift) per unit Kelvin indicate the presence of strong hydrogen bonds. As can be seen, the values for this peptide fall above that threshold, revealing that the protons are freely exposed to the solvent in this conformation. (B) Two-dimensional NMR spectra [total correlated spectroscopy (TOCSY) in blue, and rotating-frame Overhauser spectroscopy (ROESY) in red], showing a sequential assignment walk. The TOCSY spectrum provided information on NH-αH cross peaks, while cross peaks from the ROESY spectrum represent NHi-αH(i-1). Adapted with permission from Bhattacharya et al. (2015).
Fig. 4.
Fig. 4.
In order to achieve better profiling depth during MS imaging of neuropeptides, a spiral step method has been developed. Instead of the classical raster step (A), a spiral square (B) is set up. In the example spiral, the square is broken into nine individual steps. The first square is an MS scan (dark blue), while the two following squares (light blue) are tandem MS scans. This repeats three times until all nine steps in the spiral are completed. Each square is a raster step of 50 μm, with the whole spiral being 150 μm. This system can be customized to balance MS and tandem MS scans. For example, step one could be an MS scan, while squares 2–9 could be tandem MS scans if the user desires. Furthermore, this method can be targeted or used with data-dependent acquisition (DDA). For DDA experiments, the highest intensity peaks are chosen for tandem MS analysis. Since neuropeptides tend to be in low abundance compared to lipids and have a wide mass range, we can segregate the spiral step method into multiple mass ranges (e.g. three) to improve sampling of neuropeptides (C). The distinct m/z ranges are shown in the three different colors in the spectrum (OuYang et al., 2015a).
Fig. 5.
Fig. 5.
A graphical representation of whole-cell patch clamp electrophysiology readings. In this image, subfornical organ neurons from rat brains are being exposed to 10 nmol l−1 nesfatin-1, an anorexigenic neuropeptide, at the time frame indicated by the line under the graph. When exposed, neurons can either become slightly depolarized, which is associated with an increase in firing frequency (A) or slightly hyperpolarized, which is associated with a decrease in firing frequency (B). Adapted with permission from Kuksis and Ferguson (2017).
Fig. 6.
Fig. 6.
Properties of peptide-gated HyNaCs. (A) Left, cartoon illustrating the three-dimensional structure of a channel. The ligand-binding site is unknown and is drawn here at the interface of two subunits for illustration. Right, HyNaCs can be either open or closed. The equilibrium between these two conformations is shifted by binding of a RFamide peptide (blue) to the extracellular domain. (B) HyNaCs can be repeatedly activated by their ligand, Hydra RFamide I (RF I), and do not desensitize. The inward current is carried by Na+ and Ca2+ (orange circles) Used with permission from Dürrnagel et al., 2012. (C) Cartoon illustrating how a peptide covalently linked to the channel could be moved into and out of its binding site by application of light via a photoisomerizable linker (a ‘light-switch’, red).

Similar articles

Cited by

References

    1. Abels M., Riva M., Bennet H., Ahlqvist E., Dyachok O., Nagaraj V., Shcherbina L., Fred R. G., Poon W., Sorhede-Winzell M. et al. (2016). CART is overexpressed in human type 2 diabetic islets and inhibits glucagon secretion and increases insulin secretion. Diabetologia 59, 1928-1937. 10.1007/s00125-016-4020-6 - DOI - PubMed
    1. Aguilar M. B., Zugasti-Cruz A., Falcon A., Batista C. V., Olivera B. M. and de la Cotera E. P. (2013). A novel arrangement of Cys residues in a paralytic peptide of Conus cancellatus (jr. syn.: Conus austini), a worm-hunting snail from the Gulf of Mexico. Peptides 41, 38-44. 10.1016/j.peptides.2013.02.016 - DOI - PMC - PubMed
    1. Ahlf Wheatcraft D. R., Xin L. and Hummon A. B. (2014). Sample preparation strategies for mass spectrometry imaging of 3D cell culture models. J. Vis. Exp. 94, e52313 10.3791/52313 - DOI - PMC - PubMed
    1. Akhtar M. N., Southey B. R., Andrén P. E., Sweedler J. V. and Rodriguez-Zas S. L. (2014). Identification of best indicators of peptide-spectrum match using a permutation resampling approach. J. Bioinform. Comput. Biol. 12, 1440001 10.1142/S0219720014400010 - DOI - PMC - PubMed
    1. Altun Z. F., Herndon L. A., Wolkow C. A., Crocker C., Lints R. and Hall D. H. (eds) (2002-2018). WormAtlas. http://www.wormatlas.org.

Publication types