. 2018 Apr 27;38(2):BSR20170203.
doi: 10.1042/BSR20170203.

Image processing for cryogenic transmission electron microscopy of symmetry-mismatched complexes

Affiliations

Image processing for cryogenic transmission electron microscopy of symmetry-mismatched complexes

Juha T Huiskonen. Biosci Rep. .

Abstract

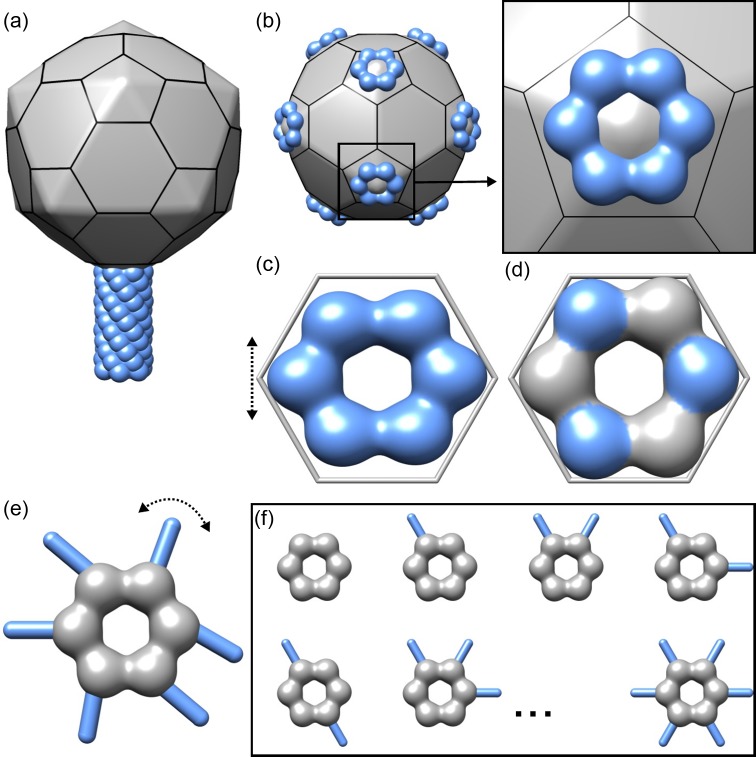
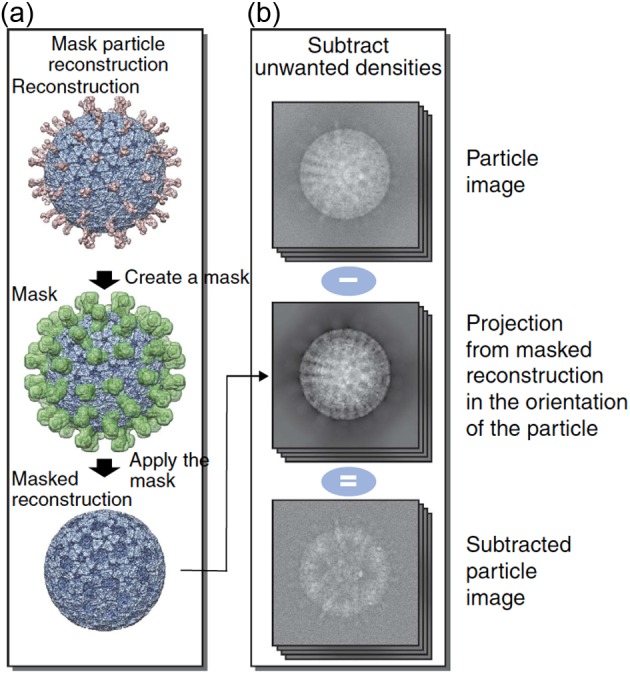
Cryogenic transmission electron microscopy (cryo-TEM) is a high-resolution biological imaging method, whereby biological samples, such as purified proteins, macromolecular complexes, viral particles, organelles and cells, are embedded in vitreous ice preserving their native structures. Due to sensitivity of biological materials to the electron beam of the microscope, only relatively low electron doses can be applied during imaging. As a result, the signal arising from the structure of interest is overpowered by noise in the images. To increase the signal-to-noise ratio, different image processing-based strategies that aim at coherent averaging of signal have been devised. In such strategies, images are generally assumed to arise from multiple identical copies of the structure. Prior to averaging, the images must be grouped according to the view of the structure they represent and images representing the same view must be simultaneously aligned relatively to each other. For computational reconstruction of the three-dimensional structure, images must contain different views of the original structure. Structures with multiple symmetry-related substructures are advantageous in averaging approaches because each image provides multiple views of the substructures. However, the symmetry assumption may be valid for only parts of the structure, leading to incoherent averaging of the other parts. Several image processing approaches have been adapted to tackle symmetry-mismatched substructures with increasing success. Such structures are ubiquitous in nature and further computational method development is needed to understanding their biological functions.

Keywords: Cryo-EM; asymmetric reconstruction; expanding symmetry; focused classification and refinement; localized reconstruction; symmetry mismatch.


Conflict of interest statement

The author declares no conflict of interest.

Figures

Figure 1
Figure 1. Different types of symmetry mismatches in macromolecular complexes
(a) A schematic model of an icosahedrally symmetric particle (gray) with a symmetry-mismatched tail with C6 symmetry (blue) bound to one of the five-fold vertices of the particle (one I-C5–C6 symmetry mismatch). (b) An icosahedrally symmetric particle with 12 hexamers (C6 symmetry) bound to each of the 12 five-fold vertices (12 I-C5–C6 symmetry mismatches). The inset shows a close-up of the vertex outlined with a box. Coloring as in (a). (c) A model for a quasi-symmetric hexamer (blue; qC6 symmetry mismatch). An equilateral hexagon (gray) is shown for a reference. The direction of distortion is indicated with an double arrow. (d) A model for a pseudo-symmetric hexamer (pC6 symmetry mismatch). Despite perfect six-fold shape at low resolution, three of the subunits are different in their sequence (blue) from the rest of the subunits (gray), illustrated here with different colors. (e) A model for a hexameric structure (gray) where each of the subunits binds a flexible appendix (blue; six C6-C1–fC1 symmetry mismatches). The direction of flexibility in the appendices is indicated with a double arrow. (f) Illustration of hexamers with appendices manifesting variable occupancy (a population of particles with C6-C1–vC1 symmetry mismatches). The fact that not all possible occupancy states are shown is indicated with three dots.
Figure 2
Figure 2. Asymmetric reconstruction of bacteriophage MS2
(a) Radially depth cued isosurface representation of the asymmetric reconstruction of MS2 virion. Density has been colored from gray to green to cyan to blue to yellow, in the order of small to large radius. Scale bar, 100 Å. (b) A cut open view of the density under the A-protein (yellow). Ordered RNA density is in gray. Figure reproduced from [15].
Figure 3
Figure 3. Partial signal subtraction
(a) Subtraction of unwanted densities is illustrated using the rotavirus particle as an example. To subtract the virus capsid (blue) to allow analysis of the spikes (red), first a mask (green) corresponding to the spike densities is defined. A masked reconstruction, where the spikes have been removed, is calculated. (b) Computational projections of the masked reconstruction are subtracted from the experimental images of the particles. This results in images that contain contribution from the spikes only. These images can then be used to analyze the structure of the spikes without interference from the capsid. Figure reproduced from [4].
Figure 4
Figure 4. Typical workflow for localized reconstruction
Schematic diagram of the workflow for localized reconstruction. First the structure of the macromolecular complex is solved using conventional 3D refinement (1), after which the locations of the substructures (red spheres) are calculated based on the particle orientation, a symmetry operator and a vector defining one substructure relative to the particle model (red stick; 2). After extracting the sub-particles (red dots) from the particle images, a localized 3D reconstruction is calculated (3). This reconstruction can be used as a starting model for further classification (4) and 3D refinement (5) of sub-particles to improve the structure. Finally two independent sets of data (6) are compared by Fourier shell correlation (FSC) to assess the resolution of the reconstruction (7). Figure and legend reproduced from [4].
Figure 5
Figure 5. Hexameric packaging NTPase of bacteriophage ϕ6
(ac) Localized reconstruction of the hexamer, reconstructed with six-fold symmetry, is shown from the top (a), side (b) and below (c). Atomic model of the hexamer (PDB:4BLO) fitted in the reconstruction is colored from red (C-terminus) to blue (N-terminus). Flexible loops that were unresolved are indicated (arrow). (df) Same views as in (a)–(c) showing the asymmetric localized reconstruction. Five neighboring proteins (P8) around the hexamer are labeled in (d). The edge of the mask cutting through the protein shell (P1) under the hexamer is indicated with a dashed line in (e). Three densities possibly connecting the P1 shell to the C-termini of the hexamer are indicated with arrows in (f). Figure reproduced from [12].
Figure 6
Figure 6. Foot and mouth disease virus binding to integrin receptor
(a) Localized reconstruction of the integrin molecule (orange and mint) engaged with the binding site on the underlying viral capsid (different capsid proteins colored in blue, red, and yellow). A resolved glycan is in magenta. (b) A close-up of the integrin–capsid interaction. The RGD-loop interacting with the integrin is in blue. Reproduced from [5].
Figure 7
Figure 7. Improving the reconstruction of native COPII cages by localized reconstruction
(a) Reconstruction of the COPII cage determined by conventional refinement from native particles and assuming octahedral symmetry. Due to flexibility, the resolution is limited to 35 Å [4]. (b) One vertex of the COPII cage, extracted from the reconstruction calculated from fixed particles at 12 Å resolution [21] and aligned along its C2 symmetry axis. (c) Reconstruction of the vertex, solved by localized reconstruction from the same particles as used in (a). At improved resolution of 14 Å, similar features were resolved as by fixing the particles. Figure reproduced from [4].

References

    1. Frank J. (2006) Three-Dimensional Electron Microscopy of Macromolecular Assemblies, Oxford University Press
    1. Roh S.-H., et al. (2017) Subunit conformational variation within individual GroEL oligomers resolved by Cryo-EM. Proc. Natl. Acad. Sci. USA 114, 8259–8264 10.1073/pnas.1704725114 - DOI - PMC - PubMed
    1. Beck M., Lucić V., Förster F., Baumeister W. and Medalia O. (2007) Snapshots of nuclear pore complexes in action captured by cryo-electron tomography. Nature 449, 611–615 10.1038/nature06170 - DOI - PubMed
    1. Ilca S.L., et al. (2015) Localized reconstruction of subunits from electron cryomicroscopy images of macromolecular complexes. Nat. Commun. 6, 8843 10.1038/ncomms9843 - DOI - PMC - PubMed
    1. Kotecha A., et al. (2017) Rules of engagement between αvβ6 integrin and foot-and-mouth disease virus. Nat. Commun. 8, 15408 10.1038/ncomms15408 - DOI - PMC - PubMed

LinkOut - more resources